Bullish View On BATA # Bata India – Business Model
## 1. Company Overview
Bata India Limited is one of India's leading footwear companies and is part of the global Bata Shoe Organization. The company operates primarily in the **footwear and accessories** segment and serves consumers across men's, women's and children'
Bata India Ltd
No trades
No trades
Compare with Bata India Ltd
11.35 INR
1.34 B INR
35.15 B INR
63.65 M
Next report date
—
Report period
—
EPS estimate
—
Revenue estimate
—
Company info
Sector
Industry
CEO
Sanjay S. Rao
Website
Headquarters
Gurugram
Founded
1931
IPO date
Nov 3, 1994
ISIN
INE176A01028
FIGI
BBG000D2VLW4
Identifiers
ISIN INE176A01028
Bata India Ltd. engages in the manufacture and retail of footwear for men, women, and kids. It operates under the India and Outside India geographical segments. It offers a range of footwear products and accessories under the Bata, Hush Puppies, Naturalizer, North Star, Marie Claire, Weinbrenner, North Star, Scholl, Bubblegummers, and Disney brands. The company was founded on December 23, 1931 and is headquartered in Gurugram, India.
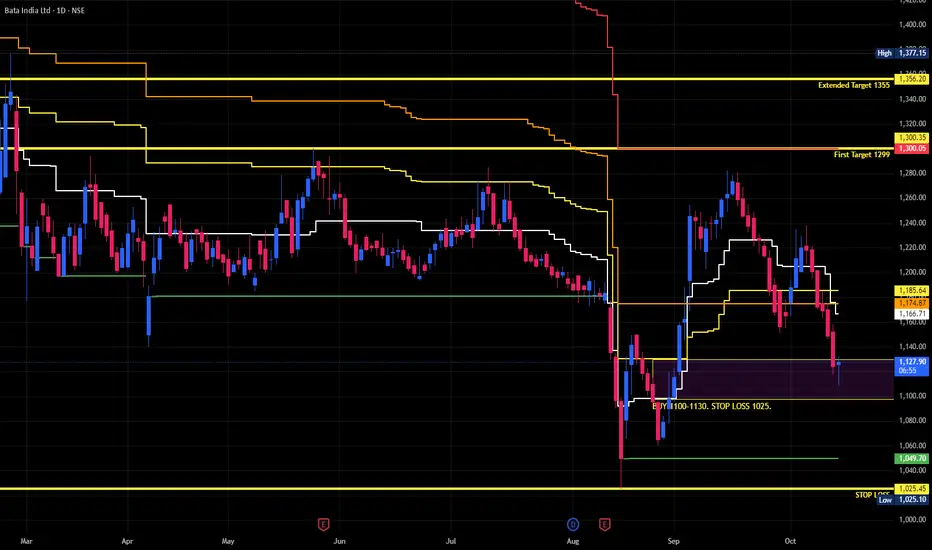
bata india : healthy risk reward 1. Retest of the Mother Candle Demand Zone
The sharp rally triggered by the new CEO announcement failed to sustain, but the subsequent decline found support almost exactly at the low of the impulsive "mother candle." This successful retest suggests institutional demand remains active, with buyers de
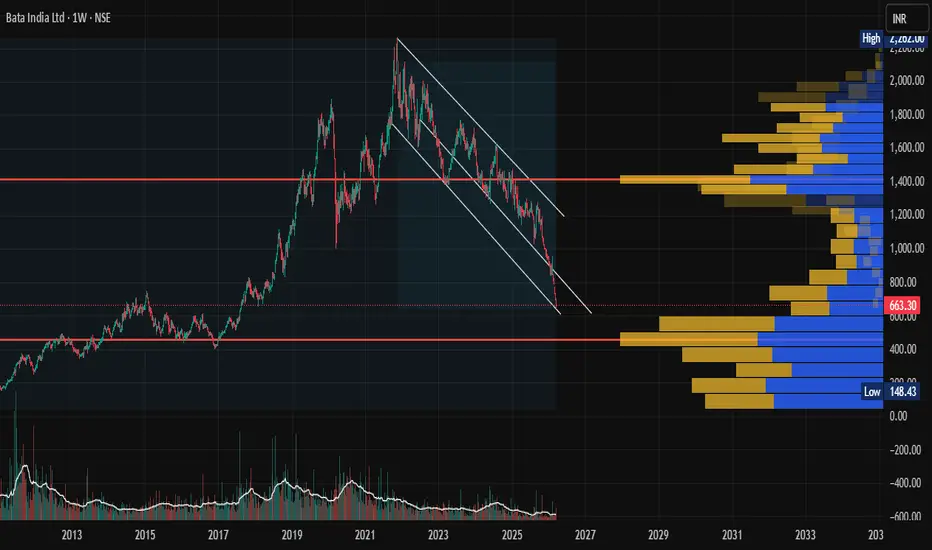
BATA INDIA at Strong Support ZoneBATA india is having very strong support zone of 622-610 INR. also almost touches downward channel support area, expected strong rebound towards 1400 INR. This is investment type of idea not for treaders and short term swing traders.
I am not a SEBI-registered Research Analyst. The information pro
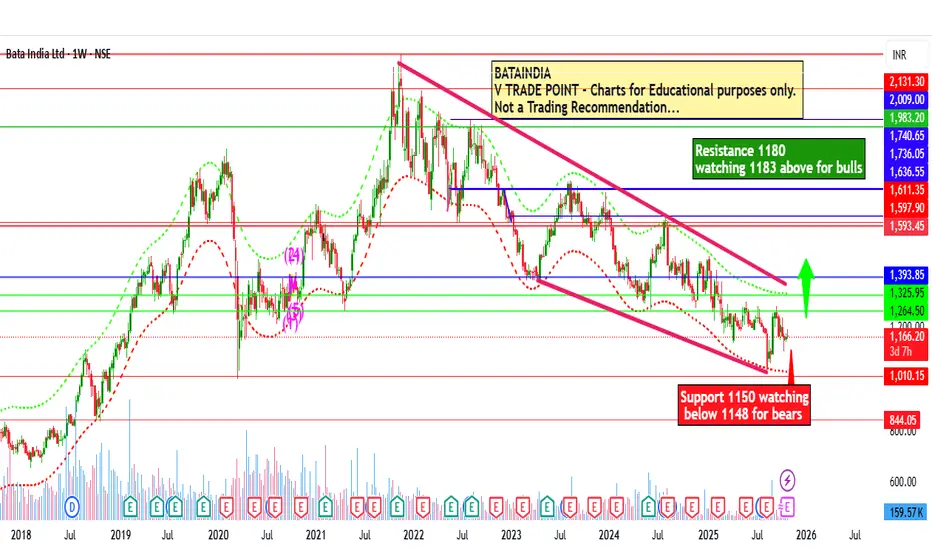
Bata India Ltd for 28th Oct #BATAINDIA Bata India Ltd for 28th Oct #BATAINDIA
Resistance 1180 Watching above 1183 for upside momentum.
Support area 1150 Below 1160-1165 gnoring upside momentum for intraday
Watching below 1143 for downside movement...
Above 1160 ignoring downside move for intraday
Charts for Educational purposes only.
Bata - Momentum + improving RSI + MA crossovers supportBata – Technical Setup
Trend Context: After a prolonged bearish phase, Bata has shown signs of reversal from a strong support zone around ₹1100.
Price Action: Recently, the stock formed a base near support and has now given a trendline/neckline breakout. On the daily chart, the inside candle break
See all ideas
Summarizing what the indicators are suggesting.
Neutral
Neutral
Neutral
An aggregate view of professional's ratings.
Neutral
Neutral
Neutral
Displays a symbol's price movements over previous years to identify recurring trends.
Weight0.20%
Market value52.47 K
Weight0.03%
Market value22.46 K
Weight0.20%
Market value17.31 K
Weight0.05%
Market value4.62 K
Explore more ETFs
Frequently asked questions
The current price of BATAINDIA is 615.30 INR — it has decreased by −1.15% in the past 24 hours. Watch Bata India Ltd stock price performance more closely on the chart.
Depending on the exchange, the stock ticker may vary. For instance, on BSE exchange Bata India Ltd stocks are traded under the ticker BATAINDIA.
BATAINDIA stock has fallen by −1.04% compared to the previous week, the month change is a −8.80% fall, over the last year Bata India Ltd has showed a −49.50% decrease.
We've gathered analysts' opinions on Bata India Ltd future price: according to them, BATAINDIA price has a max estimate of 839.00 INR and a min estimate of 598.00 INR. Watch BATAINDIA chart and read a more detailed Bata India Ltd stock forecast: see what analysts think of Bata India Ltd and suggest that you do with its stocks.
BATAINDIA reached its all-time high on Nov 16, 2021 with the price of 2,261.65 INR, and its all-time low was 18.60 INR and was reached on Nov 5, 2003. View more price dynamics on BATAINDIA chart.
See other stocks reaching their highest and lowest prices.
BATAINDIA stock is 1.70% volatile and has beta coefficient of 1.12. Track Bata India Ltd stock price on the chart and check out the list of the most volatile stocks — is Bata India Ltd there?
Today Bata India Ltd has the market capitalization of 79.77 B, it has decreased by −1.00% over the last week.
Yes, you can track Bata India Ltd financials in yearly and quarterly reports right on TradingView.
Bata India Ltd is going to release the next earnings report on Nov 11, 2026. Keep track of upcoming events with our Earnings Calendar.
BATAINDIA earnings for the last quarter are 5.00 INR per share, whereas the estimation was 4.60 INR resulting in a 8.70% surprise. The estimated earnings for the next quarter are 1.80 INR per share. See more details about Bata India Ltd earnings.
Bata India Ltd revenue for the last quarter amounts to 9.79 B INR, despite the estimated figure of 9.86 B INR. In the next quarter, revenue is expected to reach 8.49 B INR.
BATAINDIA net income for the last quarter is 639.84 M INR, while the quarter before that showed 22.08 M INR of net income which accounts for 0.00% change. Track more Bata India Ltd financial stats to get the full picture.
Yes, BATAINDIA dividends are paid semi-annually. The last dividend per share was 25.00 INR. As of today, Dividend Yield (TTM)% is 5.48%. Tracking Bata India Ltd dividends might help you take more informed decisions.
Bata India Ltd dividend yield was 1.48% in 2025, and payout ratio reached 86.19%. The year before the numbers were 1.56% and 73.85% correspondingly. See high-dividend stocks and find more opportunities for your portfolio.
As of Oct 7, 2026, the company has 9.18 K employees. See our rating of the largest employees — is Bata India Ltd on this list?
EBITDA measures a company's operating performance, its growth signifies an improvement in the efficiency of a company. Bata India Ltd EBITDA is 7.34 B INR, and current EBITDA margin is 21.54%. See more stats in Bata India Ltd financial statements.
Like other stocks, BATAINDIA shares are traded on stock exchanges, e.g. Nasdaq, Nyse, Euronext, and the easiest way to buy them is through an online stock broker. To do this, you need to open an account and follow a broker's procedures, then start trading. You can trade Bata India Ltd stock right from TradingView charts — choose your broker and connect to your account.
Investing in stocks requires a comprehensive research: you should carefully study all the available data, e.g. company's financials, related news, and its technical analysis. So Bata India Ltd technincal analysis shows the sell today, and its 1 week rating is sell. Since market conditions are prone to changes, it's worth looking a bit further into the future — according to the 1 month rating Bata India Ltd stock shows the strong sell signal. See more of Bata India Ltd technicals for a more comprehensive analysis.