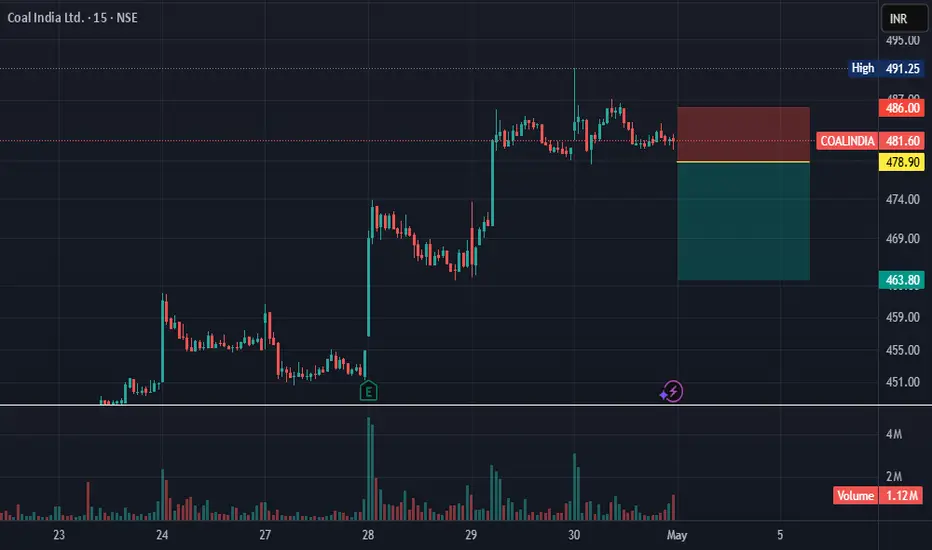
Coal India (COALINDIA) raised coal deliveries to power plants to help rebuild inventories. About 70 plants remain at critical stock levels, keeping short-term reliance on Coal India shipments.1
Coal India (COALINDIA) is moving ahead with subsidiary listings; one unit filed a draft prospectus and Mahanadi Coalfields plans to offer up to 661.8 million shares in its IPO.1
New order may boost captive power by ~5–6 GW, forcing higher plant runs and increased coal purchases—potentially raising procurement needs for Coal India Ltd. (COALINDIA).1
Coal India Ltd. is a holding company, which engages in the production and sale of coal. Its products and services include coking coal, semi coking coal, non-coking coal, washed and beneficiated coal, middlings, rejects, coal fines and coke fines, tar, heavy oil, light oil, and soft pitch. The company was founded in June 14, 1973 and is headquartered in Kolkata, India.
The current price of COALINDIA is 421.60 INR — it has decreased by −0.87% in the past 24 hours. Watch Coal India Ltd. stock price performance more closely on the chart.
Depending on the exchange, the stock ticker may vary. For instance, on BSE exchange Coal India Ltd. stocks are traded under the ticker COALINDIA.
COALINDIA stock has risen by 2.53% compared to the previous week, the month change is a 5.32% rise, over the last year Coal India Ltd. has showed a 7.50% increase.
We've gathered analysts' opinions on Coal India Ltd. future price: according to them, COALINDIA price has a max estimate of 522.00 INR and a min estimate of 370.00 INR. Watch COALINDIA chart and read a more detailed Coal India Ltd. stock forecast: see what analysts think of Coal India Ltd. and suggest that you do with its stocks.
COALINDIA reached its all-time high on Aug 26, 2024 with the price of 544.70 INR, and its all-time low was 109.50 INR and was reached on Oct 15, 2020. View more price dynamics on COALINDIA chart. See other stocks reaching their highest and lowest prices.
COALINDIA stock is 1.95% volatile and has beta coefficient of −0.35. Track Coal India Ltd. stock price on the chart and check out the list of the most volatile stocks — is Coal India Ltd. there?
Today Coal India Ltd. has the market capitalization of 2.62 T, it has decreased by −1.71% over the last week.
Coal India Ltd. is going to release the next earnings report on Nov 6, 2026. Keep track of upcoming events with our Earnings Calendar.
COALINDIA earnings for the last quarter are 14.40 INR per share, whereas the estimation was 13.35 INR resulting in a 7.84% surprise. The estimated earnings for the next quarter are 14.06 INR per share. See more details about Coal India Ltd. earnings.
Coal India Ltd. revenue for the last quarter amounts to 462.55 B INR, despite the estimated figure of 453.81 B INR. In the next quarter, revenue is expected to reach 358.07 B INR.
COALINDIA net income for the last quarter is 88.52 B INR, while the quarter before that showed 108.39 B INR of net income which accounts for 0.00% change. Track more Coal India Ltd. financial stats to get the full picture.
Yes, COALINDIA dividends are paid quarterly. The last dividend per share was 5.25 INR. As of today, Dividend Yield (TTM)% is 6.23%. Tracking Coal India Ltd. dividends might help you take more informed decisions.
Coal India Ltd. dividend yield was 5.89% in 2025, and payout ratio reached 52.52%. The year before the numbers were 6.65% and 46.00% correspondingly. See high-dividend stocks and find more opportunities for your portfolio.
As of Sep 28, 2026, the company has 214.33 K employees. See our rating of the largest employees — is Coal India Ltd. on this list?
EBITDA measures a company's operating performance, its growth signifies an improvement in the efficiency of a company. Coal India Ltd. EBITDA is 407.89 B INR, and current EBITDA margin is 25.42%. See more stats in Coal India Ltd. financial statements.
Like other stocks, COALINDIA shares are traded on stock exchanges, e.g. Nasdaq, Nyse, Euronext, and the easiest way to buy them is through an online stock broker. To do this, you need to open an account and follow a broker's procedures, then start trading. You can trade Coal India Ltd. stock right from TradingView charts — choose your broker and connect to your account.
Investing in stocks requires a comprehensive research: you should carefully study all the available data, e.g. company's financials, related news, and its technical analysis. So Coal India Ltd. technincal analysis shows the buy rating today, and its 1 week rating is sell. Since market conditions are prone to changes, it's worth looking a bit further into the future — according to the 1 month rating Coal India Ltd. stock shows the buy signal. See more of Coal India Ltd. technicals for a more comprehensive analysis.
 Long
Long