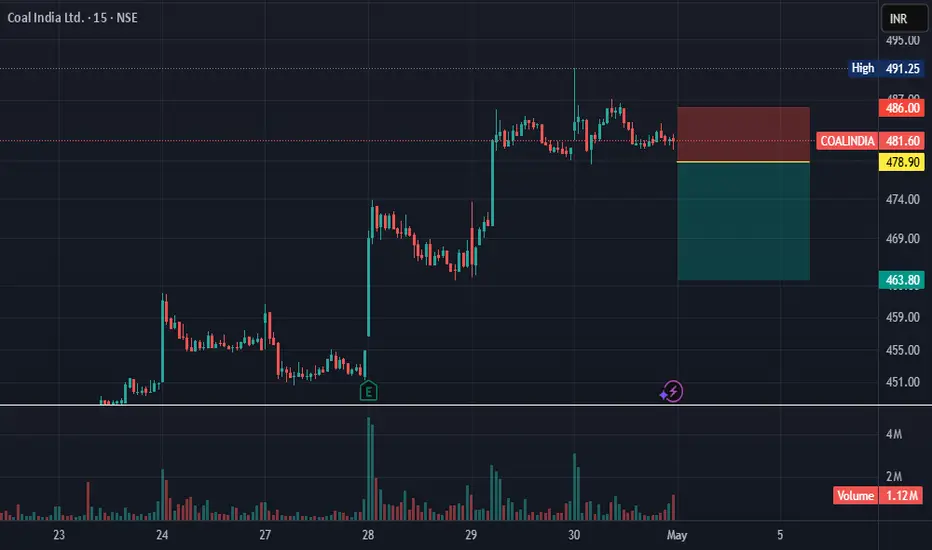
Coal India Ltd.
No trades
No trades
In-depth trading ideas
Coal IndiaTrend
Short-term: Neutral to Bearish (trading below 50-DMA)
Medium-term: Sideways
Long-term: Positive as long as ₹420 holds.
Key Support Levels
S1: ₹425–428
S2: ₹418–420 (Strong Demand Zone)
S3: ₹410–412
Key Resistance Levels
R1: ₹435–438
R2: ₹445–448
R3: ₹460–465 (Major Breakout Zone)
Trading Plan
Bullish Setup
Buy above ₹438 on strong volume.
Targets: ₹448 → ₹460 → ₹475
Stop Loss: ₹428
Bearish Setup
If price closes below ₹420
Targets: ₹412 → ₹405
Stop Loss: ₹428
Swing Trading View
Above ₹438: Bullish momentum likely.
₹420–438: Range-bound; wait for breakout.
Below ₹420: Weakness may continue.
Indicators
RSI is near the neutral zone after recovering from oversold levels.
Price remains below several medium-term moving averages, so confirmation above ₹438–445 would strengthen the trend.
Overall View
Bias: Neutral with bullish potential above ₹438.
Strong accumulation zone: ₹420–425
Major breakout level: ₹460–465
Positional target after breakout: ₹490+
CoalIndia, 1D, Long, Volumes, Support, Near ResistanceCoal India is showing good momentum at this level and near its support of 477. If it breaks this level and sustains it, then we can plan for the target of 490 and above on it.
The volumes traded on the stock is also very good.
Entry: 477 and above (if it sustains it)
Target1: 490
Target2: 510.
Review and plan for 27th May 2026 Nifty future and banknifty future analysis and intraday plan.
This video is for information/education purpose only. you are 100% responsible for any actions you take by reading/viewing this post.
please consult your financial advisor before taking any action.
----Vinaykumar hiremath, CMT
volatility contraction patternThe Volatility Contraction Pattern (VCP) is a technical analysis, trend-following, and breakout setup, popularized by trader Mark Minervini, designed to identify stocks with low-risk, high-reward potential. It occurs when a stock in an uptrend consolidates, producing 2–5 progressively smaller pullbacks (contractions) in price with decreasing volume, signaling that supply is being absorbed. The pattern ends in a breakout, ideally on high volume
Coal India Under Pressure – Downside Ahead?Coal India – Technical View
The stock is currently trading within a well-defined parallel channel and is now approaching the upper resistance zone.
After delivering a strong rally of around 19–20%, the stock has already seen a correction of approximately 10%, bringing it closer to the resistance range of 500 – 510.
Bearish View:
As long as the stock remains below this resistance zone, the bias continues to be bearish.
Downside Targets:
• 470
• 450
Invalidation:
A decisive breakout above the 500 – 510 resistance zone will invalidate the bearish view.
Trade with confirmation and follow proper risk management.
Review and plan for 28th April 2026Nifty future and banknifty future analysis and intraday plan.
Quarterly results.
This video is for information/education purpose only. you are 100% responsible for any actions you take by reading/viewing this post.
please consult your financial advisor before taking any action.
----Vinaykumar hiremath, CMT
NSE – NIFTY 750 | COAL INDIA | 08 Mar 2026Coal India Ltd demonstrates a structural pattern typical of commodity-linked equities.
Following its listing phase, the stock experienced a prolonged structural decline before entering a recovery cycle after 2020.
The current behaviour suggests renewed expansion within a broader long-term range structure.
Structure assessed from earliest reliable data.
Disclaimer:
This chart reflects structural market observations and is intended for educational purposes only.
#NIFTY750
#MarketStructure
#TechnicalAnalysis
#IndianStocks
#CoalIndia
#Commodities
#EnergySector
Coal India ..a watch for a consolidation breakout A clear cup n handle pattern appearing on Coal India chart on one hour chart after a long sideways consolidation ,a strict stp loss at the base in the rang 428 ,the price can go for a break out if the market sentiments moves for a rally the volumes spikes are less indicating a contraction
Disclaimer : just an observation not a recommendation
COAL INDIAStock breaking out from long Stage-1 base with strong weekly close above resistance. WITH 20 MA AND 200 MA RESISTANCE
Trend improving: Price above 30W & 50W MA, structure turning bullish.
Buy Entry: ₹420–435 zone (buy on dips or breakout hold).
Stop Loss: ₹398 (weekly close basis, below breakout & key MA).
Target 1: ₹480 | Target 2: ₹520 (prior supply zone).
Risk-reward favorable; trade invalid if price slips back below ₹398.
Amazing breakout on WEEKLY Timeframe - COALINDIACheckout an amazing breakout happened in the stock in Weekly timeframe, macroscopically seen in Daily timeframe. Having a great favor that the stock might be bullish expecting a staggering returns of minimum 25% TGT. IMPORTANT BREAKOUT LEVELS ARE ALWAYS RESPECTED!
NOTE for learners: Place the breakout levels as per the chart shared and track it yourself to get amazed!! WAIT FOR A COMPLETE WEEKLY CANDLE TO CLOSE ABOVE THE LEVEL
#No complicated chart patterns
#No big big indicators
#No Excel sheet or number magics
TRADE IDEA: WAIT FOR THE STOCK TO BREAKOUT IN WEEKLY TIMEFRAME ABOVE THIS LEVEL.
Checkout an amazing breakout happened in the stock in Weekly timeframe.
Breakouts happening in longer timeframe is way more powerful than the breakouts seen in Daily timeframe. You can blindly invest once the weekly candle closes above the breakout line and stay invested forever. Also these stocks breakouts are lifelong predictions, it means technically these breakouts happen giving more returns in the longer runs. Hence, even when the scrip makes a loss of 10% / 20% / 30% / 50%, the stock will regain and turn around. Once they again enter the same breakout level, they will flyyyyyyyyyyyy like a ROCKET if held in the portfolio in the longer run.
Time makes money, GREEDY & EGO will not make money.
Also, magically these breakouts tend to prove that the companies turn around and fundamentally becoming strong. Also the magic happens when more diversification is done in various sectors under various scripts with equal money invested in each N500 scripts.
The real deal is when to purchase and where to purchase the stock. That is where Breakout study comes into play.
LET'S PUMP IN SOME MONEY AND REVOLUTIONIZE THE NATION'S ECONOMY!
COALINDIA | Weekly Bullish Options Setup | 27 Jan ExpiryTrade Idea -
• Sell 405 PE
• Buy 400 PE
• Defined-risk bull put spread
Why this setup works
Coal India NSE:COALINDIA has broken out of a consolidation range with strong price acceptance above the 390–395 support zone. The stock is holding above the mid-band, momentum is improving, and RSI is trending higher.
Put-side open interest is building below current price, indicating strong downside support. With stable IV, bull put spreads offer a favourable risk-defined way to express a bullish view.
View
Moderately bullish — expecting COALINDIA to stay above support and grind higher or remain range-bound on the upside.
This post is for education only. It’s not financial advice or a recommendation to trade.
#COALINDIA
#WeeklyOptions
#BullishSetup
#BullPutSpread
#OptionsTradingIndia
#NSEOptions
#StockMarketIndia
#IndianTraders
#OptionsStrategy
Coal India: Breakout Alert or Bull Trap? Current Situation
Stock is recovering after falling from ₹540 (Sep 2024) to ₹360. Now attempting to break the downtrend.
Key Levels
Support: ₹360-370 (strong floor)
Resistance: ₹390-400 (immediate), ₹420 (major target)
📈 Outlook
Bullish If: Breaks above ₹390-400 → Target ₹420-440
Bearish If: Falls below ₹360 → Risk of ₹340-350
Quick Take
✅ Found support, bouncing back
✅ High volume zone (₹380-420)
⚠️ Must break ₹400 to confirm reversal
⚠️ Long downtrend still a concern
Action Points
Watch: ₹390-400 breakout
Stop Loss: Below ₹360
Target: ₹420 first, then ₹440
⚠️ DISCLAIMER
NOT financial advice. Educational only. Do your own research. Consult SEBI registered advisor. Markets are risky - invest wisely.
COALINDIA - Falling Wedge PATTERN BREAKOUT [ BUY SIDE ]1. RSI, Supports & Resistances:
RSI (2025-11-14): 52.43
(This means the stock is in a balanced zone—neither overbought nor oversold, indicating moderate strength)
Current Price: ₹386.95
Support Levels:
Support 3: ₹386.30
Support 2: ₹386.00
Support 1: ₹385.60
(These levels may provide buying interest and potential price recovery if the stock declines)
Resistance Levels:
Resistance 1: ₹387.05
Resistance 2: ₹387.60
Resistance 3: ₹387.90
(Areas where the price could face selling pressure and potentially pull back)
Volume Ratio (last 20 days): 53.55%
(Shows increased trading activity compared to the past, but not excessively high)
2. Fibonacci Retracement Levels:
Used for identifying potential reversal zones during corrections or rallies.
23.6% retracement: ₹219.77
38.2% retracement: ₹281.64
50.0% retracement: ₹331.65
61.8% retracement: ₹381.66
78.6% retracement: ₹452.86
3. Moving Averages:
Help identify trend direction and strength across various periods.
EMA (Exponential Moving Average):
EMA5: ₹384.12 (very recent trend)
EMA9: ₹383.51
EMA20: ₹384.39
EMA50: ₹385.78
EMA100: ₹387.16
EMA200: ₹392.73 (long-term trend)
SMA (Simple Moving Average):
SMA5: ₹384.16
SMA9: ₹380.56
SMA20: ₹385.86
SMA50: ₹387.96
SMA100: ₹385.75
SMA200: ₹386.30
How to Use These Levels:
If price dips, monitor the support and Fibonacci levels for potential bounces.
On a price rise, watch the resistance levels for possible reversals.
If price is above most moving averages, the trend is generally considered strong; below most averages may indicate weakness.
RSI above 70 = overbought, below 30 = oversold.
In short:
Current price is right around the short-term moving averages, suggesting consolidation. RSI is neither overbought nor oversold—reflecting neutral to moderate strength. Watch resistance around ₹387–₹388 and supports near ₹385–₹386. Volume is moderately elevated, showing some trading interest, but not excessive activity.
I am not a SEBI-registered investment advisor. The information provided here is for educational and informational purposes only and should not be construed as financial or investment advice. Please do your own research or consult with a SEBI-registered financial advisor before making any investment decisions. Investments in the securities market are subject to market risks. Read all the related documents carefully before investing.
im targeting for the price 437Based on current technical and fundamental data as of **October 17, 2025**, Coal India Ltd (COALINDIA) looks favorable for your **₹437** target, but it should be approached with a medium-term horizon (3–6 months).
### Current Snapshot
- **CMP:** ₹387.85
- **P/E Ratio:** 7.23 (vs. industry 10–11)
- **Dividend Yield:** ~8.4%
- **Market Cap:** ₹2.38 lakh crore
- **Q2 FY25 results & dividend declaration scheduled for:** October 29, 2025
- **Technical Support:** ₹379–₹381
- **Technical Resistance Zones:** ₹392 → ₹408 → ₹437
### Technical Momentum
Coal India has:
- **Crossed above its 100-day EMA and SMA** recently, signaling a base formation around ₹385–₹388.
- **Short-term weakness:** It slipped below its 20-day EMA, showing mild consolidation after strong quarterly buying.
- **Medium-term bullish setup:** Once the price sustains above ₹392 on volume, momentum likely builds up to ₹408 first, and ₹437 later.
### Fundamental Context
- The stock trades at a **discount of about 6–7% to its intrinsic value** (₹551 range based on multiple valuation models).
- Production dipped marginally in September 2025 (-3.9%), but long-term demand from the power sector remains intact.
- Dividend yield is among the **highest in NSE PSU space**, providing strong downside protection.
### Price Target Feasibility
Your target of **₹437** is reasonable under the following conditions:
- **Short term (1–2 months):** Consolidation between ₹380–₹395.
- **Post Q2 results (Nov–Dec 2025):** If profits remain stable and dividend is declared, rerating can lift momentum toward ₹420–₹437.
- **Long-term trend (6 months+):** The stock could test ₹437–₹455 range assuming stable coal volumes and no negative government interventions.
### Recommendation
- **Entry Zone:** ₹380–₹388 (add more on dips below ₹383).
- **Target:** ₹437 (medium term, achievable by Q1 2026).
- **Stop Loss:** ₹370 (to preserve capital if PSU sentiment turns weak).
- **Suitability:** Best for long-term/dividend investors rather than short-term traders.
### Summary
Coal India currently offers a **strong value with modest technical momentum**, making your ₹437 target realistically achievable within the next two quarters. Sustained volume above ₹392 and solid Q2 results can act as catalysts for a breakout toward that level.
(www.moneycontrol.com)
(economictimes.com)
(www.tickertape.in)
(www.smart-investing.in)
(www.marketsmojo.com)
(in.investing.com)
(www.screener.in)
(kaushalgreenenergy.in)
(www.equitypandit.com)
(www.nseindia.com)
(finance.yahoo.com)
(dhan.co)
(www.niftyinvest.com)
Coal India Swing Trade Setup📊 Price Action & Trend Analysis
Analyzing market trends using price action, key support/resistance levels, and candlestick patterns to identify high-probability trade setups.
Always follow the trend and manage risk wisely!
Price Action Analysis Interprets Market Movements Using Patterns And Trends On Price Charts.
👉👉👉Follow us for Live Market Views/Trades/Analysis/News Updates.