SL @ 10500 TP @ 19125Strategy Execution : Trade calls are provided based on trendline setups.
Quantity : Determined by F&O lot sizes.
Stop-Loss : Strictly follow the specified stop-loss levels. A stop-loss is considered triggered only after a 15-minute candle closes beyond the level.
Position Sizing : Limit exposure to
Glenmark Pharmaceuticals Limited
No trades
No trades
Peers for comparison
51.45 INR
13.62 B INR
169.83 B INR
144.05 M
Last report date
Report period
EPS
Revenue
Earnings release details
Q2 FY26 revenue grew 76% year-over-year, driven by strong North America and Europe performance, while India sales were temporarily impacted by GST-related inventory adjustments. The company is now net cash positive, has repaid all debt, and expects double-digit growth, higher margins, and robust free cash flow in the coming years.
Company info
Sector
Industry
CEO
Glenn Mario Saldanha
Website
Headquarters
Mumbai
Founded
1977
IPO date
Dec 10, 1999
ISIN
INE935A01035
FIGI
BBG000BJ3V03
Identifiers
ISIN INE935A01035
Glenmark Pharmaceuticals Ltd. is a holding company, which engages in the development, manufacture, and marketing of pharmaceutical products. It operates through the following geographical segments: India, North America, Europe, Latin America, and Rest of the World. The company was founded by Gracias Saldanha on November 18, 1977 and is headquartered in Mumbai, India.
YOUR RISK 13125 • Strategy Execution: We provide trade calls based on trendline setups.
• Lot Size: The calls given are based on standard F&O lot sizes.
• Stop-Loss Execution: Strictly follow the stop-loss levels.
• 15-Minute Candle Close: Consider the stop-loss triggered only after a 15-minute candle closes be
BUY STOPLOSS 2448**5 Key Rules for Trendline Breakout Trading:**
* **Valid Trendline:** Draw a line connecting at least 2–3 major swing highs or lows.
* **Candle Close:** Enter only after the candlestick closes clearly beyond the trendline.
* **Volume Confirmation:** Ensure high volume on the breakout candle to con
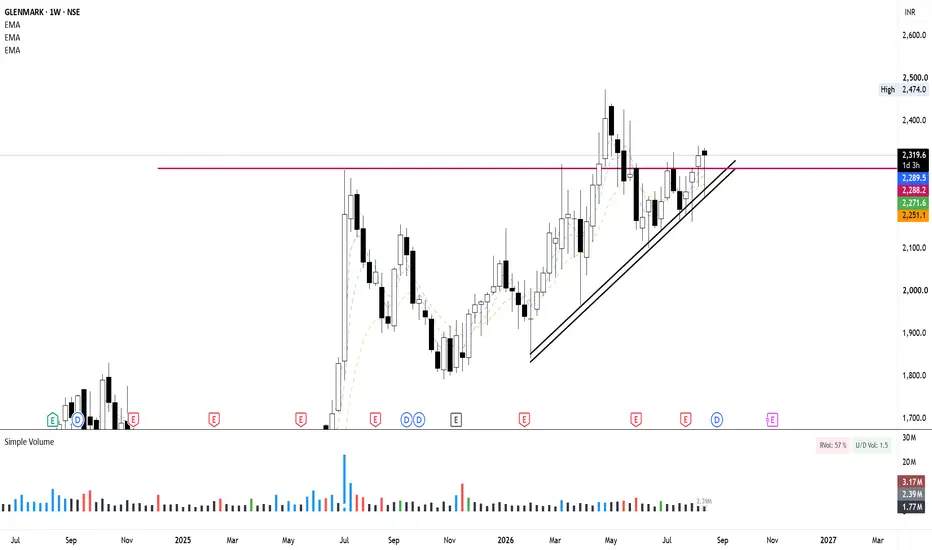
glenmarkA big move is quite possible in this stock
Technically it is following Fibbonaci levels
each Move is being respected at golden ratio.
now check weekly chart it has finally broke 1 year old resistance retested it back.
This big rejection is sign of big move
2280 is going to be a meaningful st
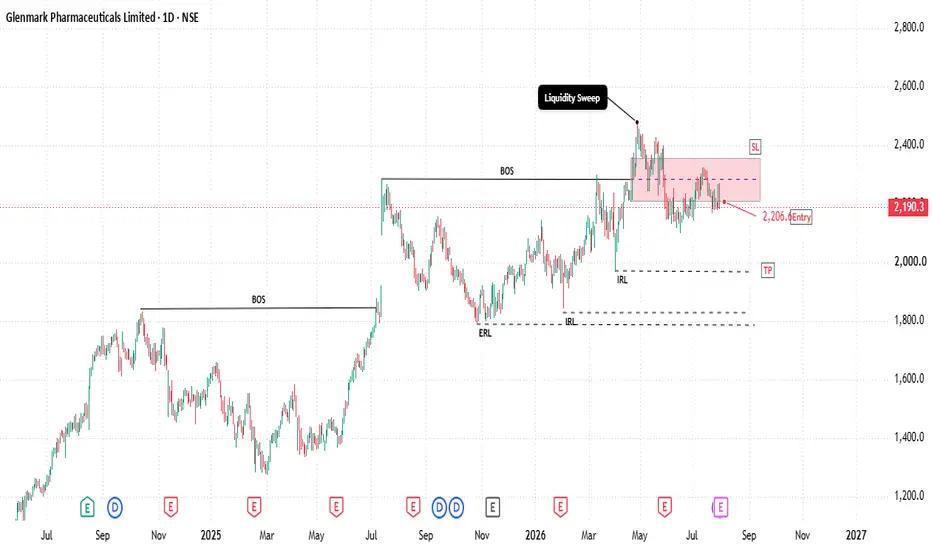
GLENMARK is in for deeper correction? Best chart to learn Waves
CMP : 2233
TF: Daily
The chart seem to have completed the Primary impulse cycle from 2020 (161 to 2474) - Counts marked in Blue
The chart set up has almost everything from the Elliott Wave Perspective and one of the clean and easy to understand structures to learn basic wave theory.
The subwave
GLENMARK (D) CHARTTechnical Note: Let the market come to your zones and show its hand. Trade safely and manage your risk! Always wait for your own confirmations before entering the market.
Risk Disclaimer: This analysis is for educational purposes only and does not constitute financial advice. Always practice proper
Plan for 1st June 2026 Nifty future and banknifty future analysis and intraday plan.
This video is for information/education purpose only. you are 100% responsible for any actions you take by reading/viewing this post.
please consult your financial advisor before taking any action.
----Vinaykumar hiremath, CMT
INVESTMENT OPPORTUNITY IN -- GLENMARK PHARMACEUTICALS LTD --Glenmark Pharmaceuticals Ltd – All Time High Breakout Setup
Glenmark Pharmaceuticals Limited is showing strong bullish momentum after a clean all-time high breakout supported by a rising trendline structure.
Key Highlights:
Strong breakout above previous ATH resistance
Healthy uptrend with co
See all ideas
Summarizing what the indicators are suggesting.
Neutral
Neutral
Neutral
An aggregate view of professional's ratings.
Neutral
Neutral
Neutral
Displays a symbol's price movements over previous years to identify recurring trends.
Frequently asked questions
Today, GLENMARK trades at 2,675.00 INR.
For broader market analysis, dive into the technicals on the Glenmark Pharmaceuticals Limited stock price chart and read the latest GLENMARK news:
– Buy Glenmark Pharma; target of Rs 3000: Motilal Oswal
– GLENMARK: Branded growth and specialty launches underpin H2 leverage and the FY27 cash outlook
– Glenmark Pharmaceuticals Q2 2027 Earnings Call Is Live
For broader market analysis, dive into the technicals on the Glenmark Pharmaceuticals Limited stock price chart and read the latest GLENMARK news:
– Buy Glenmark Pharma; target of Rs 3000: Motilal Oswal
– GLENMARK: Branded growth and specialty launches underpin H2 leverage and the FY27 cash outlook
– Glenmark Pharmaceuticals Q2 2027 Earnings Call Is Live
Markets don't sleep, here's what's going on with GLENMARK at the moment:
– Buy Glenmark Pharma; target of Rs 3000: Motilal Oswal
– GLENMARK: Branded growth and specialty launches underpin H2 leverage and the FY27 cash outlook
– Glenmark Pharmaceuticals Q2 2027 Earnings Call Is Live
See more updates in real-time with our News Flow.
– Buy Glenmark Pharma; target of Rs 3000: Motilal Oswal
– GLENMARK: Branded growth and specialty launches underpin H2 leverage and the FY27 cash outlook
– Glenmark Pharmaceuticals Q2 2027 Earnings Call Is Live
See more updates in real-time with our News Flow.
Glenmark Pharmaceuticals Limited is scheduled to release its next earnings report on Feb 5, 2027.
Why it matters:
– Key event: Earnings often drive significant price moves
– Market expectations: Traders watch revenue, EPS, and guidance vs forecasts
– Volatility spike: Price swings can increase before and after the release
How to use it:
– Track upcoming reports in the Earnings Calendar
– Compare actual results with analyst estimates
– Monitor price reaction and volume on Supercharts
Why it matters:
– Key event: Earnings often drive significant price moves
– Market expectations: Traders watch revenue, EPS, and guidance vs forecasts
– Volatility spike: Price swings can increase before and after the release
How to use it:
– Track upcoming reports in the Earnings Calendar
– Compare actual results with analyst estimates
– Monitor price reaction and volume on Supercharts
GLENMARK stock is 2.05% volatile and has beta coefficient of 0.69.
What it means:
– Volatility: Shows how much the price fluctuates over time
– Beta > 1: More volatile than the market
– Beta < 1: Less volatile, more stable
Important to know:
– Volatility can increase during earnings, news events, or market stress
– Large-cap stocks like GLENMARK are typically less volatile than smaller companies
Track every detail on Glenmark Pharmaceuticals Limited stock chart and check out the list of the most volatile stocks — is Glenmark Pharmaceuticals Limited there?
What it means:
– Volatility: Shows how much the price fluctuates over time
– Beta > 1: More volatile than the market
– Beta < 1: Less volatile, more stable
Important to know:
– Volatility can increase during earnings, news events, or market stress
– Large-cap stocks like GLENMARK are typically less volatile than smaller companies
Track every detail on Glenmark Pharmaceuticals Limited stock chart and check out the list of the most volatile stocks — is Glenmark Pharmaceuticals Limited there?
To understand the GLENMARK stock performance, it's worth checking price changes for various periods to get the full picture:
– 1 day — +3.27%
– 1 week — +16.28%
– 1 month — +21.68%
GLENMARK all-time low was 19.65 INR (Nov 5, 2003), and its highest price is 2,713.75 INR (Nov 9, 2026). Find more dynamics in the Stock Heatmap and on the Glenmark Pharmaceuticals Limited stock chart.
– 1 day — +3.27%
– 1 week — +16.28%
– 1 month — +21.68%
GLENMARK all-time low was 19.65 INR (Nov 5, 2003), and its highest price is 2,713.75 INR (Nov 9, 2026). Find more dynamics in the Stock Heatmap and on the Glenmark Pharmaceuticals Limited stock chart.
Glenmark Pharmaceuticals Limited market capitalization is 756.33 B, representing the total value of all its outstanding shares (price × shares outstanding).
What it means:
– Market cap is one of the key ways to classify companies (large-cap, mid-cap, etc.)
– It reflects how investors value the company today
– It changes constantly with stock price movements
What to look at next:
– Market cap trends: Rising cap may signal growth and investor confidence; falling cap can reflect risk or downturns
– Price vs shares: Changes can come from Glenmark Pharmaceuticals Limited stock price moves or share count (buybacks, issuance)
– Valuation ratios: Compare market cap with revenue and earnings
– Peer comparison: See how Glenmark Pharmaceuticals Limited stacks up against other companies
What it means:
– Market cap is one of the key ways to classify companies (large-cap, mid-cap, etc.)
– It reflects how investors value the company today
– It changes constantly with stock price movements
What to look at next:
– Market cap trends: Rising cap may signal growth and investor confidence; falling cap can reflect risk or downturns
– Price vs shares: Changes can come from Glenmark Pharmaceuticals Limited stock price moves or share count (buybacks, issuance)
– Valuation ratios: Compare market cap with revenue and earnings
– Peer comparison: See how Glenmark Pharmaceuticals Limited stacks up against other companies
The safest way to buy Glenmark Pharmaceuticals Limited stocks is through a reliable broker. Create an account, fund it, and place a buy order.
You can trade GLENMARK directly from TradingView:
– Choose a broker: Explore our supported trading partners and pick one that fits your needs
– Compare options: View available brokers side by side to evaluate fees and features
– Connect your account: Open Supercharts, click “Trade”, select your broker, and log in
– Start trading: Place orders without leaving the chart
Tip: If you’re new to trading, try paper trading first — it lets you practice strategies in real market conditions without risking funds.
You can trade GLENMARK directly from TradingView:
– Choose a broker: Explore our supported trading partners and pick one that fits your needs
– Compare options: View available brokers side by side to evaluate fees and features
– Connect your account: Open Supercharts, click “Trade”, select your broker, and log in
– Start trading: Place orders without leaving the chart
Tip: If you’re new to trading, try paper trading first — it lets you practice strategies in real market conditions without risking funds.
As of Nov 11, 2026, the company has 17.78 K employees.
Why traders follow this data:
– Company scale: Employee count reflects the size and global reach of the business
– Operational footprint: Higher headcount often indicates broader product lines, retail presence, or services
– Trend signal: Changes over time can reflect hiring growth, restructuring, or efficiency improvements
See our rating of the largest employers to find more opportunities.
Why traders follow this data:
– Company scale: Employee count reflects the size and global reach of the business
– Operational footprint: Higher headcount often indicates broader product lines, retail presence, or services
– Trend signal: Changes over time can reflect hiring growth, restructuring, or efficiency improvements
See our rating of the largest employers to find more opportunities.
Glenmark Pharmaceuticals Limited pays dividends, but whether it is a “good” dividend stock depends on its yield and stability rather than dividends alone.
Its recent dividend yield was around 0.23%, with a payout ratio of 10.36%, compared to 0.16% and 6.74% in the previous period.
What to look at when looking for good dividend stocks:
– Dividend yield: Income potential relative to price
– Payout ratio: Sustainability of dividend payments
– Dividend history: Consistency and growth over time
– Earnings strength: Dividends are more reliable when supported by stable profits
– Total return: Combines dividends with stock price performance
Explore all this in Glenmark Pharmaceuticals Limited financials.
Its recent dividend yield was around 0.23%, with a payout ratio of 10.36%, compared to 0.16% and 6.74% in the previous period.
What to look at when looking for good dividend stocks:
– Dividend yield: Income potential relative to price
– Payout ratio: Sustainability of dividend payments
– Dividend history: Consistency and growth over time
– Earnings strength: Dividends are more reliable when supported by stable profits
– Total return: Combines dividends with stock price performance
Explore all this in Glenmark Pharmaceuticals Limited financials.
Investing in Glenmark Pharmaceuticals Limited depends on your goals, risk tolerance, and market conditions. It’s essential to analyze the stock before making a decision.
First, study Glenmark Pharmaceuticals Limited financials and track their dynamics on the Fundamental Graphs:
– Business fundamentals: Revenue, earnings, and growth trends
– Valuation: P/E ratio, market cap, and how it compares to peers
– Profitability: Margins, return on equity, and cash flow
– Dividends (if any): Yield, payout ratio, and consistency
Then explore our GLENMARK technicals – signals based on essential indicators calculations:
– Today — buy
– 1-week — strong buy
– 1-month — strong buy
Combine fundamental and technical analysis for better results.
First, study Glenmark Pharmaceuticals Limited financials and track their dynamics on the Fundamental Graphs:
– Business fundamentals: Revenue, earnings, and growth trends
– Valuation: P/E ratio, market cap, and how it compares to peers
– Profitability: Margins, return on equity, and cash flow
– Dividends (if any): Yield, payout ratio, and consistency
Then explore our GLENMARK technicals – signals based on essential indicators calculations:
– Today — buy
– 1-week — strong buy
– 1-month — strong buy
Combine fundamental and technical analysis for better results.
Glenmark Pharmaceuticals Limited stock ticker depends on the exchange where it’s listed. On the NSE, its primary exchange, Glenmark Pharmaceuticals Limited stocks trade under the symbol GLENMARK.
About tickers:
– Unique identifiers: A ticker is a short code used to find and trade a stock
– Exchange-specific: The same company may have different tickers across exchanges
– Search shortcut: Used on trading platforms, charts, and screeners
Remember:
– Some companies have multiple listings
– Always check the exchange prefix to avoid confusion
Learn how to find your desired assets in our Symbol Search.
About tickers:
– Unique identifiers: A ticker is a short code used to find and trade a stock
– Exchange-specific: The same company may have different tickers across exchanges
– Search shortcut: Used on trading platforms, charts, and screeners
Remember:
– Some companies have multiple listings
– Always check the exchange prefix to avoid confusion
Learn how to find your desired assets in our Symbol Search.
Glenmark Pharmaceuticals Limited revenue for the last quarter amounts to 42.47 B INR despite the estimated figure of 41.10 B INR. In the next quarter revenue is expected to reach 42.63 B INR.
How to read this data:
– Compare actual vs estimates: Revenue beats or misses can move the stock
– Watch market reaction: Price response shows how investors interpret results
– Look at growth: Compare with previous quarters and year-over-year data
– Track trends: One quarter matters less than consistent performance
Follow other essential metrics in Glenmark Pharmaceuticals Limited financials:
– Earnings (EPS): Profitability per share
– Margins (gross, operating): Efficiency and cost control
– Free cash flow: Cash available after expenses
How to read this data:
– Compare actual vs estimates: Revenue beats or misses can move the stock
– Watch market reaction: Price response shows how investors interpret results
– Look at growth: Compare with previous quarters and year-over-year data
– Track trends: One quarter matters less than consistent performance
Follow other essential metrics in Glenmark Pharmaceuticals Limited financials:
– Earnings (EPS): Profitability per share
– Margins (gross, operating): Efficiency and cost control
– Free cash flow: Cash available after expenses
Yes, you can track Glenmark Pharmaceuticals Limited financials in yearly and quarterly reports right on TradingView.
Use our Earnings Calendar to never miss important releases and spot opportunities early.
GLENMARK net income for the last quarter is 2.64 B INR, while the quarter before that showed 4.83 B INR of net income which accounts for −45.38% change.
How to read this data:
– Track changes: Compare net income across quarters to spot trends
– Watch expectations: Compare with estimates to gauge performance
– Check margins: Net income reflects profitability after all expenses
– Look beyond one quarter: Consistency matters more than a single result
Follow other essential metrics in Glenmark Pharmaceuticals Limited financials:
– Revenue: Overall business growth
– Earnings per share: Rising EPS over time often points to improving business performance
– Margins (gross, operating): Efficiency and cost control
How to read this data:
– Track changes: Compare net income across quarters to spot trends
– Watch expectations: Compare with estimates to gauge performance
– Check margins: Net income reflects profitability after all expenses
– Look beyond one quarter: Consistency matters more than a single result
Follow other essential metrics in Glenmark Pharmaceuticals Limited financials:
– Revenue: Overall business growth
– Earnings per share: Rising EPS over time often points to improving business performance
– Margins (gross, operating): Efficiency and cost control
Glenmark Pharmaceuticals Limited does pay dividends, which are distributed semi-annually. The most recent dividend per share was 2.50 INR, with a trailing twelve-month (TTM) dividend yield of 0.19%.
Explore more details on Glenmark Pharmaceuticals Limited dividends, look at:
– Dividend history: Check whether payouts are growing, stable, or declining
– Payout ratio: How much of earnings are paid out as dividends
– Total return: Combine price growth + dividends for full performance view
Explore more details on Glenmark Pharmaceuticals Limited dividends, look at:
– Dividend history: Check whether payouts are growing, stable, or declining
– Payout ratio: How much of earnings are paid out as dividends
– Total return: Combine price growth + dividends for full performance view
GLENMARK reached its all-time high of 2,713.75 INR on Nov 9, 2026. Its all-time low was 19.65 INR and was reached on Nov 5, 2003.
Explore the Glenmark Pharmaceuticals Limited stock price chart to see more price history, and discover companies reaching new all-time highs and lows.
Glenmark Pharmaceuticals Limited EBITDA is 33.01 B INR, with an EBITDA margin of 23.67%.
EBITDA is a measure of core operating performance, showing how much profit the company generates from its main business activities before accounting for financing and accounting-related costs.
What it means:
– Operating strength: Helps assess profitability from core operations
– Efficiency signal: Rising EBITDA often reflects improving business performance
– Comparability: Useful for comparing companies with different capital structures
What to look at next in Glenmark Pharmaceuticals Limited statements:
– Revenue growth: Shows whether the business is expanding
– Net income: Captures full profitability after all expenses
– Free cash flow: Shows actual cash generated
– Debt levels: Important when evaluating earnings quality
EBITDA is a measure of core operating performance, showing how much profit the company generates from its main business activities before accounting for financing and accounting-related costs.
What it means:
– Operating strength: Helps assess profitability from core operations
– Efficiency signal: Rising EBITDA often reflects improving business performance
– Comparability: Useful for comparing companies with different capital structures
What to look at next in Glenmark Pharmaceuticals Limited statements:
– Revenue growth: Shows whether the business is expanding
– Net income: Captures full profitability after all expenses
– Free cash flow: Shows actual cash generated
– Debt levels: Important when evaluating earnings quality
Analyst forecasts suggest a price range between 2,100.00 INR and 3,025.00 INR for GLENMARK, based on current estimates.
Remember:
– Forecasts show possible scenarios, not guaranteed outcomes
– They're based on multiple analysts’ models and assumptions
– Target prices change with earnings, news, and market conditions
Don't rely on analysts' opinions alone:
– Use technical analysis: Trend, support/resistance, momentum
– Study fundamentals: Revenue, earnings, margins
– Account for market context: News, macro trends, sector performance
Remember:
– Forecasts show possible scenarios, not guaranteed outcomes
– They're based on multiple analysts’ models and assumptions
– Target prices change with earnings, news, and market conditions
Don't rely on analysts' opinions alone:
– Use technical analysis: Trend, support/resistance, momentum
– Study fundamentals: Revenue, earnings, margins
– Account for market context: News, macro trends, sector performance