Compare with Hindalco Industries Limited
60.30 INR
133.91 B INR
2.74 T INR
1.46 B
Next report date
—
Report period
—
EPS estimate
—
Revenue estimate
—
Details
Sector
Industry
CEO
Satish P. Pai
Website
Headquarters
Mumbai
Founded
1958
IPO date
Nov 3, 1994
ISIN
INE038A01020
FIGI
BBG000CSJRC1
Identifiers
ISIN INE038A01020
Hindalco Industries Ltd. engages in the production and marketing of aluminium and copper products. It operates through the Aluminium, Copper, Novelis, and All Other segments. The Aluminium segment manufactures and sells hydrate and alumina, and aluminium products. The Copper segment is in the business of manufacturing and selling of copper cathode, continuous cast copper rods, sulphuric acid, DAP & Complexes, gold, silver, and other precious metals. The Novelis segment engaged in producing and selling aluminium sheet and light gauge products. The company was founded by Ghanshyam Das Birla on December 15, 1958 and is headquartered in Mumbai, India.
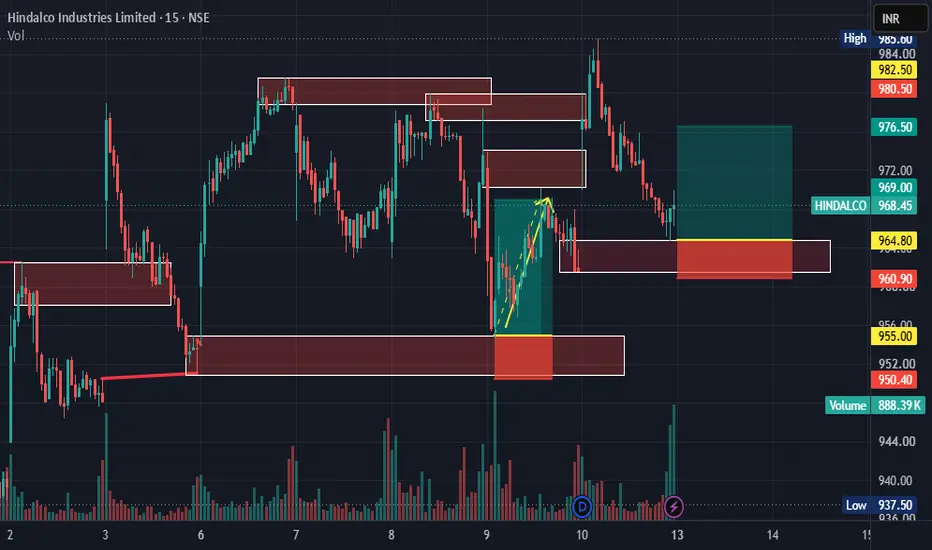
TEDS Swing Trading Analysis | Hindalco | 10 July 26TEDS Swing Trading Analysis | Discipline Begins with Patience
Not every market move deserves an immediate trade.
One of the key principles of the TEDS (Trend Exhaustion Detection System) is to wait for confirmation, not prediction.
Chart Observation
🔹 The framework first identified a TEDS Short
HINDALCO Stock Analysis
Fundamental Analysis
Hindalco continues to benefit from strong momentum in its Indian aluminium and copper businesses. In FY26, the company reported record revenue of ₹2.75 lakh crore and an all-time high EBITDA of ₹38,097 crore, driven by robust aluminium and copper operations. Management remai
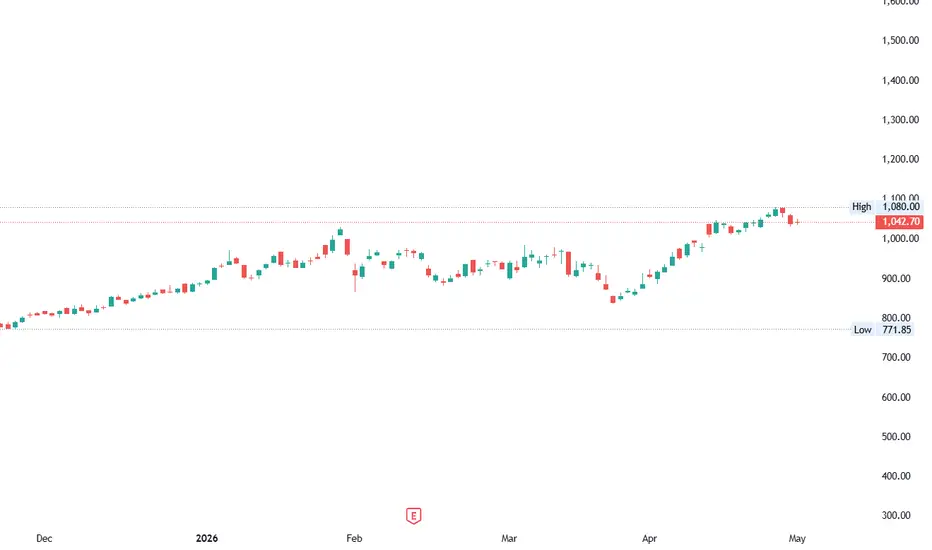
Hindalco technical view🔹 Market Structure
Clear bullish trend with strong upside momentum from ~₹900 levels
Price structure forming higher highs & higher lows
Currently approaching a major supply zone
🔹 Key Levels
🟣 Major Resistance: ₹1,075 – ₹1,090
Strong historical resistance (multiple rejections visible)
Price current
Hindalco intraday trend analysis for tomorrow-May 08Hindalco is forming consecutive higher lows while continuing to exhibit bearish momentum.
There is a possibility of the stock testing the resistance zone around 1060–1065, while immediate
support levels are placed at 1037 and 1032.
Since opening gaps are not considered in this analysis, the mentio
NSE – NIFTY 750 | HINDALCO INDUSTRIES | 11 Mar 2026Long-Term Structure
Hindalco shows a long period of cyclical commodity behaviour before a structural transition following the 2020 decline. Price rebounded strongly from long-term support and broke out of the multi-year range.
Current Behaviour
Since then the stock has developed a sustained advance
See all ideas
Summarizing what the indicators are suggesting.
Neutral
SellBuy
Strong sellStrong buy
Strong sellSellNeutralBuyStrong buy
Neutral
SellBuy
Strong sellStrong buy
Strong sellSellNeutralBuyStrong buy
Neutral
SellBuy
Strong sellStrong buy
Strong sellSellNeutralBuyStrong buy
An aggregate view of professional's ratings.
Neutral
SellBuy
Strong sellStrong buy
Strong sellSellNeutralBuyStrong buy
Neutral
SellBuy
Strong sellStrong buy
Strong sellSellNeutralBuyStrong buy
Neutral
SellBuy
Strong sellStrong buy
Strong sellSellNeutralBuyStrong buy
Displays a symbol's price movements over previous years to identify recurring trends.
6.418% YTM
Maturity dateAug 15, 2033
Coupon6.38% (Fixed)
5.939% YTM
Maturity dateJan 30, 2030
Coupon4.75% (Fixed)
5.819% YTM
Maturity dateAug 15, 2031
Coupon3.88% (Fixed)
6.082% YTM
Maturity dateJan 30, 2030
Coupon6.88% (Fixed)
4.400% YTM
Maturity dateApr 15, 2029
Coupon3.38% (Fixed)
See all HINDALCO bonds
Frequently asked questions
The current price of HINDALCO is 943.90 INR — it has decreased by −1.31% in the past 24 hours. Watch Hindalco Industries Limited stock price performance more closely on the chart.
Depending on the exchange, the stock ticker may vary. For instance, on BSE exchange Hindalco Industries Limited stocks are traded under the ticker HINDALCO.
HINDALCO stock has fallen by −1.57% compared to the previous week, the month change is a −2.89% fall, over the last year Hindalco Industries Limited has showed a 35.57% increase.
We've gathered analysts' opinions on Hindalco Industries Limited future price: according to them, HINDALCO price has a max estimate of 1,430.00 INR and a min estimate of 850.00 INR. Watch HINDALCO chart and read a more detailed Hindalco Industries Limited stock forecast: see what analysts think of Hindalco Industries Limited and suggest that you do with its stocks.
HINDALCO reached its all-time high on May 29, 2026 with the price of 1,179.35 INR, and its all-time low was 36.90 INR and was reached on Mar 3, 2009. View more price dynamics on HINDALCO chart.
See other stocks reaching their highest and lowest prices.
HINDALCO stock is 1.79% volatile and has beta coefficient of 0.56. Track Hindalco Industries Limited stock price on the chart and check out the list of the most volatile stocks — is Hindalco Industries Limited there?
Today Hindalco Industries Limited has the market capitalization of 2.12 T, it has decreased by −2.74% over the last week.
Yes, you can track Hindalco Industries Limited financials in yearly and quarterly reports right on TradingView.
Hindalco Industries Limited is going to release the next earnings report on Aug 7, 2026. Keep track of upcoming events with our Earnings Calendar.
HINDALCO earnings for the last quarter are 11.69 INR per share, whereas the estimation was 18.65 INR resulting in a −37.32% surprise. The estimated earnings for the next quarter are 23.31 INR per share. See more details about Hindalco Industries Limited earnings.
Hindalco Industries Limited revenue for the last quarter amounts to 781.33 B INR, despite the estimated figure of 716.51 B INR. In the next quarter, revenue is expected to reach 883.06 B INR.
HINDALCO net income for the last quarter is 25.97 B INR, while the quarter before that showed 20.49 B INR of net income which accounts for 0.00% change. Track more Hindalco Industries Limited financial stats to get the full picture.
Yes, HINDALCO dividends are paid annually. The last dividend per share was 5.00 INR. As of today, Dividend Yield (TTM)% is 0.53%. Tracking Hindalco Industries Limited dividends might help you take more informed decisions.
Hindalco Industries Limited dividend yield was 0.57% in 2025, and payout ratio reached 8.29%. The year before the numbers were 0.73% and 6.94% correspondingly. See high-dividend stocks and find more opportunities for your portfolio.
As of Jul 26, 2026, the company has 64.4 K employees. See our rating of the largest employees — is Hindalco Industries Limited on this list?
EBITDA measures a company's operating performance, its growth signifies an improvement in the efficiency of a company. Hindalco Industries Limited EBITDA is 352.61 B INR, and current EBITDA margin is 12.68%. See more stats in Hindalco Industries Limited financial statements.
Like other stocks, HINDALCO shares are traded on stock exchanges, e.g. Nasdaq, Nyse, Euronext, and the easiest way to buy them is through an online stock broker. To do this, you need to open an account and follow a broker's procedures, then start trading. You can trade Hindalco Industries Limited stock right from TradingView charts — choose your broker and connect to your account.
Investing in stocks requires a comprehensive research: you should carefully study all the available data, e.g. company's financials, related news, and its technical analysis. So Hindalco Industries Limited technincal analysis shows the sell today, and its 1 week rating is neutral. Since market conditions are prone to changes, it's worth looking a bit further into the future — according to the 1 month rating Hindalco Industries Limited stock shows the buy signal. See more of Hindalco Industries Limited technicals for a more comprehensive analysis.
If you're still not sure, try looking for inspiration in our curated watchlists.