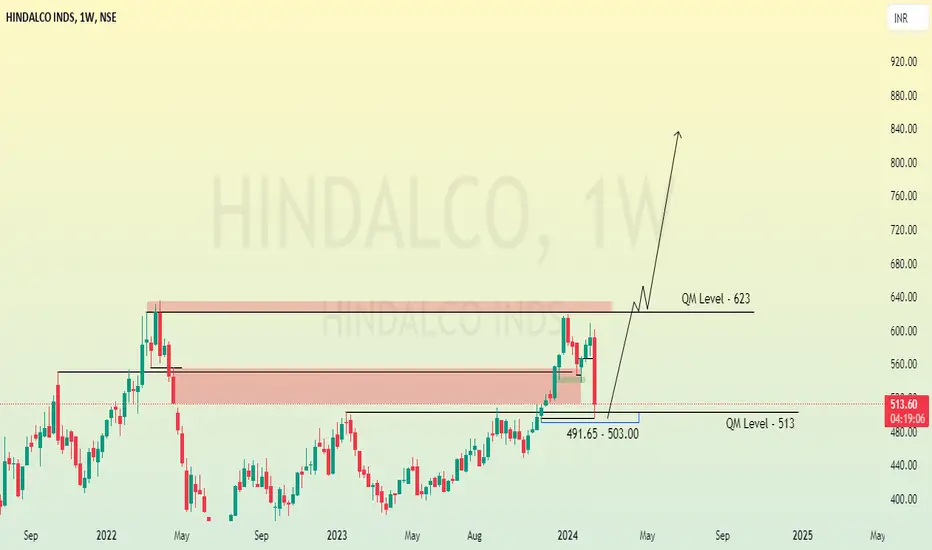
HINDALCO - Long SetupHello traders, let's look at the current technical structure for Hindalco Industries Limited (HINDALCO) on the 125-minute timeframe.
After a strong rally of over 16% driven by solid QoQ and YoY earnings performance, the stock touched a high of 1,088 before entering a swift corrective pullback. The price recently tested a low of 1,021.4 and is now showing signs of stabilizing at key demand confluence.
Key Technical Observations:
Fibonacci Retracement Confluence: Based on backtested parameters
In-depth trading ideas
Hindalco⚙️ STOCK TO WATCH ⚙️
Hindalco Industries Ltd.
₹1,075 → ₹1,444 👀
A leading aluminium and copper producer appearing on my Weekly R4 Breakout Scanner.
📌 Buy Zone: ₹1,075
📌 Breakout Zone: ₹1,075
🛑 Stop Loss: ₹935
🎯 Target: ₹1,444
Why Hindalco?
⛏️ One of India's leading integrated aluminium and copper producers, with global exposure through Novelis.
🌍 Diversified operations across aluminium, copper and value-added products provide exposure to multiple industrial end markets.
📈 Q1 FY27 was excep
HINDALCO: 1H Impulsive Breakout & Dynamic Moving Average Ribbon 📊 Hindalco Industries Limited (HINDALCO) - 1-Hour (1H) Chart Analysis
This post is shared for EDUCATIONAL PURPOSES ONLY to analyze short-term impulse breakouts, volume expansion dynamics, and dynamic moving average stack alignment. It is not financial or investment advice.
🎯 Educational Swing Setup:
• Entry Zone: 1,030.00 – 1,055.00 (Sizing into position blocks near current levels, or accumulating on minor 1H pullbacks toward the 1,035.00 green EMA support shelf).
• Target 1: 1,130.00 (Near-te
HINDALCO Technical Analysis
**HINDALCO Technical Analysis 📈**
Hindalco continues to maintain a **bullish market structure**, with buyers defending higher levels and the long-term uptrend remaining intact.
🟢 **Resistance:** ₹1,340
🔵 **Support:** ₹780
A decisive breakout **above ₹1,340** could open the door for a fresh leg higher, supported by momentum and volume. On the downside, **₹780** remains a major support zone, and as long as price stays above it, the bullish outlook remains valid.
Patience is key—wait for con
TEDS Swing Trading Analysis | Hindalco | 10 July 26TEDS Swing Trading Analysis | Discipline Begins with Patience
Not every market move deserves an immediate trade.
One of the key principles of the TEDS (Trend Exhaustion Detection System) is to wait for confirmation, not prediction.
Chart Observation
🔹 The framework first identified a TEDS Short Queue, indicating that the market was entering a potential decision zone.
🔹 Instead of triggering an instant short position, the framework waited for additional confirmation before validating the tra
HINDALCO Stock Analysis
Fundamental Analysis
Hindalco continues to benefit from strong momentum in its Indian aluminium and copper businesses. In FY26, the company reported record revenue of ₹2.75 lakh crore and an all-time high EBITDA of ₹38,097 crore, driven by robust aluminium and copper operations. Management remains optimistic about FY27, supported by healthy aluminium prices, ongoing capacity expansion, and an expected turnaround in its subsidiary Novelis despite temporary disruptions at its Oswego facility.
Hindalco technical view🔹 Market Structure
Clear bullish trend with strong upside momentum from ~₹900 levels
Price structure forming higher highs & higher lows
Currently approaching a major supply zone
🔹 Key Levels
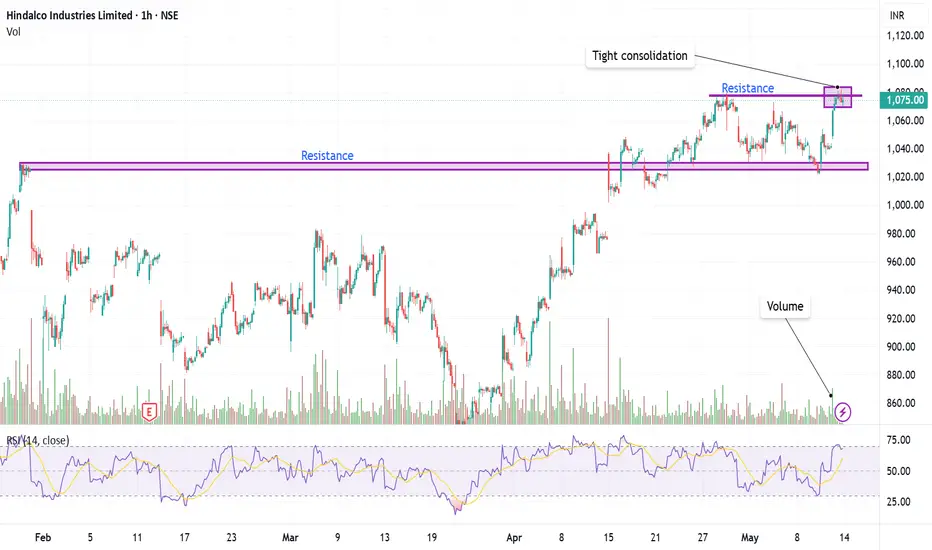
🟣 Major Resistance: ₹1,075 – ₹1,090
Strong historical resistance (multiple rejections visible)
Price currently facing supply near this zone
Marked by tight consolidation at highs
🟢 Immediate Support: ₹1,020 – ₹1,030
Previous resistance turned support
Breakdown below this → short-term trend weakness
Hindalco intraday trend analysis for tomorrow-May 08Hindalco is forming consecutive higher lows while continuing to exhibit bearish momentum.
There is a possibility of the stock testing the resistance zone around 1060–1065, while immediate
support levels are placed at 1037 and 1032.
Since opening gaps are not considered in this analysis, the mentioned levels may vary depending
on gap-up or gap-down openings. However, the overall downward momentum remains intact for tomorrow.
This is purely my personal view and not a recommendation to buy or s
NSE – NIFTY 750 | HINDALCO INDUSTRIES | 11 Mar 2026Long-Term Structure
Hindalco shows a long period of cyclical commodity behaviour before a structural transition following the 2020 decline. Price rebounded strongly from long-term support and broke out of the multi-year range.
Current Behaviour
Since then the stock has developed a sustained advance marked by higher highs and higher lows. Price is currently trading near the upper region of the structure following this multi-year advance.
Structure assessed from earliest reliable data.
Part of
Hindalco Projection**Hindalco Industries Limited – Business Model**
**1. Overview**
Hindalco Industries Limited is one of the world’s largest aluminum rolling and recycling companies and a major producer of primary aluminum and copper. It is part of the Aditya Birla Group. The company operates a fully integrated business model covering mining, refining, smelting, rolling, recycling, and downstream product manufacturing.
---
**2. Upstream Operations (Raw Material Production)**
Hindalco controls the early stages
Hindalco Price Action ## Hindalco Industries – Business Model (Without Hyperlinks and Images)
### 1. Overview
Hindalco Industries Limited is one of the world’s leading aluminum and copper manufacturing companies and a flagship metals company of the Aditya Birla Group. The company operates an integrated business model covering the entire value chain — from mining raw materials to producing finished metal products and value-added solutions.
Hindalco’s business is broadly divided into **Aluminium Business**, **Copper
Review and plan for 17th February 2026 Nifty future and banknifty future analysis and intraday plan.
This video is for information/education purpose only. you are 100% responsible for any actions you take by reading/viewing this post.
please consult your financial advisor before taking any action.
----Vinaykumar hiremath, CMT
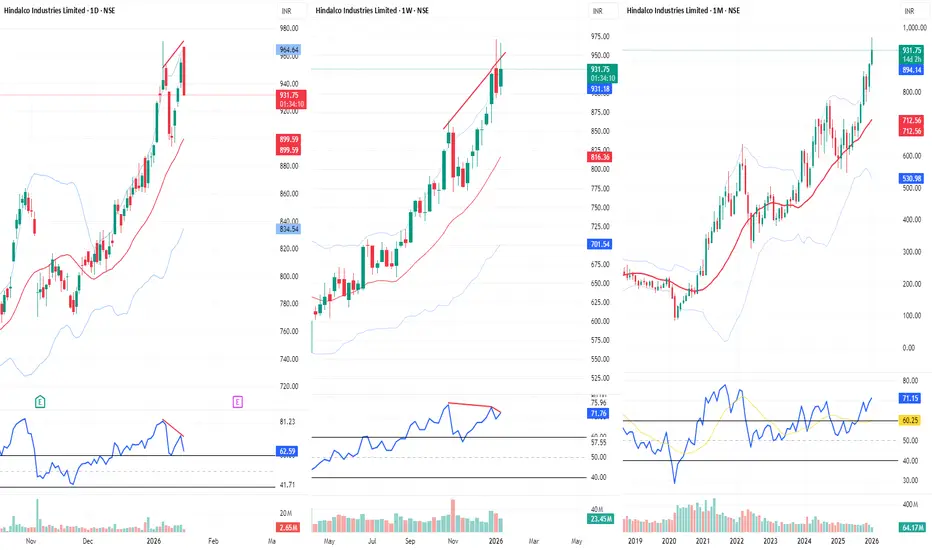
HINDALCO | Multi-Timeframe Structure Note (Educational)
Big Picture (Monthly)
- Current candle structure reflects late-stage extension rather than fresh expansion.
- Momentum remains positive, but rate of change is slowing → a classic exhaustion zone, not a
reversal call.
- Monthly RSI holding above 60 keeps the primary trend intact, but risk-reward compresses at
highs.
- Inference :
Trend is up, but upside becomes incremental, downside risk expands.
Intermediate Trend (Weekly)
- Well-defined uptrend channel, price hugging the