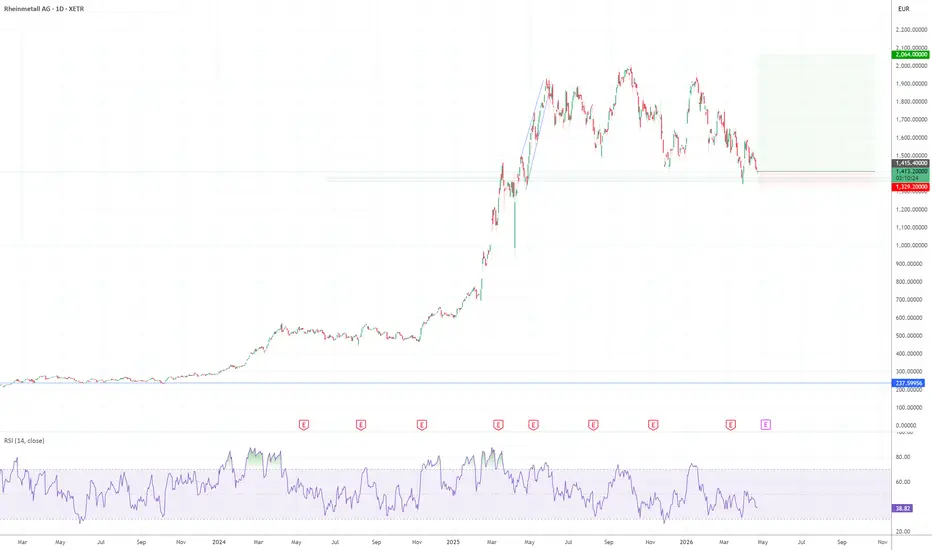
Adding Rheinmethall at the current priceRheinmetall is currently trading around €1,071 after a brutal June that saw the stock crash nearly 23% in a single month. The main trigger was Germany's abrupt cancellation of the €12 billion F126 frigate program on June 24, which sent shares down 19% in one day alone. That's the big drop visible on the chart — it's a panic event driven by one contract loss, not a sign the business is broken.
The recovery has already started. The stock bounced 4–5% as bargain hunters stepped in, and on June 30 the company confirmed a new Ukraine artillery contract with production already running in Spain, scheduled for delivery in Q1 2027. The core defense business is very much alive.
From a fundamental standpoint, the setup looks attractive. 18 analysts currently rate the stock a Strong Buy with zero sell ratings, and the average price target sits at €1,765 — roughly 68% above where it trades today. The next earnings report on August 6 could be a major catalyst, with revenue expected to hit €3 billion for the quarter.
On the chart, the plan is to ride a recovery back to €1,464 as the first target, which would represent a full retracement of the panic drop, and then on to €1,942 where the stock was trading before everything fell apart. The key level to watch on the downside is €932 — that's the floor. If it breaks below there with conviction, the trade is invalidated.
Risk/reward at current levels is solid, but the August earnings report is the real test. A miss there could put pressure on that support zone quickly.
Rheinmetall AG
No trades
No trades
In-depth trading ideas
Rheinmetall📊 ****Rheinmetall AG (RHM)****
ISIN: DE0007030009
****What the Company Does****
🛡️ Manufactures defense systems and military equipment
🚗 Produces automotive components and technologies
****Future Potential****
📈 Rising defense spending across NATO countries
🚀 Growth in military vehicles, ammunition, and air defense
****Future Risks****
⚔️ Competition from global defense contractors
🌍 Political decisions and changing defense budgets
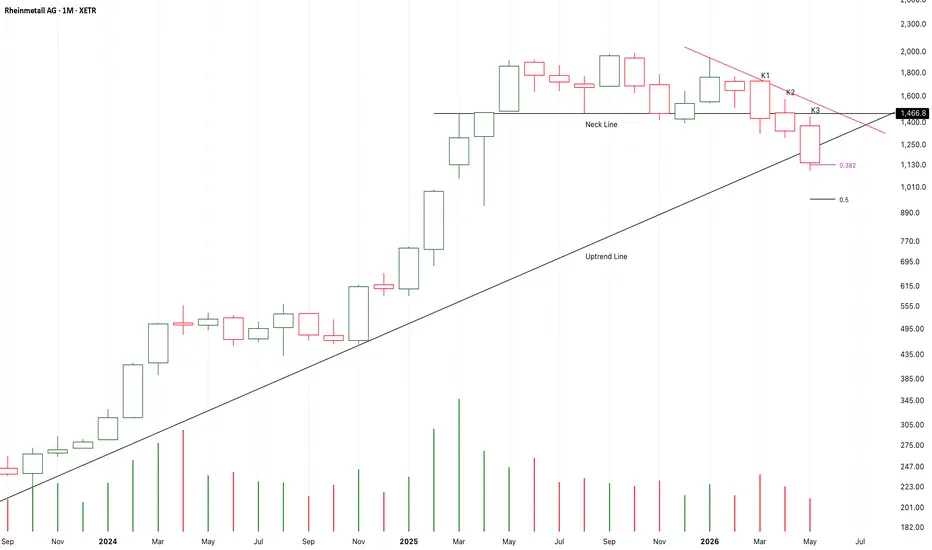
Chart Pattern Analysis Of RHM.
From K1 to K3,
It is a three soldiers advancing pattern,
It close below the neck line of a potential triple top bear head.
Besides, it is breaking down the long-term uptrend line.
If K3 obviously close below the uptrend line,
The 5 years bull market of military stock will possibly terminated here.
It will be a good place to short it if the following candles price up to test the neck line.
It seems that the years war between Russian and Ukraine will be ended at the end of this year or the next year.
On the other hand,
If K4 return back upon the neck line,
The bull market will keep pricing up to test 2000USD or even break up it.
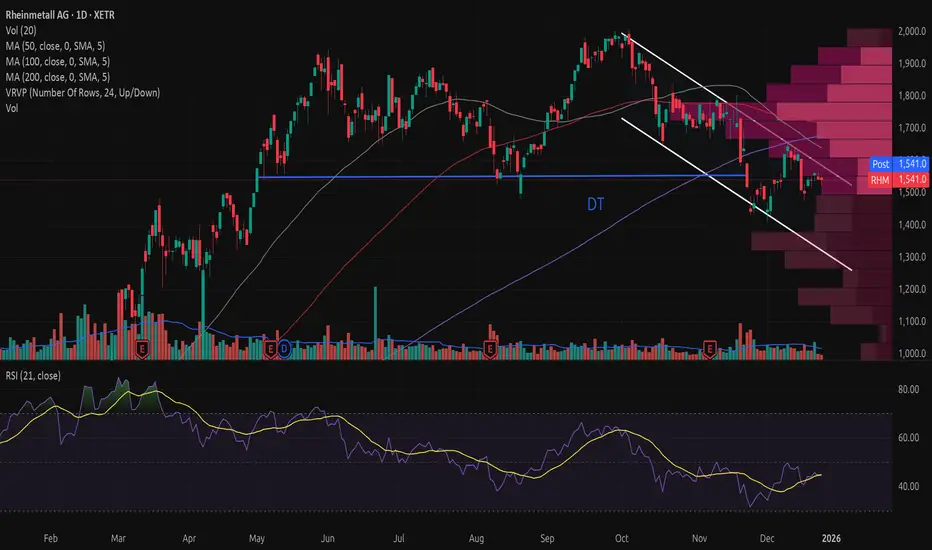
Double top formation and falling trendRHM has experienced both a significant and a marginal downside breakout from a double top (DT) formation, accompanied by increased volume. The stock has since rebounded, but it remains within a falling trend channel. It is therefore likely that another test and potential breakdown of the neckline of the double top formation will occur. If a significant breakout materializes, the stock could decline to 1125 or lower.
A double top formation is a bearish reversal pattern.
The trend is relatively short-term and is not yet fully reflected in the indicators. However, a negative volume balance and a declining RSI 21 support the bearish trend.
When a stock is in a trend, it tends to remain in that trend until the opposite is proven.
The stock is trading well below the red Ichimoku cloud.
From a technical perspective, the stock is bearish in the medium term, i.e. 1 to 6 months. This analysis is not a long-term forecast.
Fundamental analysts are clearly positive on the stock.
Disclaimer: I do not own the stock directly, but I have exposure through an ETF.
Note: You must conduct your own research and assessment before making any buy or sell decisions.
Diagonal downtrend resistance.After hitting the 400dayli SMA wich is were institutions want to load up.
Rheinmetal has found support and is now heading for ATH.
We will soon break this downtrend resistance and head back to ATH and new highs.
We been trading in a rectangle pattern for the past year and the price target would be €2500
Consolidation.Rheinmetal has been consolidating for 7 months now. Trading in a range between €1500 and €2000.
We recently seen a drop back to the 1500s. Now we managed to test the €1650 resistance zone and we seem to be holding above €1600 support zone now.
Earnings are getting closer and we could see new highs then.
Downtrent reversal XETR:RHM is suffering from fear and doubt due to the recent news on the war in Ukraine.
If this news blows over, the current price is a good opportunity to step in at a low level. Watch for the following on this chart.
The price is in the red on the Supertrend.
The Volume is higher than the blue line, and it is a dark green bar.
The LaRSI crosses the bottom line up.
We are also reaching oversold territory on the RSI (Current: just above 30)
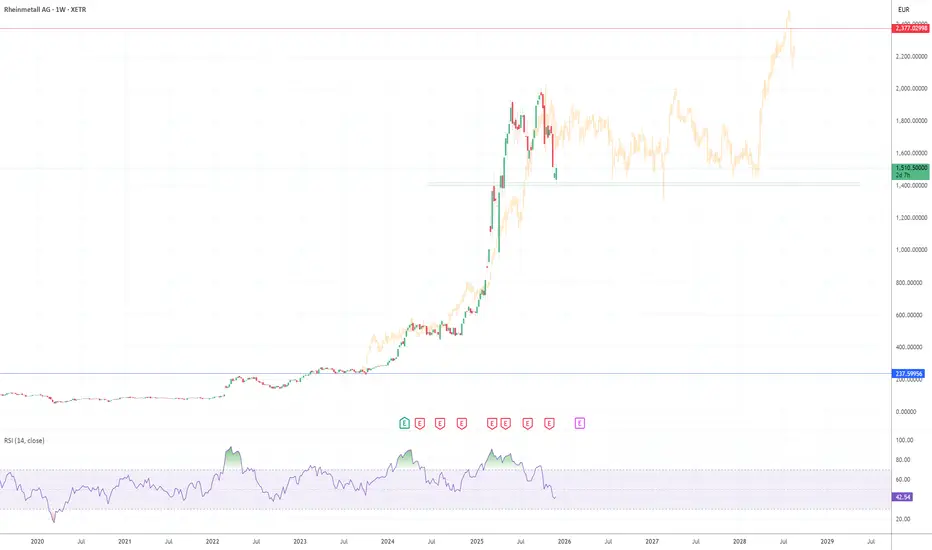
$RHM now beneath 1500 E and the Weekly 50 MA - Can it bounce?XETR:RHM has had a fabulous run since the start of the Ukraine War. It has contributed to the DAX making new highs up until the summer of 25.
However as mentioned elsewhere the possibility of a Ukraine Peace Plan has taken the lustre of European aerospace and defence stock, and RHM has been hit hard. From tickling the soft underbelly of 2000 Euros were no beneath 1500 Euros and also beneath the weekly 50 Moving Average. Is this where it bounces, or do we see more moves lower?
Personally, I think any kind of peace agreement means we move lower, and i wonder if we head back to the 1000 Euro area. However if the peace plan is scuppered then we're likely to reclaim the 50MA and the 1500 Euro level...though it may not return to the highs of 2000 Euro.
This will be a case of watching the news, and taking the lead from the negotiations. I wish for a just peace...but i winder if there's too many people making too much money out of the Ukraine War to allow it to end any time soon. Or is that just me being a cynical old b*stard?
Pitchfork to see estimate time untill 2100I used a pitchfork based on Elliot impulse and correction waves to get an idea of how steep this bull run might turn out.
A verry Rough 100 days until XETR:RHM 2100 is the answer (if it holds).
Any daily close below the bottom blue zone is a trend reversal downwards. Take some profits if it gets high up in the top blue zone.
Great opportunity to buy RHM at discountPYTH:RHM fell down from its ATH and this is a golden opportunity to dip buy. Within no time it will already be above 2000 euros as this is the backbone of German and perhaps also EU defense industry. Remember folks there is a big push to churn out defense equipment, weapons in the EU and across the world and it only accelerates in the next 5 years. This stock will go to 5000 euros in next 5 years.
News alert: Rheinmetall Joint Venture Gets $4 Billion Combat Vehicle Order
www.tradingview.com
RHM ready for last push upIn my last post I thought 1800-1900 will be the top, but considering the pattern going on at the moment, a push to 2200-2300 is more than likely.
Don't forget, all these moves will at some point be given back. I think a dump to 500€ is possible afterwards.
My trade idea for now: buy at 1600 and aim for 2200 (40% possible gain)
Rheinmetall now faces a crucial testWill it continue to dominate as Germany’s biggest defence player—or is the soaring rally over, giving smaller names in the sector a chance to gain strength?
🟢 The green scenario outlines what I see as the healthiest outcome: a controlled correction to absorb parts of the massive rally, allowing the market to reset before pushing to new highs.
🔵 The blue path would be less ideal. It suggests a shift into a bearish structure, which could trigger a deeper retracement—potentially even breaking below Point B of our overarching white sequence.
For now, I’ve locked in some profits and will sit back.
No clear buy. No clear sell.
Stay sharp, friends—and remember: the chart speaks before the headlines.
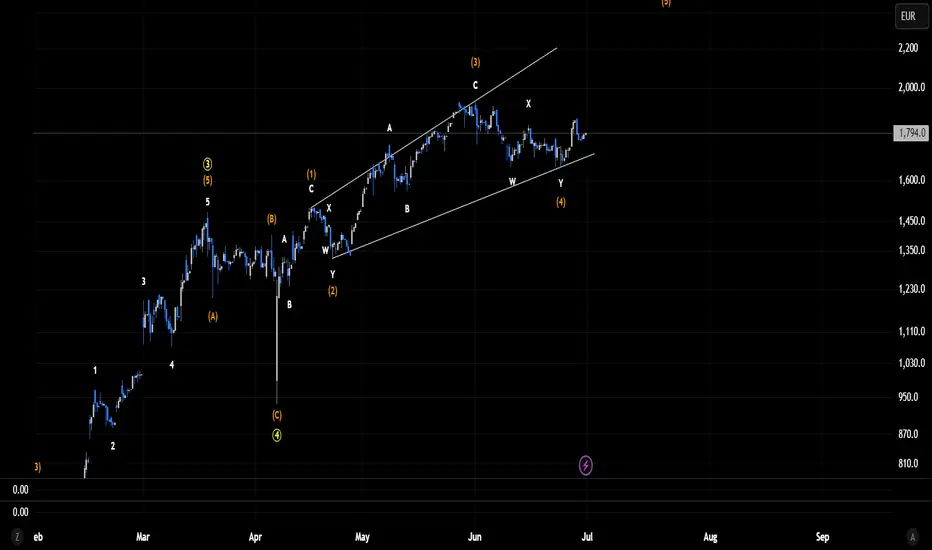
Rheinmetall Ag - Micro Timeframe EW-analysisI have two possible short-term scenarios for Rheinmetall. Both share the same structure on the higher degrees, but they differ slightly in the short term. Despite the difference in micro-counts, both scenarios remain bullish in the near term. As shown here, in this scenario, Wave 5 (yellow) is unfolding as an ending expanding diagonal, with each subwave in orange forming either a zigzag or a double zigzag. One small issue in this count is that Wave 4 (orange) hasn’t yet moved into the price territory of Wave 1 (orange), which is typically expected in an expanding diagonal. However, this is a guideline, not a rule so the count remains valid. Wave 4 (orange) may not be completed yet, and a break below the previous low would indicate that it's still in progress. For now, though, the structure suggests that Wave 5 (orange) has already begun and is expected to lead to a new all-time high. To validate this scenario, Wave 5 (orange) should unfold as a single zigzag (ABC) or a double zigzag (WXY). If instead it develops as a five-wave impulse, this count would be invalidated, and my second scenario would take over. The completion of this ending expanding diagonal would not only finish Wave 5 (yellow), but also mark the end of the larger Wave 3, (two degrees higher), which began on November 20, 2008.
With NATO recently announcing that nearly every European country except Spain will allocate 5% of GDP to defense, I expect that the correction following this major wave 3 impulse may be relatively shallow. More likely, we could see a broad distribution phase take shape, possibly in the form of a triangle rather than a sharp retracement.
Disclaimer: This analysis is for informational and educational purposes only and should not be considered financial or investment advice. All trading involves risk, and you should perform your own due diligence before making any trading decisions. The author is not responsible for any losses that may arise from reliance on this content. Always trade at your own risk.
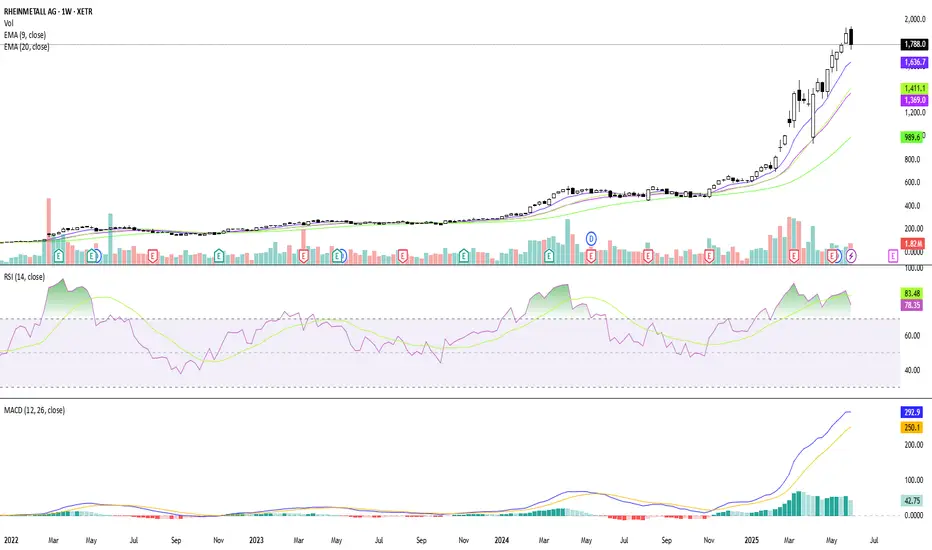
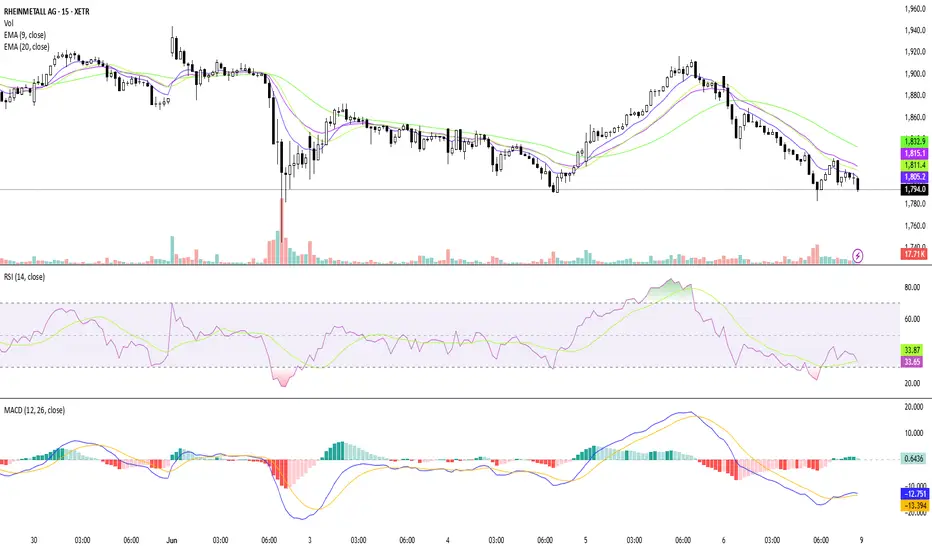
Idea for RHMThis chart is part of my active trading analysis on Rheinmetall (RHM.DE), focusing on both intraday movements and short-term trends (2–5 days).
Included Indicators:
EMA (9, 20, 50) – to assess momentum and dynamic support/resistance
RSI (14) – for overbought/oversold levels
MACD – to detect potential trend reversals
Volume – for confirmation of breakouts or fading moves
RHM.DE 1 hourThis chart is part of my active trading analysis on Rheinmetall (RHM.DE), focusing on both intraday movements and short-term trends (2–5 days).
Included Indicators for 1 hour:
EMA (9, 20, 50) – to assess momentum and dynamic support/resistance
RSI (14) – for overbought/oversold levels
MACD – to detect potential trend reversals
Volume – for confirmation of breakouts or fading moves
RHM.DEThis chart is part of my active trading analysis on Rheinmetall (RHM.DE), focusing on both intraday movements and short-term trends (2–5 days).
Included Indicators:
EMA (9, 20, 50) – to assess momentum and dynamic support/resistance
RSI (14) – for overbought/oversold levels
MACD – to detect potential trend reversals
Volume – for confirmation of breakouts or fading moves