CAD/JPY – Buy AnalysisMarket Structure: Clean bullish trend with a sequence of Higher Highs (HH) and Higher Lows (HL).
Resistance become Support Retest: Previous resistance broken and now it retest as horizontal support.
Fibonacci Confluence: Retracement lands directly on the 61.8% Golden Ratio level.
Momentum: RSI shows no bearish divergence, confirming trend strength remains intact.
Canadian Dollar / Japanese Yen
No trades
No trades
In-depth trading ideas
CADJPY: Bearish Drop to 113.80?FX:CADJPY is eyeing a bearish reversal on the 4-hour chart , with price testing a strong resistance zone near the 0.786 Fibonacci level and cumulative short liquidation area after recent recovery, converging with a potential entry zone that could trigger downside momentum if sellers defend amid volatility. This setup suggests a solid pullback opportunity toward lower support levels with approximately 1:3 risk-reward .🔥
Entry between 116.60–116.90 (entry from current price with proper risk management is recommended). Target at 113.80 . Set a stop loss at a daily close above 117.55 , yielding a risk-reward ratio of approximately 1:3 . Monitor for confirmation via a bearish candle close below entry with rising volume, leveraging the pair’s weakness near resistance.🌟
Fundamentally , CADJPY is trading around 116.30 in late July 2026.
For the Japanese Yen, the most important event this week is the Bank of Japan Interest Rate Decision and Quarterly Outlook Report (July 31), where any hawkish signals on further rate hikes would strengthen JPY and support downside in the pair.
For the Canadian Dollar, the key release is Canada GDP (July 31), where stronger-than-expected growth would support CAD, while weaker data could limit upside pressure. 💡
📝 Trade Setup
🎯 Entry (Short):
116.60 – 116.90
(Entry from current price is acceptable with proper position sizing and disciplined risk management.)
🎯 Target:
113.80
❌ Stop Loss:
• Daily candle close above 117.55
📈 Risk-to-Reward:
Approximately 1:3
💡 Will sellers defend the 116.60–116.90 resistance zone and drive CADJPY toward 113.80, or will buyers break above 117.55 and invalidate the bearish setup? 👇
CAD/JPY SHORT FROM RESISTANCE
CAD/JPY SIGNAL
Trade Direction: short
Entry Level: 116.343
Target Level: 115.978
Stop Loss: 116.585
RISK PROFILE
Risk level: medium
Suggested risk: 1%
Timeframe: 1h
Disclosure: I am part of Trade Nation's Influencer program and receive a monthly fee for using their TradingView charts in my analysis.
✅LIKE AND COMMENT MY IDEAS✅
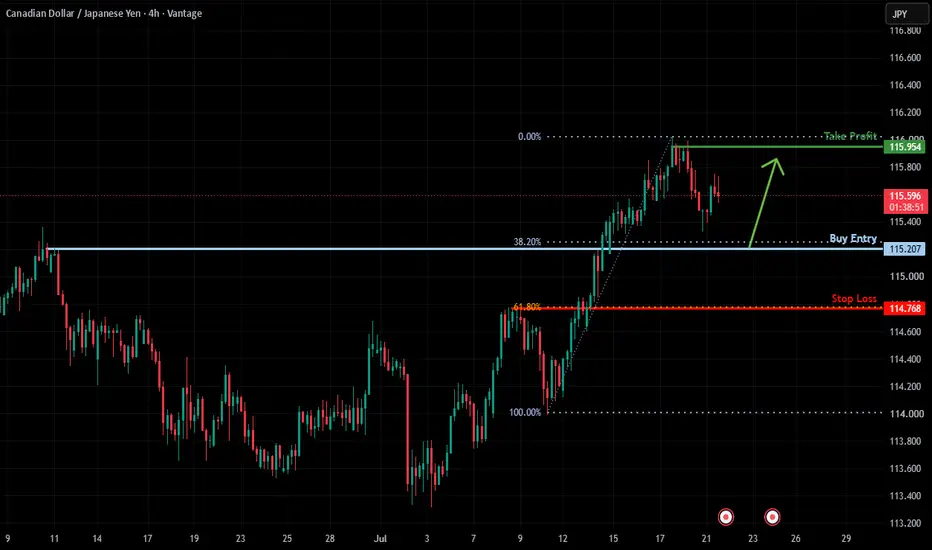
Bullish continuation setup?CAD/JPY is falling to the support level, which is a pullback support that aligns with the 38.2% Fibonacci retracement and could bounce from this level to our take profit.
Entry: 115.20
Why we like it:
There is a pullback support level that aligns with the 38.2% Fibonacci retracement.
Stop loss: 114.76
Why we like it:
There is a pullback support level that aligns with the 61.8% Fibonacci retracement.
Take profit: 115.95
Why we like it:
There is a pullback resistance level.
Enjoying your TradingView experience? Review us!
Please be advised that the information presented on TradingView is provided to Vantage (‘Vantage Global Limited’, ‘we’) by a third-party provider (‘Everest Fortune Group’). Please be reminded that you are solely responsible for the trading decisions on your account. There is a very high degree of risk involved in trading. Any information and/or content is intended entirely for research, educational and informational purposes only and does not constitute investment or consultation advice or investment strategy. The information is not tailored to the investment needs of any specific person and therefore does not involve a consideration of any of the investment objectives, financial situation or needs of any viewer that may receive it. Kindly also note that past performance is not a reliable indicator of future results. Actual results may differ materially from those anticipated in forward-looking or past performance statements. We assume no liability as to the accuracy or completeness of any of the information and/or content provided herein and the Company cannot be held responsible for any omission, mistake nor for any loss or damage including without limitation to any loss of profit which may arise from reliance on any information supplied by Everest Fortune Group.
CADJPY - BEARISH BIAS CADJPY - BEARISH BIAS
~ WEEKLY - Price has been bullish since April 2025, momentum has slowed down since March 2026 and price broke previous HL indicating the possibility of the market changing direction.
~ DAILY - We wait for price to pull back to the AOI which is a strong fib level, psychological level and most importantly, multiple rejections making it a strong resistance level.
This is a high risk trade as we are looking to take a counter trend trade. Market is bullish across all 3 timeframes - Weekly, Daily and 4HR.
As price moves up to my level, I will wait for my confirmations across multiple timeframes and see how price reacts.
#forextrading #tradingeducation #swingtrader #tradingstrategy #mjswings
CADJPY Daily Trade Setup 30/7/26CADJPY shows strong multi-timeframe Elliott Wave alignment, with the higher timeframe maintaining a broader bullish structure while the H4 chart develops a short-term correction within that trend. This suggests the current H4 weakness may be part of a larger continuation setup rather than an isolated reversal.
On the weekly timeframe, the bullish outlook remains valid as long as price holds its higher-low structure and key Fibonacci support. The broader wave count still favors a corrective pullback inside an ongoing uptrend, rather than a full bearish reversal. The main focus is whether this correction is forming as an ABC pattern, triangle, or complex consolidation before the next upside move begins. On the H4 chart, price action appears to represent the execution phase of that broader view. If CADJPY continues to compress inside a channel, wedge, or triangle while respecting higher-timeframe support, the correction may be nearing completion. A sweep of liquidity into support followed by a strong reclaim would offer a clearer sign that the pullback has ended and bullish momentum is returning.
The most important factor is the overlap between higher-timeframe support and the H4 termination zone. If the H4 correction completes near daily or weekly Fibonacci support, a prior wave-four area, or rising channel support, the probability of a bullish continuation increases. A break above H4 corrective resistance would be the first signal of a trend shift, while reclaiming the latest lower high would provide stronger confirmation of a new impulsive move. Overall, CADJPY remains constructive across timeframes, with the preferred scenario calling for a short-term correction into support before another leg higher. This bullish view stays intact while the higher-timeframe higher-low structure holds. A sustained move below that support would weaken the setup and point to a deeper correction.
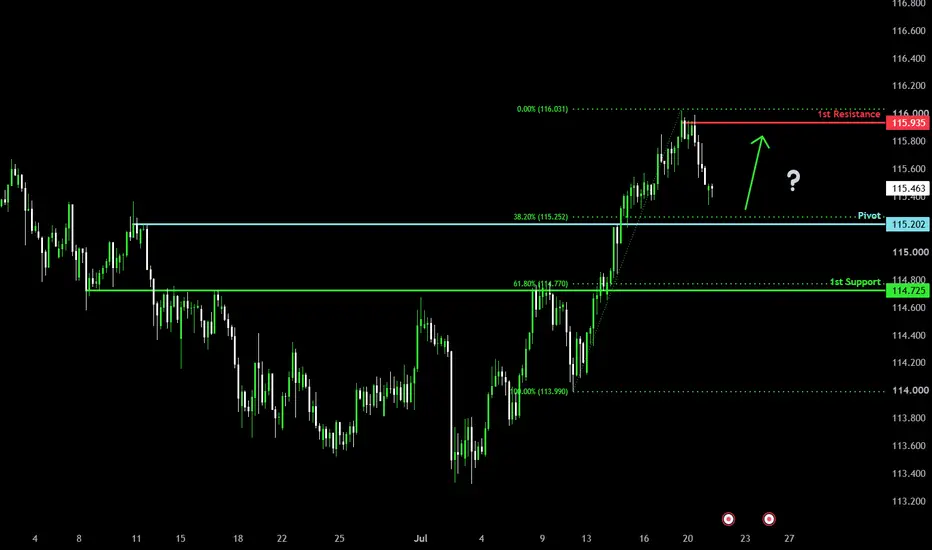
Falling towards pullback support?CAD/JPY is falling towards the pivot, which is a pullback support that aligns with the 38.2% Fibonacci retracement and could bounce towards the 1st resistance which acts as pullback resistance.
Pivot: 115.20
1st Support: 114.72
1st Resistance: 115.93
Disclaimer:
The opinions given above constitute general market commentary and do not constitute the opinion or advice of IC Markets or any form of personal or investment advice.
Any opinions, news, research, analyses, prices, other information, or links to third-party sites contained on this website are provided on an "as-is" basis, are intended to be informative only, and are not advice, a recommendation, research, a record of our trading prices, an offer of, or solicitation for, a transaction in any financial instrument and thus should not be treated as such. The information provided does not involve any specific investment objectives, financial situation, or needs of any specific person who may receive it. Please be aware that past performance is not a reliable indicator of future performance and/or results. Past performance or forward-looking scenarios based upon the reasonable beliefs of the third-party provider are not a guarantee of future performance. Actual results may differ materially from those anticipated in forward-looking or past performance statements. IC Markets makes no representation or warranty and assumes no liability as to the accuracy or completeness of the information provided, nor any loss arising from any investment based on a recommendation, forecast, or any information supplied by any third party.
CAD/JPY: Liquidity Sweep, Mitigation, and Continuation WatchCAD/JPY took out sell-side liquidity, swept the internal lower-timeframe liquidity, and mitigated the internal structural order block and lower-timeframe auction zone. I entered aligned with the shift in momentum, with the purple order flow order block below acting as my protected zone.
I’m now waiting for delivery and watching for any deeper retracement into the zone for continuation confirmation. Until then, patience stays the edge — structure is still the guide.
CADJPY Massive Short! SELL!
My dear subscribers,
CADJPY looks like it will make a good move, and here are the details:
The market is trading on 116.22 pivot level.
Bias - Bearish
Technical Indicators: Both Super Trend & Pivot HL indicate a highly probable Bearish continuation.
Target - 115.94
About Used Indicators:
The average true range (ATR) plays an important role in 'Supertrend' as the indicator uses ATR to calculate its value. The ATR indicator signals the degree of price volatility.
Disclosure: I am part of Trade Nation's Influencer program and receive a monthly fee for using their TradingView charts in my analysis.
———————————
WISH YOU ALL LUCK
Bullish bounce at key support?CAD/JPY is falling to the support level, which is an overlap support that aligns with the 38.2% Fibonacci retracement and could bounce from this level to our take-profit.
Entry: 114.71
Why we like it:
There is an overlap support level that aligns with the 38.2% Fibonacci retracement.
Stop loss: 114.14
Why we like it:
There is an overlap support level that aligns with the 61.8% Fibonacci retracement.
Take profit: 115.58
Why we like it:
There is a pullback resistance level.
Enjoying your TradingView experience? Review us!
Please be advised that the information presented on TradingView is provided to Vantage (‘Vantage Global Limited’, ‘we’) by a third-party provider (‘Everest Fortune Group’). Please be reminded that you are solely responsible for the trading decisions on your account. There is a very high degree of risk involved in trading. Any information and/or content is intended entirely for research, educational and informational purposes only and does not constitute investment or consultation advice or investment strategy. The information is not tailored to the investment needs of any specific person and therefore does not involve a consideration of any of the investment objectives, financial situation or needs of any viewer that may receive it. Kindly also note that past performance is not a reliable indicator of future results. Actual results may differ materially from those anticipated in forward-looking or past performance statements. We assume no liability as to the accuracy or completeness of any of the information and/or content provided herein and the Company cannot be held responsible for any omission, mistake nor for any loss or damage including without limitation to any loss of profit which may arise from reliance on any information supplied by Everest Fortune Group.
CAD/JPY: Bullish Bias, Waiting DiscountThe higher-time-frame outlook remains bullish. Price continues to print higher highs and higher lows while taking external liquidity and mitigating key higher-time-frame points of interest. The overall bullish mapping from previous weeks remains intact, with no structural invalidation.
On the intermediate time frame, price has engineered liquidity by taking several internal liquidity legs while maintaining the overall bullish structure. My current focus is on the next lower-time-frame liquidity event.
I’m waiting for the current internal liquidity to be swept before looking for bullish continuation. If price respects the lower-time-frame order blocks beneath that inducement, I’ll begin monitoring for lower-time-frame confirmation. If those areas fail to hold, I’ll expect a deeper retracement into the 50% equilibrium or the extreme discount area, where multiple order-flow points of interest sit beneath the engineered liquidity.
The purple levels highlight higher-time-frame structural references and provide additional confluence. They help keep the broader market context in focus while tracking where significant liquidity is positioned. Every major structural level represents potential liquidity, making these areas important to monitor as price develops.
For now, patience remains the priority. I’ll continue tracking price as it approaches my areas of interest and wait for confirmation before considering execution. Let’s see what the market delivers this week.
CAD/JPY Bearish Rejection Signals Potential Drop Toward 114.08Technical Outlook
Resistance: 115.85–115.95 (major supply zone)
Current Price: ~115.68
Immediate Support: 115.55
Next Support Targets: 115.20 → 114.78 → 114.08
The previous ascending trendline has already been broken, signaling that bullish momentum has faded. After bouncing from 115.45, price failed to create a higher high and is now stalling beneath resistance, increasing the likelihood of another bearish leg.
Bearish Scenario
A decisive break below 115.55 would confirm renewed selling momentum.
Targets:
🎯 Target 1: 115.20
🎯 Target 2: 114.78
🎯 Target 3: 114.08 (major demand zone)
Invalidation
If buyers reclaim and close above 115.90–116.00, the bearish setup would weaken, opening the door for another attempt at higher highs.
Trading Bias
Bearish. As long as CAD/JPY remains below the 115.85–115.95 resistance zone, rallies are likely to attract sellers, with 115.20 as the first downside objective, followed by 114.78 and 114.08 if selling pressure accelerates.
CADJPY – Professional Technical Outlook (Cup & Handle Pattern)1HCADJPY is developing a classic Cup & Handle formation, indicating a potential bullish continuation structure. The rounded base reflects strong accumulation, followed by a controlled pullback forming the handle near key resistance.
Trade Perspective:
A confirmed breakout and sustained close above the 115.75 neckline would validate the pattern, opening upside potential toward 116.30+ based on measured move projection.
Invalidation:
Failure to hold above 115.20, or a breakdown below the handle structure, would weaken the bullish setup and may lead to a deeper retracement.
Conclusion:
The structure favors bulls, with price compressing below resistance — a breakout scenario remains the preferred directional bias.
👉 Share your thoughts in the comments — what’s your view on CADJPY? Do you see a breakout or rejection from this level?
CADJPY - Bearish BatCADJPY has completed a bearish harmonic structure near the 0.886 XA retracement, with price reacting from the D-zone around major resistance. The pair is currently attempting to push back upward after the initial rejection, but it remains below the main resistance/PRZ area.
In relation to the volume profile, price is trading near the upper portion of value, with heavier volume below acting as a potential magnet if rejection continues. RSI is rising back toward the upper range, so momentum is currently recovering, but this zone still requires caution because price is approaching a prior rejection area.
Overall, this is a bearish reversal watch, not an automatic short. The key is whether price rejects again near resistance or breaks and holds above the D/PRZ zone.
CAD-JPY Bullish Continuation Expected! Buy!
Hello,Traders!
CADJPY has broken above a horizontal demand area with a strong liquidity sweep and bullish displacement. A breakout retest could confirm continuation toward the next supply target. Time Frame 6H.
Buy!
Comment and subscribe to help us grow!
Check out other forecasts below too!
Swing Trade Idea on CADJPY for a Sell. OANDA:CADJPY just cleared some minor trend double-bottom liquidity, printed a bearish weekly candle close. We have just three more days before a monthly bearish candle completion of which, at this time, it's kinda certain to close bearish. 😁 #Anything-is-possible
That being said, we are heading into Q3, and things are about to continue interesting as they are in Q2.
There is some double-bottom liquidity from Q1 on this chart that I expect to be cleared soon, given that the BOJ is looking to intervene on the yen's weakness.
Additionally, price action from the higher timeframe is signaling a potential reversal, so I am considering placing a risk on this trade because it aligns with my trade criteria both fundamentally and technically.
#CADJPY
SELL Trade
1:6 RR
Expectation, 1-2 weeks
Manage risk, and let's get it.
CADJPY Bullish Rebound Ahead!
HI,Traders !
#CADJPY fell down sharply
And the pair was oversold
So we are not surprised to
See a bullish rebound from
The strong horizontal support
Around 113.956 level and we
Think that we are likely
To see a further bullish move up !
Comment and subscribe to help us grow !
JPYCAD H2: Consolidation May Be Setting Up the Next Bearish MoveJPYCAD continues to trade within a descending channel, indicating that the primary trend remains bearish. After rebounding from the lower boundary of the channel, the pair is now consolidating just below short-term resistance, suggesting that buying pressure remains weak and is not yet strong enough to trigger a convincing breakout.
The current consolidation is taking place in an area where selling pressure has previously emerged. If the price is rejected again and breaks below the bottom of the sideways range, the downtrend is likely to resume, with the next downside target at 0.008520.
Primary Scenario:
Sell opportunities are favored if JPYCAD breaks below the consolidation range and confirms a bearish continuation.
Target: 0.008520.
Invalidation:
The bearish outlook will be invalidated if the price breaks above the consolidation zone and holds above the nearby resistance, in which case the short-term market structure should be reassessed.