CAD/JPY – Buy AnalysisMarket Structure: Clean bullish trend with a sequence of Higher Highs (HH) and Higher Lows (HL).
Resistance become Support Retest: Previous resistance broken and now it retest as horizontal support.
Fibonacci Confluence: Retracement lands directly on the 61.8% Golden Ratio level.
Momentum: RSI shows
Canadian Dollar / Japanese Yen
No trades
No trades
Compare with CAD to JPY
Details
The Canadian Dollar vs. the Japanese Yen. When a trader is unsure about trading the US Dollar, the CADJPY is often determined to be a suitable replacement. However, the historically higher yield of the Canadian dollar in the past has made the CADJPY more sensitive to market wide sentiment changes than the USDJPY. Also, Canada’s large amount of energy exports, most notable oil, causes it to be affected by crude oil prices.
CADJPY: Bearish Drop to 113.80?FX:CADJPY is eyeing a bearish reversal on the 4-hour chart , with price testing a strong resistance zone near the 0.786 Fibonacci level and cumulative short liquidation area after recent recovery, converging with a potential entry zone that could trigger downside momentum if sellers defend amid
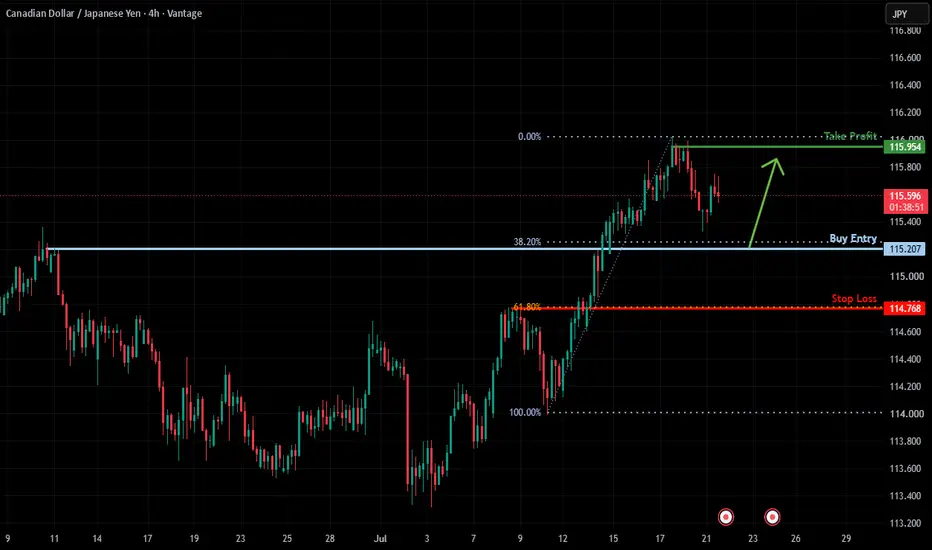
Bullish continuation setup?CAD/JPY is falling to the support level, which is a pullback support that aligns with the 38.2% Fibonacci retracement and could bounce from this level to our take profit.
Entry: 115.20
Why we like it:
There is a pullback support level that aligns with the 38.2% Fibonacci retracement.
Stop loss: 11
CAD/JPY SHORT FROM RESISTANCE
CAD/JPY SIGNAL
Trade Direction: short
Entry Level: 116.343
Target Level: 115.978
Stop Loss: 116.585
RISK PROFILE
Risk level: medium
Suggested risk: 1%
Timeframe: 1h
Disclosure: I am part of Trade Nation's Influencer program and receive a monthly fee for using their TradingView charts in my anal
CADJPY - BEARISH BIAS CADJPY - BEARISH BIAS
~ WEEKLY - Price has been bullish since April 2025, momentum has slowed down since March 2026 and price broke previous HL indicating the possibility of the market changing direction.
~ DAILY - We wait for price to pull back to the AOI which is a strong fib level, psychologica
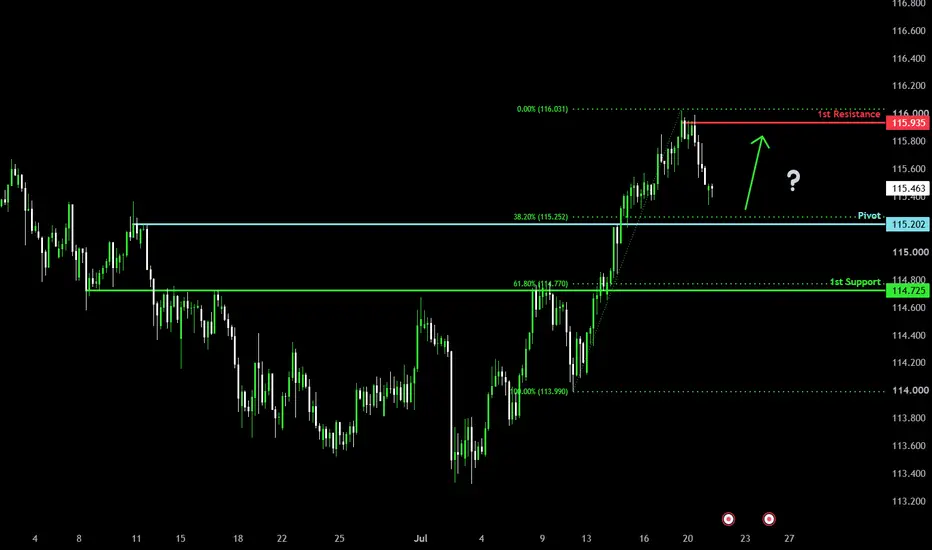
Falling towards pullback support?CAD/JPY is falling towards the pivot, which is a pullback support that aligns with the 38.2% Fibonacci retracement and could bounce towards the 1st resistance which acts as pullback resistance.
Pivot: 115.20
1st Support: 114.72
1st Resistance: 115.93
Disclaimer:
The opinions given above constitu
CAD/JPY: Liquidity Sweep, Mitigation, and Continuation WatchCAD/JPY took out sell-side liquidity, swept the internal lower-timeframe liquidity, and mitigated the internal structural order block and lower-timeframe auction zone. I entered aligned with the shift in momentum, with the purple order flow order block below acting as my protected zone.
I’m now wait
CADJPY Massive Short! SELL!
My dear subscribers,
CADJPY looks like it will make a good move, and here are the details:
The market is trading on 116.22 pivot level.
Bias - Bearish
Technical Indicators: Both Super Trend & Pivot HL indicate a highly probable Bearish continuation.
Target - 115.94
About Used Indicators:
T
See all ideas
Summarizing what the indicators are suggesting.
Oscillators
Neutral
SellBuy
Strong sellStrong buy
Strong sellSellNeutralBuyStrong buy
Oscillators
Neutral
SellBuy
Strong sellStrong buy
Strong sellSellNeutralBuyStrong buy
Summary
Neutral
SellBuy
Strong sellStrong buy
Strong sellSellNeutralBuyStrong buy
Summary
Neutral
SellBuy
Strong sellStrong buy
Strong sellSellNeutralBuyStrong buy
Summary
Neutral
SellBuy
Strong sellStrong buy
Strong sellSellNeutralBuyStrong buy
Moving Averages
Neutral
SellBuy
Strong sellStrong buy
Strong sellSellNeutralBuyStrong buy
Moving Averages
Neutral
SellBuy
Strong sellStrong buy
Strong sellSellNeutralBuyStrong buy
Displays a symbol's price movements over previous years to identify recurring trends.
Frequently asked questions
The current rate of CADJPY is 114.060 JPY — it has decreased by −1.58% in the past 24 hours. See more of CADJPY rate dynamics on the detailed chart.
The value of the CADJPY pair is quoted as 1 CAD per x JPY. For example, if the pair is trading at 1.50, it means it takes 1.5 JPY to buy 1 CAD.
The term volatility describes the risk related to the changes in an asset's value. CADJPY has the volatility rating of 3.29%. Track all currencies' changes with our live Forex Heatmap and prepare for markets volatility.
The CADJPY showed a −1.05% fall over the past week, the month change is a 0.57% rise, and over the last year it has increased by 5.83%. Track live rate changes on the CADJPY chart.
Learn how you can make money on rate changes in numerous trading ideas created by our community.
CADJPY is a minor currency pair, i.e. a popular pair that is not associated with USD. Such pairs are also called cross currency pairs.
Currencies are usually traded through forex brokers — choose the one that suits your needs and go ahead. You can trade CADJPY right from TradingView charts — just log in to you broker account. Check out the list of our integrated brokers and find the best one for your needs and strategy.
When deciding to buy or sell currency one should keep in mind many factors including current geopolitical situation, interest rates, and other. But before plunging into a deep research, you can start with CADJPY technical analysis. The technical rating for the pair is sell today, but don't forget that markets can be very unstable, so don't stop here. According to our 1 week rating the CADJPY shows the sell signal, and 1 month rating is strong buy. See more of CADJPY technicals for a more comprehensive analysis.