Why Are Corn Futures Suddenly Surging Amidst Chaos?Macroeconomics and the War Premium
Corn futures recently hit fresh highs, pushing past $4.90 per bushel. This surge defies standard seasonal expectations. A significant driver is the undeniable geopolitical tension impacting global markets. A distinct "war premium" is currently inflating grain values. Escalating hostilities continually threaten critical supply chains. Grain markets remain acutely sensitive to international disruptions. Traders furiously price in potential supply shocks. Global economic uncertainty forces investors to seek tangible assets like agricultural commodities. This macroeconomic environment perfectly supports sustained price elevation. Consequently, corn futures are experiencing robust, volatility-driven momentum.
Geopolitics and Global Supply Chains
Geopolitics dictates the underlying anxiety in agricultural markets. The conflict in the Middle East has disrupted global energy shipments. These disruptions ripple outward, impacting agricultural logistics heavily. Furthermore, escalating Russia-Ukraine hostilities constantly threaten Black Sea grain exports. The market recognizes the fragility of these crucial maritime routes. Therefore, buyers scramble to secure reliable North American supplies. This geopolitical instability forces nations to reevaluate their food security strategies. They increase domestic stockpiling, tightening available global inventory. The resulting supply squeeze directly translates to higher futures pricing.
Industry Trends: Weather and Crop Conditions
The agricultural industry remains relentlessly captive to Mother Nature. Persistent dry weather across the U.S. significantly fuels the current rally. A hot, dry outlook for the western Corn Belt deeply concerns traders. The U.S. Drought Monitor confirms deteriorating conditions across the High Plains. High temperatures severely threaten crop yields during critical developmental phases. If upper Midwest dryness persists, the national yield average could plummet. Analysts anticipate a sharp drop in USDA crop ratings soon. This harsh reality forces market participants to aggressively re-price risk. The weather premium now heavily supplements the geopolitical war premium.
Technology and New Financial Instruments
The financial technology sector continuously innovates risk management tools. The CME Group recently addressed specific agricultural market needs. They are launching an innovative new sorghum futures contract. This contract specifically targets basis risk against corn. It prices sorghum as a direct differential to corn futures. This structure allows producers to hedge cash spread changes efficiently. They avoid taking full exposure to broader grain-market swings. This high-tech financial engineering provides crucial localized price discovery. It demonstrates the industry's commitment to sophisticated, targeted risk management.
Business Models: Strategic Hedging
Modern farming operates on highly complex business models. Producers must actively manage extreme price volatility. The new sorghum contract exemplifies this necessity. Elevators, feeders, and ethanol plants require precise hedging tools. They must manage the unpredictable spread between grain varieties. Geopolitical events or local supply shifts can violently swing these spreads. This volatility directly impacts commercial processing margins. Therefore, utilizing advanced futures contracts is not optional; it is essential. Strategic hedging forms the absolute bedrock of sustainable agricultural business models today.
Management Strategy and Market Anticipation
Effective agricultural management demands relentless forward-looking analysis. Traders expect near-term technical support to hold for corn. December corn futures retain a strongly bullish technical posture. Prices remain well above key long-term chart support levels. Astute management teams anticipate potential tests of the $5.00 resistance level. They closely monitor extended weather forecasts and USDA reports. Managers must instantly adapt strategies based on these shifting variables. They cannot rely on historical precedent in unprecedented times. Assertive leadership is required to navigate this extreme market volatility profitably.
Science and Data-Driven Yield Forecasts
The agricultural sector relies heavily on scientific data analysis. Analysts closely monitor critical yield data from field tours. For example, recent crop tours projected lower spring wheat yields in North Dakota. These scientific assessments frequently contrast with earlier USDA forecasts. The market reacts violently to these data discrepancies. Data science models attempt to quantify the exact impact of drought on pod-setting. This scientific approach is crucial for accurate futures pricing. The market constantly digests massive datasets regarding soil moisture and heat indices.
Economics of Export Demand
The fundamental economics of supply and demand always dictate long-term trends. U.S. corn export sales are currently posting mixed weekly results. However, they remain on a record pace for the old-crop year. Strong international demand, particularly from Mexico, supports the market. New-crop sales have also surprisingly doubled recent expectations. Total sales commitments already exceed the USDA's full-year forecast. This robust demand profile clashes aggressively with tightening supply forecasts. This economic reality creates a highly combustible environment for futures prices.
Conclusion
Corn futures currently navigate a perfect storm of bullish catalysts. The undeniable war premium collides violently with severe weather threats. High temperatures and drought conditions jeopardize crucial U.S. yields. Geopolitical instability continues to threaten global supply chains relentlessly. The introduction of targeted financial instruments highlights the need for precise risk management. Strong export economics further support elevated pricing structures. Market participants must aggressively adapt to this high-volatility environment. Until weather patterns normalize or geopolitical tensions ease, the bulls remain in control.
In-depth trading ideas
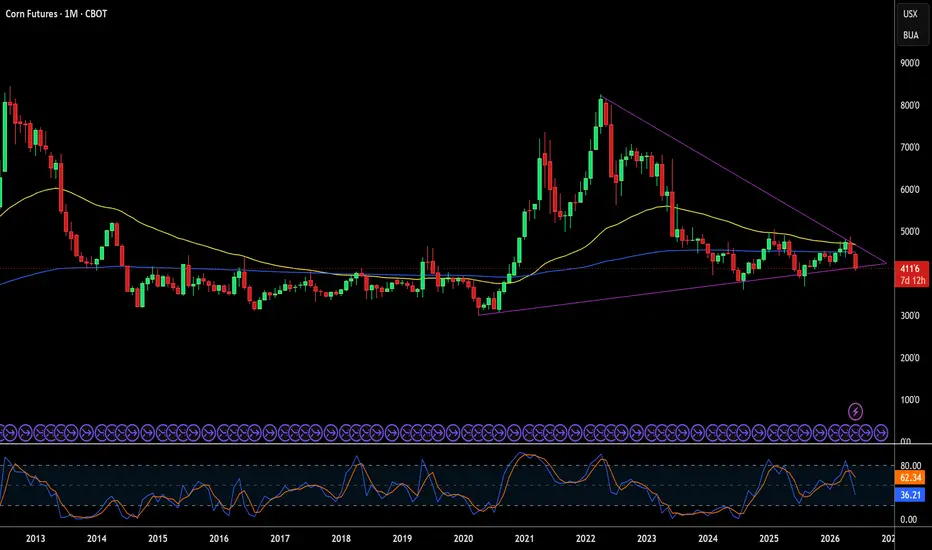
CORN FUTURES ....Anyone Interested ???The reason why i am getting interested with the Grains is : Fertilizers have double in price and the majors producers GCC countries ships are still not going through Hormuz...coming September harvesting figures could produce a surprise...and technically speaking ...just look at the chart .
DXY & REAL YIELD IMPLICATIONS
DXY 100.93, real yield 2.255% — mid-range, no directional extreme. Dollar softness would be constructive for BCOM broadly (125.62) and export competitiveness; a hawkish minutes surprise lifts both DXY and real yields, pressuring grain complex via macro correlation even against a firm crop-condition backdrop. Watch DXY/real-yield reaction Wed as the dominant cross-asset filter into WASDE Friday. LIQUIDITY MAP : TPO: Single prints 432.4/452.2 — price currently sits between; 432.4 becomes first support/inefficiency to revisit on pullback, 452.2 is the next upside magnet/resistance shelf. Poor High/Low 403.6/459.4 — both unresolved, longer-dated liquidity pools; 459.4 poor high is the higher-timeframe draw if breakout sustains. Weekly POC 437.6 sits just under spot — value area migrating up, POC now first line of defense on any retracement. Prior Weekly POC 411.6 is stale/left behind — confirms upward value migration. WYCKOFF / MARKET PROFILE
Structure resembles a Spring/test sequence off the 403.6–406.2 low cluster (poor low + weekly low confluence), now in markup phase testing the weekly 55 EMA and migrating POC. Volume/velocity divergence (see KMCM below) suggests the current push is running hot relative to the daily balance — classic early-markup vs. UTAD risk if 452.2 rejects on declining effort-to-result. USDA Crop Progress — released Monday, July 6, 2026 (as of Sunday, July 5)
Corn:
Good/Excellent: 67%, steady w/w
Silking: 16% (behind average pace)
Dough stage: 3%
Weather flag: wide-ranging week — heat + flooding in parts of the Belt, full impact may not show until next week's read given survey cutoff timing YoY context: this week last year corn was rated 74% G/E (steady-to-improving into July). Current 67% is a 7-point YoY deficit — meaningfully behind last year's pace despite this year's rating holding flat rather than declining. That gap is the more price-relevant data point than the flat w/w print itself: tighter crop-quality trajectory into pod/dough-fill season is a incremental bullish input for the WASDE July 10 yield assumption, especially if the flood/heat stress flagged this week shows up as a downgrade in next Monday's report. TRADE LOCATION & INVALIDATION
Long continuation:
Entry zone: 437.6 (POC) – 432.4 (single print) on retracement
Target 1: 449.2 (monthly high) | Target 2: 452.2 (single print) | Stretch: 459.4 (poor high)
Invalidation: close back below 427.0 (weekly high, now support) — structure failure
Fade/short (tactical, counter-trend):
Entry: 449.2–452.2 resistance confluence
Target: 440.0 → 437.6 POC
Invalidation: sustained close above 452.2 Net skew constructive: BOS confirmed on daily/weekly, Managed Money covering shorts, 6M COT elevated but 36M neutral (no extreme to fade). Primary risk is the daily/4H KMCM divergence — don't chase strength above 449–452 without a POC retest first.
CORN FUTURES Up Date....Macro has actually become more difficult for grains.
Negative factors :
DXY above 100
Real Yield above 2.25%
Bloomberg Commodity Index continues weakening ...Normally this combination argues against a sustained commodity rally.
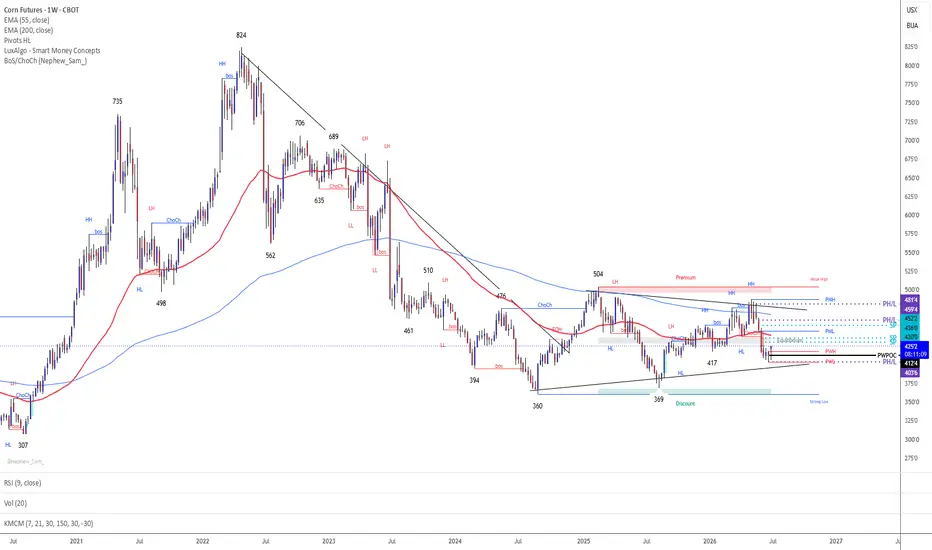
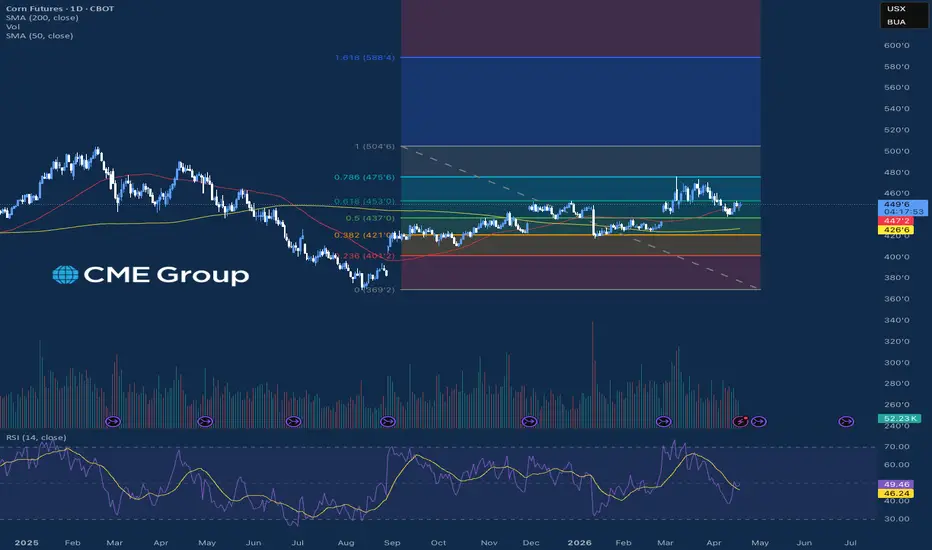
However... Corn has stopped falling.....That divergence deserves attention. Wyckoff Assessment : This week's chart looks much better.
Selling Climax : 369
↓
Automatic Rally : 488
↓
Secondary Test : 404
↓
Current : 424
That sequence resembles a classic accumulation structure more than ongoing markdown.
The key difference from few weeks ago: Price is no longer making new lows.
Instead:
Higher low
↓
Recovery above Weekly POC
↓
Building cause ....This is constructive. Scenario 1
🟢 Re accumulation continues
Targets:
430
436
449
480
Scenario 2
🟡 Large Elliott Triangle
Sideways contraction before a decisive move. 🔴 Wave 5 decline toward 369
Would require:
break below 404
break below 394
Wheat and Soybeans rolling over together
continued USD strength with worsening crop fundamentals. Today, I think the evidence has shifted.
The technical structure is gradually becoming more constructive: Managed Money has moved to a net-short posture.
Commercials continue reducing hedges.
Price has reclaimed the weekly value area after the 404 liquidity sweep.
The biggest obstacle is macro, not structure. A DXY at 100.94 and real yields at 2.263% are significant headwinds. If those begin to soften while Wheat and Soybeans continue leading higher—as previously observed—the probability increases that Corn is completing a re accumulation phase rather than preparing for another major markdown.
ZC - It’s CornCorn — it’s corn again, my favorite trade.
We’re right in the heart of pollination season (late June through mid-July), when U.S. corn silking typically surges — this week’s USDA Crop Progress report shows silking at 9% nationally (ahead of the 5-year average of 6%). At this stage, final yields remain highly uncertain because weather during pollination can still make or break the crop. That uncertainty drives classic FUD, and corn futures have already dropped sharply: December 2026 contracts recently hit 42-week lows near $4.00/bushel, with an ~8-9% decline over the past month alone. 
Historically, this seasonal window often sees price pressure as the market prices in “normal” conditions ahead of more concrete yield data. Studies and seasonal patterns confirm elevated volatility during pollination, followed by potential relief rallies once projections firm up. It’s been an easy 15-20% short opportunity in similar setups, and that move has largely played out. I haven’t had time lately for the in-depth or comical write-ups like I used to, so going forward these will probably be more dry and matter-of-fact, with bad mobile charts. Apologies.
From here, the play would be capturing the bounce off the FUD — another potential easy 10-15% — but stay cautious, as there’s usually a hiccup or spike during price discovery when fresh USDA reports (acreage, stocks, or yield projections) hit. Hot/dry forecasts in parts of the Corn Belt add another layer of near-term risk/reward. 
Cool beans. Happy Fourth, everyone. I’ll try to do this more often.
-kewlkat, think my wife found me.
What Is the Bean-Corn Ratio Signaling for 2026?The soybean-to-corn price ratio, November beans divided by December corn, is the row-crop producer's planting compass. A reading below about 2.4 signals that corn pays better per acre, while a reading above 2.6 tilts the math toward soybeans. For 2026, the ratio sits near 2.40, essentially neutral and just below its long-run average of 2.45, giving no clear edge to either crop. That is a meaningful change from 2025, when a low ratio favored corn and helped drive a near-record 95 million corn acres.
With the signal neutral, acreage is drifting modestly back toward soybeans rather than swinging hard in either direction. USDA projects 2026 corn plantings down about 3.7 million acres to roughly 94 million, and soybeans up nearly 4 million to around 85 million, as new-crop corn prices fail to compete on profitability. So the shift the ratio is driving this year is a mild rotation, not the dramatic reallocation the headline numbers might suggest.
The bigger story for corn is margin pressure. The 2026/27 season-average price is forecast near $4.20 a bushel, below the roughly $5 break-even, leaving many growers underwater even after input costs eased from their peaks. Record 2025 production left heavy carryover stocks, and although 2026/27 output is projected down about 7% to 15.8 billion bushels, ample supply still caps the upside. The forces that could actually lift prices sit on the demand side: ethanol policy and the push for E15, export pace and Chinese buying, and the outcome of USMCA negotiations.
The honest read is that the bean-corn ratio matters, but in 2026 it is sending a quiet signal rather than breaking markets. Near 2.40, it is nudging acreage toward soybeans without forcing a dramatic swing, and corn's real problem is structural: prices below break-even, large stocks, and demand that needs a catalyst. For investors, corn this year is a range-bound, demand-and-weather story. Watch the ratio for the 2027 planting tilt, but watch ethanol policy, export pace, and summer weather for what actually moves the price between now and harvest.
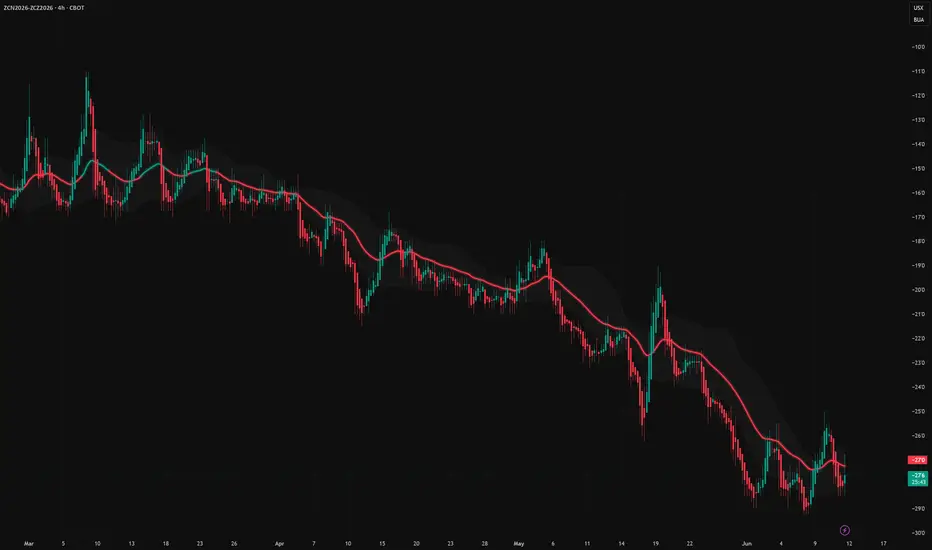
Momentum Shift with Nova Flow FreeNova Flow Free provides a clean visual read of momentum shifts and structure transitions.
It’s the basic version of the NovaQuantX system, offering clarity and early rotation detection without overloading the chart.
Advanced versions (Core & Sniper) include multi‑mode logic, deeper filtering and enhanced structure mapping, available privately.
On ZCN2026‑ZCZ2026 (4H), the tool helps highlight mid‑term trend rotations with precision.
Free version available on my profile.
CORN FUTURES ...Up DateCORN FUTURES
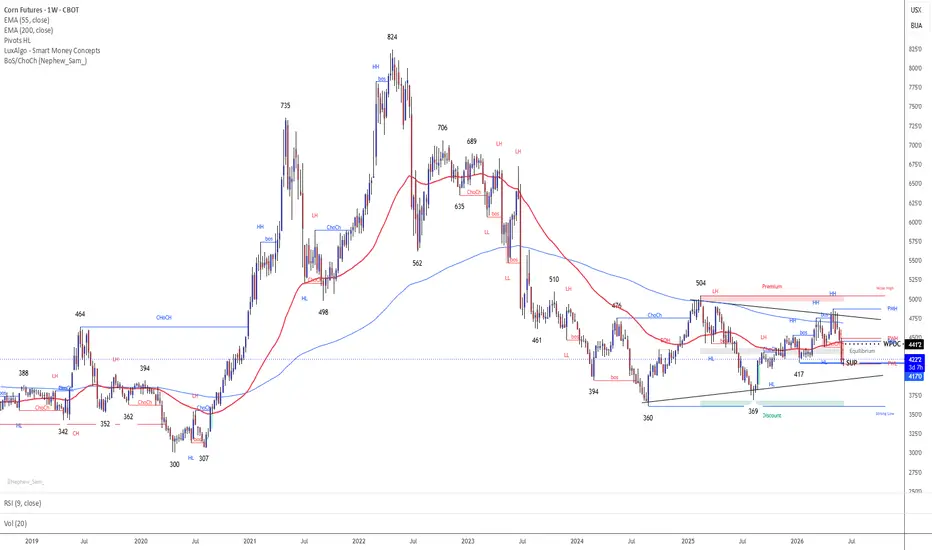
Wyckoff / Market Profile
The current structure is either:
Scenario 1 — Reaccumulation If 417 holds and price reclaims 436/441:
369 = Selling Climax
488 = Automatic Rally
417/420 = Secondary Test / LPS candidate
Scenario 2 — Markdown continuation
If 417 fails:
488 was distribution high
420 is only temporary pause
next liquidation targets are 394 and 369.
Weekly POC at 441.2 is the key auction magnet. Below it, auction remains bearish. Above it, repair toward 452–459 becomes likely.
Trade Location & Invalidation
Long setup
Only attractive if:
417 holds
reclaim 430.2
acceptance above 436
ideally reclaim 441.2 WPOC
Invalidation:
Daily close below 417
stronger invalidation below 394
Short setup
Better after weak bounce: 436–441 rejection
or 452–459 rejection
Invalidation:
strong acceptance above 459.4
stronger bullish confirmation above 488
Probability Ranking
1) Base case — Bounce attempt from 417/420
45% probability
Target: 430 → 436 → 441.2
2) Bearish continuation
35% probability
Trigger: clean break below 417
Targets: 394 → 369
3) Reaccumulation triangle confirmed
20% probability now
Needs: reclaim 441.2, then hold above 417 on the next pullback.
Bottom line: Corn is no longer a clean short at 420.6. The bearish move has already delivered. Now the market is at a tactical decision zone: 417 must hold for the triangle/reaccumulation thesis.
CORN FUTURES transitioning from “euphoric expansion” .....CORN FUTURES is transitioning from “euphoric expansion” into “distribution / liquidation risk” and the macro backdrop has become materially more bearish for grains. Current Market Context
Corn: 464.6
DXY: 99.32
Real Yield: 2.13%
Bloomberg Commodity Index: 139.68
COT: 6M Index: 24.9% / 36M Index: 17.8% REAL YIELD 2.13% ....This changes the macro environment materially......real yields are becoming restrictive for commodities.
Historically: high real yields pressure grains, tighten liquidity, reduce speculative appetite
Especially with: DXY above 99 Bloomberg commodity index weakening DXY 99.32 = MACRO HEADWIND This matters more than most grain traders realize.
A stronger dollar: pressures export competitiveness,weakens global purchasing power, tightens commodity liquidity
Corn struggling while DXY strengthens confirms: macro pressure is beginning to dominate. The key structural shift
Previously: Clean HH/HL sequence
Now: Failure to sustain above highs
breakdown back below:
PWH, equilibrium transition
That suggests: Distribution may already be underway.
Important Levels Now ...Immediate resistance: 469–476 This zone is now critical. If corn cannot reclaim it strongly:
👉 downside pressure increases.
Major support: 459.2 (single prints) This level is extremely important now.
Single prints often act as: repair magnets acceleration zones
Near-term: On the downside
Bearish / corrective bias dominant
Key trigger: Failure below: 469–476
Downside targets: 459 → 452 → 438 → 417
ZC Short — $ZCN26 breakdown below 417 keeps the bear trend in coHTF structure is decisively bearish with price extended below the major averages and printing fresh lower lows. The LTF broke the 419.25-420 support shelf on expanded volume and is now making a weak bounce back near the breakdown area. A sell stop at 417.00 only triggers if sellers continue through the new low; stop sits above the failed-breakdown/reclaim zone near 421.25, with 410.00 as the next downside extension/round-number target.
📍 Entry: 417.00
🛑 Stop: 421.25
🎯 Target: 410.00
⚖️ R:R: 1.65
ZC Corn: Key Inflection at 455 as Trade Winds ShiftMacro Crosscurrents Competing for the Wheel
Corn markets have been pulled in multiple directions over the past month. The single biggest fundamental development came out of Beijing on May 14, 2026, when President Trump and President Xi met for a high-stakes summit that produced a headline agricultural deal. The White House confirmed that China agreed to purchase at least $17 billion annually in US agricultural goods for 2026, 2027, and 2028, on top of the soybean commitments Beijing made at the October 2025 South Korea summit. Prior to the summit, Bloomberg reported that Chinese officials and US counterparts were actively in discussions to specifically include corn, sorghum, and distillers dried grains in the purchases, not just soybeans. That pre-summit chatter was enough to send corn futures above $4.70 per bushel on May 18, as the USDA reported corn export commitments as of April 30 had already surpassed the 3-billion-bushel mark, running 29% ahead of the same point in 2025.
The initial rally faded almost as quickly. When the actual summit details emerged, the language around corn volume, timing, and product breakdown was thin. China began making modest purchases of US wheat and sorghum in the days following, but significant corn bookings have yet to materialize at scale. Corn futures retreated as the market digested the gap between headline ambition and concrete volumes.
The May 12 WASDE (WASDE-671) complicated the fundamental picture further. USDA projected 2026/27 US corn production at 16.0 billion bushels, down 6% year-over-year, with planted area falling to 95.3 million acres and yield estimated at 183 bushels per acre. Ending stocks are projected to drop to 12.1% of use, the lowest ratio in recent averages, pushing the farm-level price forecast 25 cents higher to $4.40 per bushel. Global corn stocks are simultaneously forecast to fall to a 13-year low of 277.5 million metric tons. Export commitments for 2026/27 are forecast at 3.15 billion bushels, down 150 million from the current-year record pace. On paper, these numbers tilt fundamentally constructive, but the market has been slow to fully price the tighter balance sheet because weather-driven yield uncertainty and Chinese purchasing follow-through are the real unknowns.
On the geopolitical front, the US-Iran situation is at an inflection point of its own and cannot be ignored for corn. A ceasefire brokered in early April by Pakistan has held unsteadily, with both sides conducting continued strikes. As of May 25, US and Iranian negotiators have developed a framework to extend the ceasefire 60 days and reopen the Strait of Hormuz, which had been disrupted since the conflict escalated in late February. The Strait closure has kept energy prices elevated and fertilizer costs high throughout the spring planting window. Urea Gulf FOB prices spiked sharply in early March and have remained at elevated levels, with farmers effectively paying around 145 bushels of corn per ton of urea versus roughly 125 bushels at the height of the 2022 fertilizer shock. A durable resolution that allows the Strait to reopen fully would ease fertilizer and fuel cost pressure, but it could also remove a key fear premium that has underpinned grain prices since the war began. Watch this carefully, as a credible reopening announcement would be a bearish catalyst for energy-linked agricultural inputs while simultaneously improving farmer margins on the new crop.
Context - What the Market Has Done
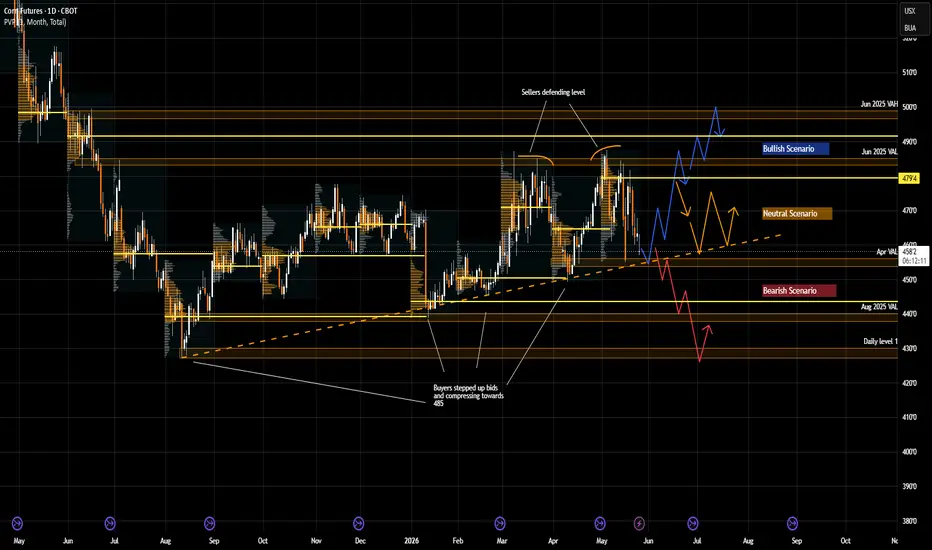
Since August 2025, the market has been steadily stepping up bids and compressing toward the 485 level, which aligns with the June 2025 VAL and Daily Level 1 area.
Buyers have repeatedly attempted to auction above 485, but price has continued to remain capped below that region as responsive sellers defend higher value.
More recently, the market has bee
Current price action continues to reflect a balanced rotational environment rather than directional acceptance, with both buyers and sellers remaining active within established value.
The inability for sellers to drive sustained acceptance below 460 has kept downside momentum limited despite larger projected supply expectations from USDA.
What to Expect in the Coming Weeks
The key level to watch is 455 (Apr VAL / Ascending Trendline).
Bullish Scenario
If buyers are able to continue defending above 455, expect continuation higher toward the 485 area near the June 2025 VAL.
Responsive sellers are expected to remain active near 485. However, if sellers fail to respond aggressively and buyers are able to sustain acceptance through June 2025 value, expect continuation toward 491 at the June 2025 VPOC.
Above 491, the next major upside target becomes the 500 area near the June 2025 VAH.
A potential macro trigger for this scenario would be China making large, specific corn purchase announcements with confirmed volumes and shipment schedules, or a failed Iran deal that keeps fertilizer costs elevated and further pressures projected US acreage below USDA expectations.
Bearish Scenario
If buyers fail to defend 455, expect the market to auction lower toward 443, which aligns with the January 2026 VPOC.
Below 443, the next downside target becomes 438 near the August 2025 VAL.
If sellers remain aggressive and buyers fail to respond meaningfully at 438, expect continuation lower toward 430 , which is the prior swing low / Daily level 1.
A potential macro trigger for this scenario would be the Strait of Hormuz reopening credibly under a durable US-Iran deal, sharply reducing energy and fertilizer cost support, combined with China failing to follow through on corn-specific purchases beyond the initial headline commitments.
Neutral Scenario
If buyers respond from 485 but fail to bid prices back up to 485 on the rotation up, expect the market to coil and compress as buyers continue to step up bids from the lower end while sellers step down offers from the upper end, tightening the auction area progressively.
The current backdrop supports this scenario well. The US-Iran ceasefire remains fragile and unresolved, and Chinese corn purchases are trickling in at a modest pace, neither confirming nor denying the demand thesis. Without a clear directional catalyst, the market has little reason to break out of its range with conviction.
This compression within the range sets up for a more decisive resolution when a confirmed catalyst emerges, either from the US-Iran situation or from confirmed China purchase volumes with specifics attached.
Conclusion
ZC corn sits at a genuinely important juncture where the fundamental picture and the technical structure are telling a similar story. The tighter USDA balance sheet for 2026/27, record-pace export commitments, and elevated fertilizer costs from the Middle East conflict all argue for a constructive underlying tone. At the same time, a large-scale China corn deal remains incomplete in its specifics, the Iran ceasefire framework could shift energy and input costs sharply in either direction, and the WASDE's projection of 3.15 billion bushels in 2026/27 corn exports still represents a step down from the current-year record, flagging that demand growth is not guaranteed. The 455 level is where it all gets decided in the near term. A hold above 455 opens the door back to 485 and potentially 500. A break below 455 would negate the ascending structure and expose 443, 438, and 430 in sequence. The Strait of Hormuz negotiation outcome and the pace of China's actual corn bookings in the coming weeks are the two macro variables worth tracking as closely as the price action itself. Are you positioned for the breakout, or waiting for confirmation at 455?
Disclaimer: Past performance is not necessarily indicative of future results. Trading futures involves substantial risk of loss and is not appropriate for all investors. This content is intended for informational and educational purposes only and does not constitute trading advice or a solicitation to buy or sell any futures contract. Trade your own plan and manage risk.
Acronyms:
C - Composite
w - Weekly
m - Monthly
VA - Value Area
VAH - Value Area High
VAL - Value Area Low
VPOC - Volume Point of Control
LVN - Low Value Node
LVA - Low Value Area
HVN - High Value Node
HVA - High Value Area
SP - Single print
ATH - All time high
ZC Long — $ZCN26 pulling back into demand shelf at 475-476 withiSetup: On the 4h, ZC has reversed the early-April low (~448) and is now trending in a clean sequence of higher lows and higher highs, currently testing the 480 area for the first time since mid-March. The 1h chart shows an intraday pullback from the 479–480 supply zone during the Apr 30 session, finding support near 474–475.5 — the prior Apr 28–29 breakout shelf and a natural demand cluster. The most recent 1h bars (Apr 30 overnight and May 1 pre-open) are consolidating in that 474.5–478.5 band with reduced volume, consistent with a healthy pause rather than distribution. The May 1 open bar (07:00) dipped to 475.75 and recovered toward 479–480, and the latest bar printed 480.0 close, suggesting the dip is being bought.
Flow: Corn is up +1.05% on the session with elevated volume and a 20-day outsized move, confirming managed-money or commercial participation in the rally. Broad ag complex strength (feeder cattle also bid) alongside soft DXY and risk-on tape reinforces the macro tailwind. No energy drag bleeds into grains; if anything, the dollar softness is a net positive for dollar-denominated commodities.
Plan: Stop is placed below the Apr 30 intraday low cluster near 471.25–472, which was the low of the heaviest-volume session before the bounce — a close below there structurally breaks the bullish wave count and invalidates the demand shelf. Target is the 482 area, the next visible supply shelf from early March highs and a logical measured extension of the current leg. TTL is moderate; price has already partially recovered so a fill near 475.5 may come quickly on any minor revisit.
📍 Entry: 475.50
🛑 Stop: 472.00
🎯 Target: 482.00
⚖️ R:R: 1.86
Grain Markets Starting off Q2The grain futures markets for corn, soybeans, and wheat are currently in a sideways pattern as traders balance massive supply buffers against new-crop planting uncertainties. In April 2026, the market is grappling with a heavy supply overhang from the record-breaking 2025 harvest, which has kept prices for corn and wheat near the $4.50 and $6.00 levels, respectively. While corn prices have seen occasional support from rallying wheat markets, the overall sentiment remains cautious due to the USDA’s April reports showing ample ending stocks, projected at over 2.1 billion bushels for corn. This surplus acts as a heavy lid on price rallies, leaving retail traders to watch for weather-related "planting scares" or geopolitical shifts in the Middle East to provide any significant upward momentum.
For soybeans, the focus has shifted toward a recovery in acreage, with 2026 planted area forecast to rise to roughly 85 million acres as farmers rotate back from corn. Despite this increase in potential supply, the soybean complex has remained relatively range-bound near $11.80 per bushel, supported by robust domestic crush margins exceeding $3 per bushel. Wheat markets have shown the most recent volatility, with dry conditions in the southern U.S. plains and tensions in the Persian Gulf injecting a "risk premium" into the spring trading cycle. As the 2026 growing season begins, the basis is firming up in some regions, suggesting that while the global supply is high, producers are hesitant to sell at these multi-year lows until the new crop is safely in the ground.
If you have futures in your trading portfolio, you can check out on CME Group data plans available that suit your trading needs tradingview.com/cme/
*CME Group futures are not suitable for all investors and involve the risk of loss. Copyright © 2023 CME Group Inc.
**All examples in this report are hypothetical interpretations of situations and are used for explanation purposes only. The views in this report reflect solely those of the author and not necessarily those of CME Group or its affiliated institutions. This report and the information herein should not be considered investment advice or the results of actual market experience.
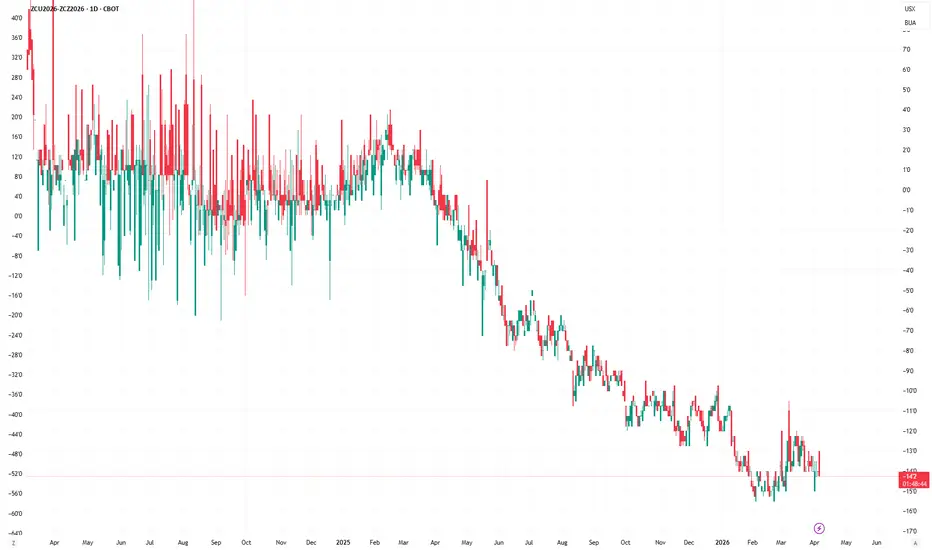
Corn Sep/Dec Spread AnalysisMost traders watch the Corn outright chart.
I prefer to look at Intramarket spreads between delivery months.
Current Sep/Dec Corn spread: ~-14'2
→ Clear contango/carry structure
→ December priced stronger than September
Why spreads matter:
1. **Seasonal Context**: Pre-harvest pressure typical for August
2. **Old Crop**: Stocks-to-use % → relatively tight
3. **New Crop**: Planting 95% complete, weather OK
The spread itself tells more about market structure, carry, and seasonal transitions than the flat price alone.
Corn - Next one to be squeezedWhat is the largest input cost for corn production? -> Nitrogen
Where do we get it from? -> Gas production
Urea price range has already reached 600-660 $ range. Guess what happens if this goes above 700 $?
Add general energy crisis effects (cost inflation, transportation, etc.), and you have the setup for a perfect inflationary storm in food and agri products. Especially for corn, which is the most nitrogen based pesticide dependent crop.
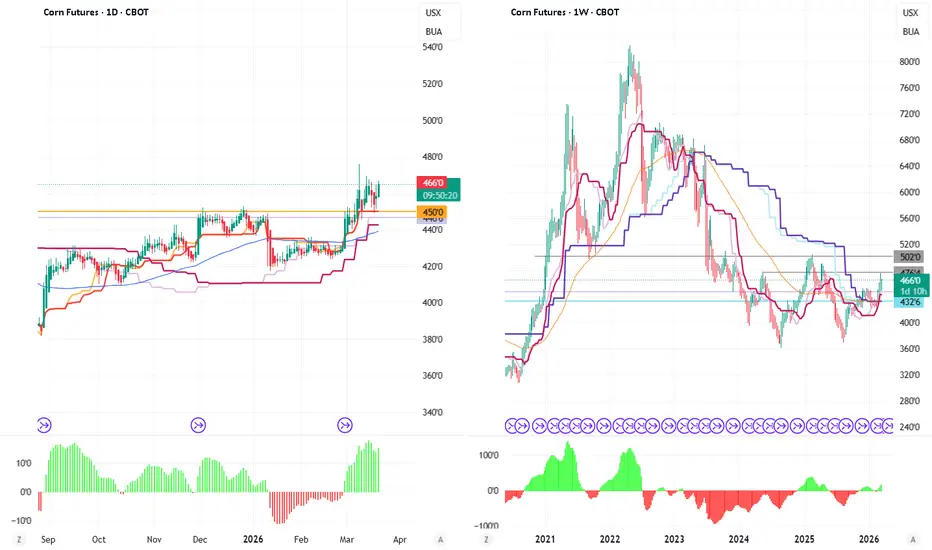
Now look at technical setup and potential targets.
Daily:
- Bullish trend, price is above daily and weekly Kijun Sen lines.
- Heikin-Ashi buy signal from support
Weekly:
- double bottom formed
- bullish bias
- price is above weekly and monthly Kijun Sen lines
First weekly resistance is around 475, second weekly resistance and potential first target on Daily is 502. A close above this level would open space to 600-700 zone.
If you feel you missed the Oil rally, keep your eye on this, as I think it has an extremely good risk/reward to play long.
When Trends Are Young: A Framework for Maximizing Reward-to-RiskContext: Why Early-Stage Trends Matter
Market trends are not static phenomena. They evolve through phases, each offering very different structural characteristics from a risk management perspective. One of the most overlooked distinctions is where a market sits within its trend lifecycle. Early-stage trends often differ meaningfully from mature or exhausted ones, particularly in how risk and potential reward are distributed.
This article presents an educational framework focused on early-stage trend participation, emphasizing how objective trend identification, structural entries, and distant reference targets can combine to create asymmetric reward-to-risk profiles. The discussion is not outcome-focused. Instead, it centers on how trade structure influences expectancy, consistency, and overall risk efficiency.
Identifying Trend Direction with Objective Rules
Trend direction is the foundation of this framework. Rather than relying on subjective interpretation, this case study uses the Supertrend indicator as an objective method for defining directional bias.
Supertrend operates by:
Establishing a directional state (uptrend or downtrend)
Providing a dynamic invalidation level
Adjusting as volatility and price structure evolve
In the scenario examined here, Supertrend transitions into a newly established downtrend. This transition is significant because early trend phases often present:
Limited structural opposition
Cleaner directional flows
Greater potential for price exploration before encountering major support zones
The goal is not to anticipate how far price will move, but to recognize when the conditions for favorable trade geometry are present.
Trade Structure: From Breakout to Invalidation
With directional bias defined, attention shifts to how a trade is structured, not whether it is taken.
The proposed framework engages the market at a breakout point aligned with the downtrend, rather than attempting to fade or counter the move. This alignment simplifies decision-making and ensures that:
Entry is consistent with prevailing momentum
Risk is defined by structure rather than emotion
In this case study:
Breakout level: 425’2
Initial Supertrend invalidation: near 450
Adjusted stop location: 440’6
The adjustment of the stop reflects a practical consideration: stops placed exactly at indicator levels are often vulnerable to short-term volatility. By slightly refining the stop location, the structure remains intact while reducing the likelihood of premature invalidation.
Targeting with Relevant Supports
Targets are often the weakest element of trade design. Arbitrary price objectives or fixed multiples can disconnect a trade from actual market structure.
This framework instead uses a UFO Support (UnFilled Orders) as a reference point. UFOs represent areas where price previously moved too quickly to facilitate meaningful two-sided trade, leaving behind potential zones of future interaction.
In trending environments, especially early-stage trends, price often seeks out these distant structural references.
For this case study:
Support zone: 382
This level is significantly removed from the entry point, not because of optimism, but because:
The trend is in an early phase
Structural support has not yet been tested
There is limited evidence of opposing accumulation at higher levels
The result is a target derived from market structure, not projection.
Reward-to-Risk Expansion: The Core Advantage
With all components defined, the reward-to-risk profile becomes clear:
Entry: 425’2
Stop: 440’6
Risk: ~15’4 points
Target: 382
Potential reward: ~43.2 points
This produces a reward-to-risk ratio of approximately 2.8:1.
The significance here is not the number itself, but how it is achieved:
Without tightening stops unrealistically
Without extending targets arbitrarily
Without predicting future price behavior
Early-stage trends naturally allow reward-to-risk expansion because risk is defined nearby, while structural references may exist far away. Over time, such asymmetry can:
Improve trade expectancy
Reduce reliance on high win rates
Enhance risk-adjusted performance metrics
Application to Futures Markets
This framework is applied using corn futures (ZC) as a case study. The analysis itself is performed on the standard futures contract due to its liquidity and structural clarity. However, the same logic applies seamlessly to the micro futures contract (MZC), allowing for:
Finer position sizing
Greater accessibility
More granular risk control
Importantly, the analytical framework does not change with contract size. Only exposure does.
Contract Specifications Overview
Standard Corn Futures (ZC):
Contract size: 5,000 bushels
Minimum price fluctuation: 1/4 of one cent (0.0025) per bushel
Tick value: $12.50 per tick
Quoted in cents per bushel
Current margin requirement per contract: $975
Micro Corn Futures (MZC):
Contract size: 500 bushels
Minimum price fluctuation: 0.0050 per bushel
Tick value: $2.50 per tick
Designed to mirror the standard contract at reduced scale
Current margin requirement per micro contract: $97
Margin Requirements:
Initial and maintenance margins vary and are subject to change
Micro contracts typically require a fraction of the standard contract margin
Traders should always verify current margin requirements with their broker
These specifications highlight how the same structural idea can be expressed across different risk profiles.
Risk Management Considerations
Despite favorable reward-to-risk characteristics, early-stage trends are not inherently “safer.” Risk management remains central.
Key considerations include:
Predefining risk before trade entry
Adjusting position size rather than widening stops
Accepting invalidation quickly when structure fails
Understanding that no single trade defines performance
Reward-to-risk asymmetry does not eliminate losses; it reframes how losses are absorbed within a broader process.
Chart Walkthrough
The accompanying chart illustrates:
The Supertrend transition into a downtrend
The structural breakout point
The refined stop location
The distant UFO support zone used as a target reference
Each element serves a specific function within the framework. None rely on hindsight, and none assume future certainty. Together, they demonstrate how structure, not prediction, drives trade design.
Key Takeaways
Early-stage trends often provide superior trade geometry
Trend alignment simplifies decision-making
UFOs offer structurally grounded target references
Reward-to-risk expansion is a byproduct of structure, not optimism
Consistency is built through frameworks, not outcomes
Data Consideration
When charting futures, the data provided could be delayed. Traders working with the ticker symbols discussed in this idea may prefer to use CME Group real-time data plan on TradingView: www.tradingview.com - This consideration is particularly important for shorter-term traders, whereas it may be less critical for those focused on longer-term trading strategies.
General Disclaimer
The trade ideas presented herein are solely for illustrative purposes forming a part of a case study intended to demonstrate key principles in risk management within the context of the specific market scenarios discussed. These ideas are not to be interpreted as investment recommendations or financial advice. They do not endorse or promote any specific trading strategies, financial products, or services. The information provided is based on data believed to be reliable; however, its accuracy or completeness cannot be guaranteed. Trading in financial markets involves risks, including the potential loss of principal. Each individual should conduct their own research and consult with professional financial advisors before making any investment decisions. The author or publisher of this content bears no responsibility for any actions taken based on the information provided or for any resultant financial or other losses.
ZC1!China’s demand for agricultural commodities—especially soybeans and corn—is a direct function of the country’s “agricultural revolution,” characterized by a significant dietary shift toward animal-based foods. Per capita dairy consumption has skyrocketed from 3.1 kg in 1982 to 12.6 kg in 2025, a factor that drives the need for intensive livestock feed. This massive feed demand forces China to rely on imports, even as the government implements subsidy policies to boost domestic grain production.
U.S. corn is currently competitive (at times even cheaper than Brazilian corn in 2025 due to logistical bottlenecks at Santos). Additionally, there are no active anti-dumping duties on U.S. corn at the moment.
Breakout or Fake-Out? Corn Just Kissed Its Support!1. The Setup
Corn’s doing exactly what disciplined traders hoped for — pulling back to the same UFO support zone that powered the earlier wedge breakout. On the 8-hour chart, price just kissed that 418–411 area… a textbook retest where new buyers could reload the bushels.
2. The Context
We saw this coming. The initial breakout looked flashy, but the volume delta wasn’t convinced — it stayed soft. Now that price has tapped into the unfilled-order pocket, watch to see if the delta turns positive again. That’s the “ignition spark” that often separates real breakouts from fakes.
3. The Game Plan
The playbook hasn’t changed — only the timing has improved.
🎯 Entry idea: around 418 support
🛑 Stop: 411 (below the UFO zone)
📈 Targets: 430 and 442
⚖️ Reward-to-Risk ≈ 3:1
This is patience in action — waiting for the market to come to you instead of chasing it.
4. The Specs
ZC – Corn Futures: 5 000 bushels · Tick = ¼ ¢ ($12.50) · ≈ $1 000 margin
MZC – Micro Corn Futures: 500 bushels · Tick = ½ ¢ ($2.50) · ≈ $100 margin
Same analysis, smaller bite size — perfect for managing exposure while keeping precision.
5. The Takeaway
Volume shows what’s already been eaten; UnFilled Orders at support show what’s still on the table.
Corn just revisited the buffet — now we wait to see if buyers come back for seconds. 🌽🔥
Want More Depth?
If you’d like to go deeper into the building blocks of trading, check out our From Mystery to Mastery trilogy, three cornerstone articles that complement this one:
🔗 From Mystery to Mastery: Trading Essentials
🔗 From Mystery to Mastery: Futures Explained
🔗 From Mystery to Mastery: Options Explained
When charting futures, the data provided could be delayed. Traders working with the ticker symbols discussed in this idea may prefer to use CME Group real-time data plan on TradingView: www.tradingview.com - This consideration is particularly important for shorter-term traders, whereas it may be less critical for those focused on longer-term trading strategies.
General Disclaimer:
The trade ideas presented herein are solely for illustrative purposes forming a part of a case study intended to demonstrate key principles in risk management within the context of the specific market scenarios discussed. These ideas are not to be interpreted as investment recommendations or financial advice. They do not endorse or promote any specific trading strategies, financial products, or services. The information provided is based on data believed to be reliable; however, its accuracy or completeness cannot be guaranteed. Trading in financial markets involves risks, including the potential loss of principal. Each individual should conduct their own research and consult with professional financial advisors before making any investment decisions. The author or publisher of this content bears no responsibility for any actions taken based on the information provided or for any resultant financial or other losses.
Breakout or Fake-Out — Corn’s Price Action Under the Microscope1. When Breakouts Lie
Few things in trading are more exciting than a clean breakout. But for every breakout that soars, there’s another that fakes out and traps eager traders.
Corn Futures (ZC) on the 8-hour chart just gave us that classic test — a breakout from a falling wedge that has traders asking: Is this the real thing, or another false alarm?
The pattern looks textbook. Price compressed lower within a wedge and broke above its upper trendline. However, the true strength of any breakout lies not in the pattern itself, but in the story told by volume and order flow. That’s what we’ll unpack in this article — using ZC (Corn Futures) and MZC (Micro Corn Futures) as our guide.
2. The Falling Wedge in Focus
Falling wedges often represent market exhaustion, where selling pressure slows and buyers quietly begin to accumulate positions. On the Corn Futures 8-hour chart, price has indeed pushed beyond the wedge’s descending resistance line — the visual signal that usually excites breakout traders.
But structure alone doesn’t make a sustainable move. Beneath the surface, the UFO support and resistance levels — zones of UnFilled Orders — provide the invisible scaffolding that can support or reject price movement.
In this case:
Support Zone: 418–411
Resistance Levels: 430 and 442
These areas represent pending potential new support and resistance areas where buy and sell orders that can act as launchpads or barriers. The key is to see how the market interacts with them while volume builds or fades.
3. The Volume Delta Story
Here’s where things get interesting.
Volume Delta — the difference between buy and sell volume — shows us who’s winning the tug-of-war between buyers and sellers.
During the wedge formation, the maximum delta reached +1.05K, indicating meaningful buying activity despite the downtrend. But as the breakout unfolded, delta turned slightly negative. In plain terms, fewer new buyers are stepping in — and without new buying energy, breakouts often lose traction.
That’s a classic setup for a potential fake-out: price pokes above the wedge, but order flow doesn’t confirm. This mismatch between technical breakout and volume delta is often the canary in the coal mine for fading momentum.
4. The Trade Logic — Let the Market Come to You
Instead of chasing the breakout, the smarter play here could be to wait for the market to revisit demand/support.
Why? Because that’s where new volume tends to enter — where pending buy orders (the UFOs) become filled, strengthening the delta and giving the move fresh fuel.
A potential plan might look like this:
Entry: 418 (within support)
Stop-Loss: 411 (below the zone)
Target 1: 430 (first resistance, partial exit)
Target 2: 442 (final resistance, full exit)
This setup maintains a clear reward-to-risk ratio above 3:1, assuming disciplined execution and volatility-adjusted sizing. It’s not about prediction — it’s about preparation. Waiting for retracement allows participation in a confirmed move, rather than reacting to emotional excitement at the breakout.
5. Contract Specifications & Margin Requirements
Understanding your instrument is as important as reading your chart.
Here’s what traders should know about these CME-listed Corn contracts:
ZC – Corn Futures (Standard Contract)
Contract Size: 5,000 bushels
Tick Size: ¼ cent per bushel (0.0025) → Tick Value = $12.50
Approx. Margin: Around $1,000 USD, varying by broker and volatility
MZC – Micro Corn Futures
Contract Size: 500 bushels (1/10th of ZC)
Tick Size: ½ cent per bushel (0.0050) → Tick Value = $2.50
Approx. Margin: Around $100 USD, varying by broker and subject to market conditions
Micro contracts allow smaller-scale traders to apply the same analysis and structure as the full-size contract, but with controlled risk exposure — a major advantage for capital management.
6. When New Volume is Injected in the Market
Think of Volume Delta as a glance in the rear-view mirror — it tells us what’s already been filled. On the other hand, analyzing support and resistance levels with the idea of where new unfilled orders might come in helps us prepare to enter trades just before momentum potentially reactivates.
When both are combined:
Rising delta confirms a healthier follow-through on breakouts.
Negative delta near resistance warns of a likely fading move.
Key support and resistance zones show where resting orders could inject new volume.
7. Risk Management — Protect Before You Project
Every solid trade plan starts with a stop.
For this setup, a logical stop below 411 ensures protection if the wedge breakout fails completely.
Scaling out at 430 reduces exposure early, locking gains in case the move stalls.
Always size positions relative to account equity and volatility — the most underrated edge in trading is survival.
The best traders don’t just hunt profits — they hunt consistency. Managing risk transforms a potentially stressful market environment into a structured decision process.
8. CME Context & Final Thoughts
Both ZC and MZC are cornerstone agricultural contracts traded on the CME Group’s CBOT exchange, giving traders exposure to one of the world’s most economically significant commodities.
While the setup we’ve explored is a case study, the takeaway extends beyond Corn:
Breakouts need participation. Volume confirms conviction. Key support and resistance levels reveal intention.
In markets where fake-outs are common, aligning technical structure, order flow, and patient trade planning gives traders the clearest edge of all — confidence grounded in data, not emotion.
When charting futures, the data provided could be delayed. Traders working with the ticker symbols discussed in this idea may prefer to use CME Group real-time data plan on TradingView: www.tradingview.com - This consideration is particularly important for shorter-term traders, whereas it may be less critical for those focused on longer-term trading strategies.
General Disclaimer:
The trade ideas presented herein are solely for illustrative purposes forming a part of a case study intended to demonstrate key principles in risk management within the context of the specific market scenarios discussed. These ideas are not to be interpreted as investment recommendations or financial advice. They do not endorse or promote any specific trading strategies, financial products, or services. The information provided is based on data believed to be reliable; however, its accuracy or completeness cannot be guaranteed. Trading in financial markets involves risks, including the potential loss of principal. Each individual should conduct their own research and consult with professional financial advisors before making any investment decisions. The author or publisher of this content bears no responsibility for any actions taken based on the information provided or for any resultant financial or other losses.
Analysis techniques – Corn Futures (Dec 2025)Analysis techniques – Corn Futures (Dec 2025)
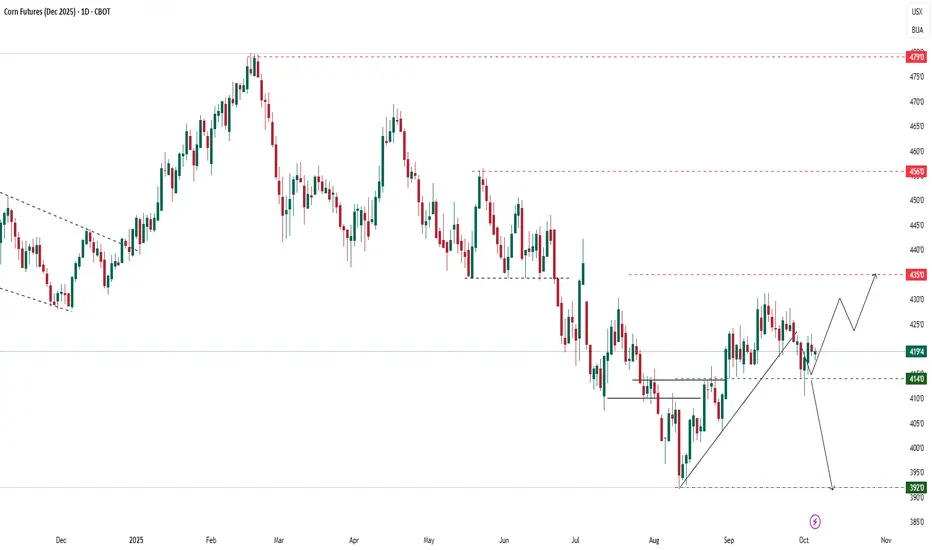
Date: Oct 06, 2025 | Timeframe: D1 | Contract Code: ZCZ25
1. Trend Overview and Price Structure
December corn futures (ZCZ25) traded around 4.194 USD/bu, moving sideways early this week after rebounding from the 4.14 support zone. The short-term structure remains slightly bullish but momentum is fading near 4.20–4.25.
Technically, the market is retesting its short-term uptrend line, awaiting confirmation for the next directional move.
2. Key Technical Levels
Resistance: 4.35 – 4.56 – 4.79
Support: 4.14 – 4.00 – 3.92
3. Detailed Technical Analysis
(1) Short-term trend:
The rebound from 3.92 has stalled near 4.20, the prior September peak. A decisive breakout above 4.22–4.25 would extend the recovery toward 4.35.
(2) Volume:
Volume has picked up modestly during the recent rebound, but speculative participation remains limited.
(3) Wave structure:
Corn may be forming a minor wave 3 of a corrective rally, targeting 4.35–4.56. A drop below 4.14, however, could trigger a deeper retracement toward 3.92.
(4) Confirmation signals:
A daily close above 4.22 confirms renewed bullish bias; failure below 4.14 negates the current recovery setup.
VNC View
In the short term, corn prices are supported by a softer USD and improved export sentiment, though profit-taking remains a headwind.
Medium term, U.S. harvest progress continues smoothly, but low global stocks and dry conditions in Brazil could offset supply pressure.
Overall, the outlook remains neutral-to-bullish, with key focus on the 4.14–4.22 reaction zone.
Analysis techniques – Corn Futures (Dec 2025)Date: 30/09/2025 | Timeframe: D1 | Contract Code: ZCZ25
1. Trend Overview and Price Structure
Corn futures (Dec 2025) are consolidating around 4,200 after a short-term pullback. Prices remain above the 4,140 support, keeping the recovery trend intact. However, bullish momentum needs a breakout above 4,350 to confirm a medium-term uptrend.
2. Key Technical Levels
Resistance: 4,350 – 4,560 – 4,790
Support: 4,140 – 4,000 – 3,920
3. Detailed Technical Analysis
Short-term trend: The uptrend structure is still valid, though mild corrections toward support are underway.
Trading volume: No breakout in volume, but demand remains steady near support.
Wave structure: An upward wave from the August low is unfolding, with 4,350 as the next target.
Confirmation signals: A daily close above 4,350 would extend the rally toward 4,560.
4. VNC Intelligence Strategic View
In the short term, corn is supported by improved export prospects as China resumes buying. Medium-term, however, abundant U.S. 2025 harvest supplies could trigger corrections toward 4,000 – 3,920. Overall, the trend is shaping into a “sideways-up” pattern with volatility near key levels.
5. Suggested Technical Strategies
Primary Long Setup:
Entry: 4,150 – 4,180
TP: 4,350
SL: 4,000
Probability: 65%
Short Setup on failed resistance test:
Entry: 4,330 – 4,350
TP: 4,140
SL: 4,420
Probability: 55%
6. Corporate Hedging Guidance
Importers may consider hedging on dips near 4,140 – 4,000. Conversely, U.S. farmers should lock in partial sales around 4,330 – 4,350 to secure profits, given ample post-harvest supply pressures.