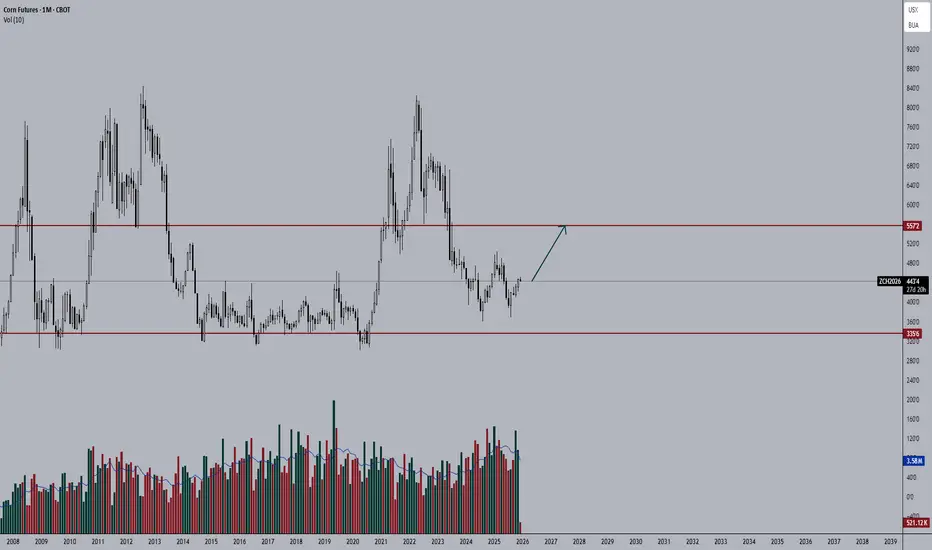
Will Corn Crush The Six-Dollar Ceiling By 2027?The corn futures market approaches a critical inflection point. Some market watchers see a path to $6 per bushel by early 2027. Recent technical charts reveal a bullish pattern of higher lows. December futures touched a three-year high just under $5.50 in early September. On September 11, the USDA revised its 2026 production forecast downward by 213 million bushels to 15.8 billion. Ending stocks fell to 1.57 billion bushels, pushing the stocks-to-use ratio below 10 percent for the first time in
In-depth trading ideas
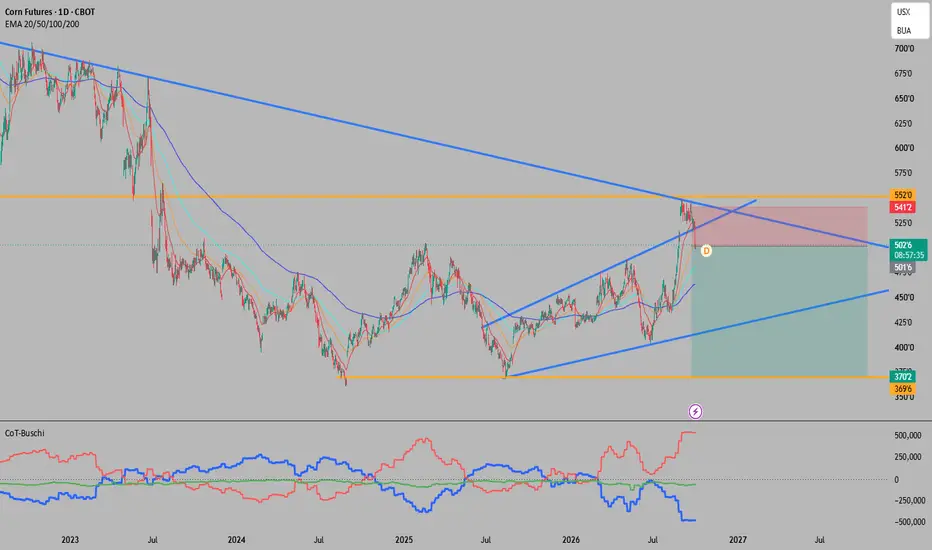
Corn: double top at 549, short below 525Corn rallied from the 456 August low to 549'6 in early September, about 20% in four weeks. The follow through never came. Price pulled back to the 525 area, rallied again into a lower high near 545 on September 22, and has now broken below the mid September swing low. That completes a double top on the daily swing chart, with the swing direction turned down.
Plan
Entry: 521'6, on the break of the 525 swing low. The trade is live.
Stop: 545'2, above the second top.
First profit taking: one thir
Commodities Are Outperforming AI StocksWhile many are still focusing on and hoping for AI stocks to resume their rally following the July meltdown, corn has gained 36% since June.
During this period, grains have already been outperforming AI stocks.
Many analysts will attribute the rise in commodities to supply, demand, and weather conditions.
But I believe the longer-term growth trend has already been set in motion, potentially preparing for its third impulsive wave.
And this is not just the usual supply, demand, or weather stor
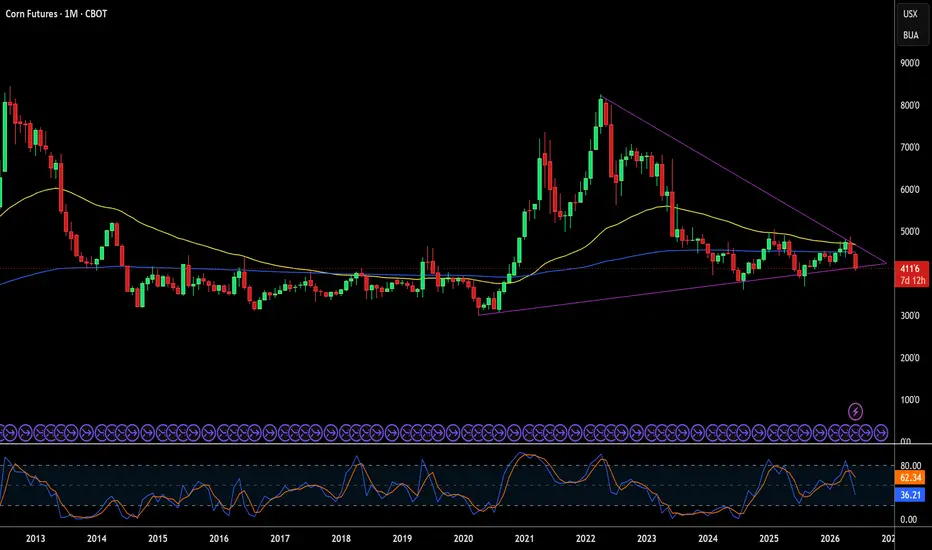
Corn Futures: Next Stop 630?Corn has rallied hard over the past couple of weeks, pushing to virtually 3-year highs on the weekly chart. Psychologically, it's tempting to assume a move like that is already "done" — but the chart says otherwise.
The setup: Beneath this rally sits a sizeable base, and measuring the apex of that triangle and projecting it from the breakout point gives an upside target of around 630. So while the move so far looks big, I don't think it's finished.
Where we are now:
The market has stalled on i
ZC1!China’s demand for agricultural commodities—especially soybeans and corn—is a direct function of the country’s “agricultural revolution,” characterized by a significant dietary shift toward animal-based foods. Per capita dairy consumption has skyrocketed from 3.1 kg in 1982 to 12.6 kg in 2025, a factor that drives the need for intensive livestock feed. This massive feed demand forces China to rely on imports, even as the government implements subsidy policies to boost domestic grain production.
The Confluence Principle in Smoothed Oscillator Desig● 🧠 The Conceptual Origin of Smoothed Momentum Trailing Systems
- The intellectual lineage of this framework traces back to a foundational problem in technical analysis: the raw oscillator, in its native form, is far too erratic to serve as a reliable directional arbiter. Classical momentum measures fluctuate violently on a bar-to-bar basis, generating a stream of noise that obscures rather than reveals the underlying directional current of a market. The conceptual innovation here lies in trea
Corn and El Niño: A Positioning DisconnectThousands of miles from the nearest cornfield, a shift in Pacific trade winds is becoming the pivotal swing factor for global corn prices into next year. Having previously outlined corn's underlying fundamentals and the broader mechanics of El Niño in our soybean report, we keep the background brief here and focus on what's different this time. NOAA issued an El Niño Advisory in June 2026, and by July, odds of it persisting through early 2027 had risen to 97%.
Forecasts still put the odd
Why Is Corn Soaring in Europe But Not the US?Corn is having two completely different years depending on which side of the Atlantic you trade it. Euronext corn futures in Paris just hit record highs above €250 a ton. Chicago corn, the world's benchmark, sits in a comparatively calm $4.40 to $4.50 a bushel range. Both markets are pricing the same crop. They are pricing two entirely different realities.
Macroeconomics: A Tale of Two Harvests
Europe's story is a supply shock. A historic heat wave, the worst since 1976 by some measures, has
Why Are Corn Futures Suddenly Surging Amidst Chaos?Macroeconomics and the War Premium
Corn futures recently hit fresh highs, pushing past $4.90 per bushel. This surge defies standard seasonal expectations. A significant driver is the undeniable geopolitical tension impacting global markets. A distinct "war premium" is currently inflating grain values. Escalating hostilities continually threaten critical supply chains. Grain markets remain acutely sensitive to international disruptions. Traders furiously price in potential supply shocks. Global
CORN FUTURES ....Anyone Interested ???The reason why i am getting interested with the Grains is : Fertilizers have double in price and the majors producers GCC countries ships are still not going through Hormuz...coming September harvesting figures could produce a surprise...and technically speaking ...just look at the chart .
DXY & REAL YIELD IMPLICATIONS
DXY 100.93, real yield 2.255% — mid-range, no directional extreme. Dollar softness would be constructive for BCOM broadly (125.62) and export competitiveness; a hawkish minutes s
CORN FUTURES Up Date....Macro has actually become more difficult for grains.
Negative factors :
DXY above 100
Real Yield above 2.25%
Bloomberg Commodity Index continues weakening ...Normally this combination argues against a sustained commodity rally.
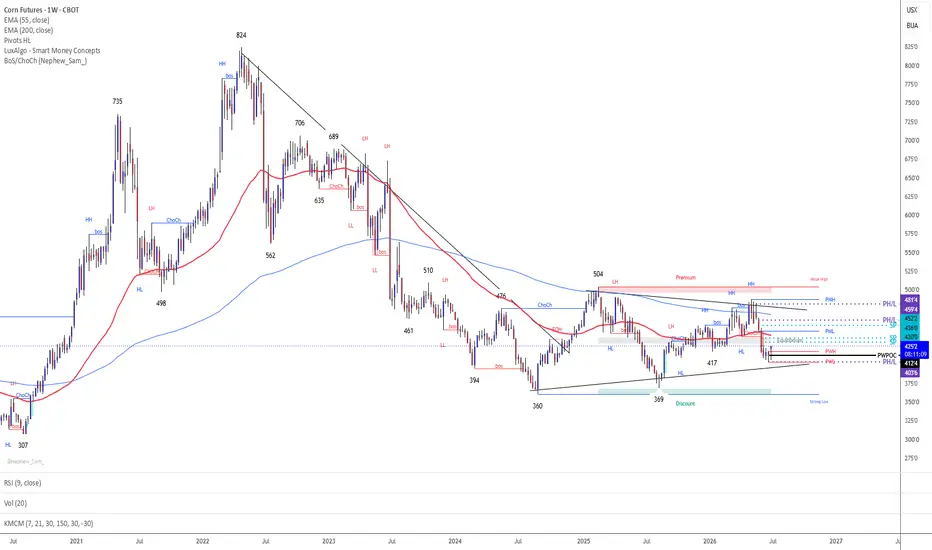
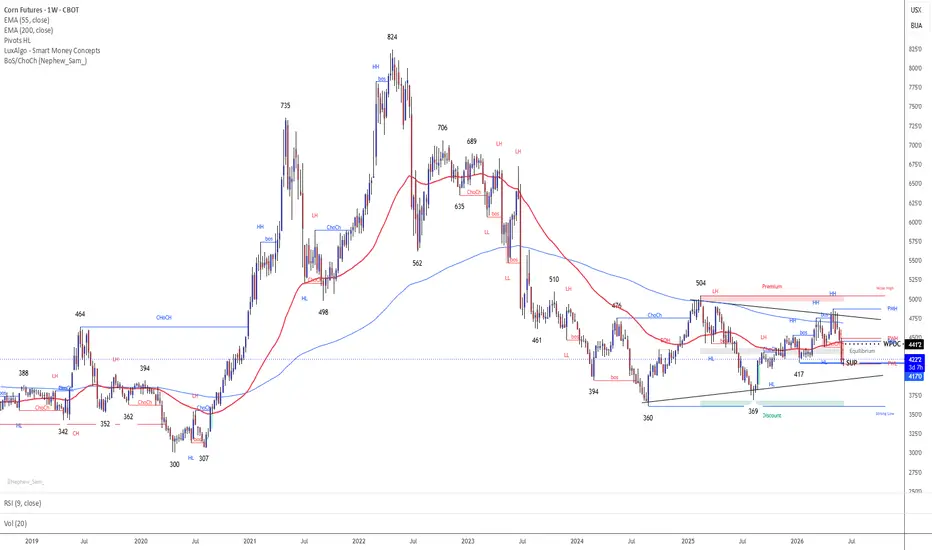
However... Corn has stopped falling.....That divergence deserves attention. Wyckoff Assessment : This week's chart looks much better.
Selling Climax : 369
↓
Automat
ZC - It’s CornCorn — it’s corn again, my favorite trade.
We’re right in the heart of pollination season (late June through mid-July), when U.S. corn silking typically surges — this week’s USDA Crop Progress report shows silking at 9% nationally (ahead of the 5-year average of 6%). At this stage, final yields remain highly uncertain because weather during pollination can still make or break the crop. That uncertainty drives classic FUD, and corn futures have already dropped sharply: December 2026 contracts re
What Is the Bean-Corn Ratio Signaling for 2026?The soybean-to-corn price ratio, November beans divided by December corn, is the row-crop producer's planting compass. A reading below about 2.4 signals that corn pays better per acre, while a reading above 2.6 tilts the math toward soybeans. For 2026, the ratio sits near 2.40, essentially neutral and just below its long-run average of 2.45, giving no clear edge to either crop. That is a meaningful change from 2025, when a low ratio favored corn and helped drive a near-record 95 million corn acr
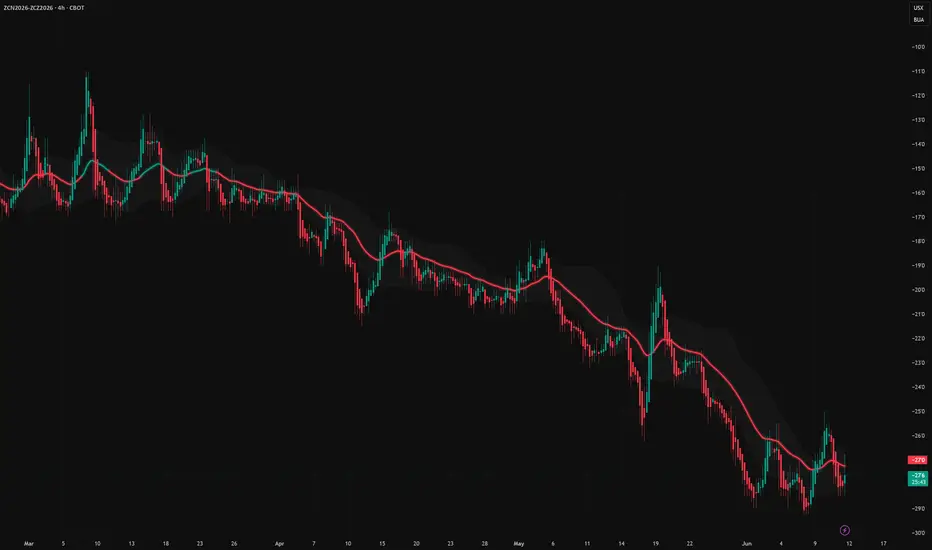
Momentum Shift with Nova Flow FreeNova Flow Free provides a clean visual read of momentum shifts and structure transitions.
It’s the basic version of the NovaQuantX system, offering clarity and early rotation detection without overloading the chart.
Advanced versions (Core & Sniper) include multi‑mode logic, deeper filtering and enhanced structure mapping, available privately.
On ZCN2026‑ZCZ2026 (4H), the tool helps highlight mid‑term trend rotations with precision.
Free version available on my profile.
CORN FUTURES ...Up DateCORN FUTURES
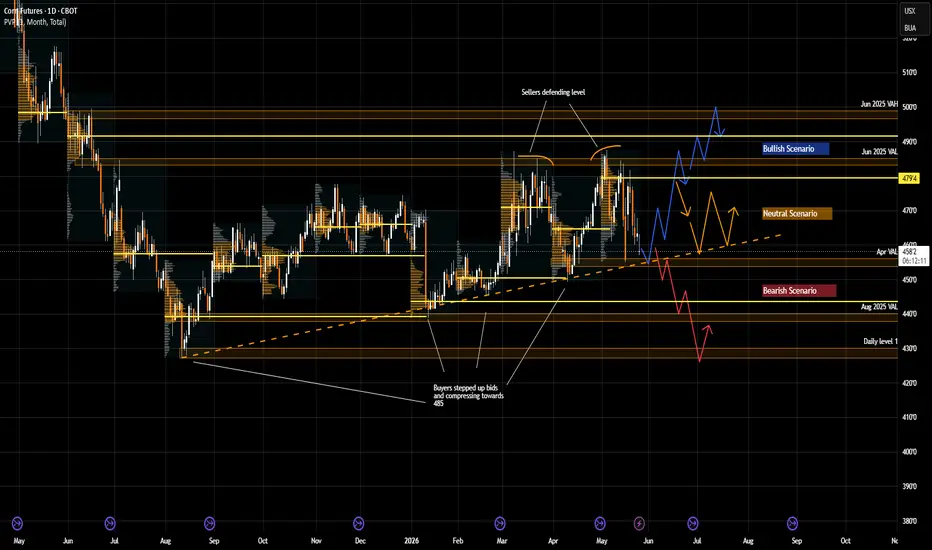
Wyckoff / Market Profile
The current structure is either:
Scenario 1 — Reaccumulation If 417 holds and price reclaims 436/441:
369 = Selling Climax
488 = Automatic Rally
417/420 = Secondary Test / LPS candidate
Scenario 2 — Markdown continuation
If 417 fails:
488 was distribution high
420 is only temporary pause
next li
CORN FUTURES transitioning from “euphoric expansion” .....CORN FUTURES is transitioning from “euphoric expansion” into “distribution / liquidation risk” and the macro backdrop has become materially more bearish for grains. Current Market Context
Corn: 464.6
DXY: 99.32
Real Yield: 2.13%
Bloomberg Commodity Index: 139.68
COT: 6M Index
ZC Short — $ZCN26 breakdown below 417 keeps the bear trend in coHTF structure is decisively bearish with price extended below the major averages and printing fresh lower lows. The LTF broke the 419.25-420 support shelf on expanded volume and is now making a weak bounce back near the breakdown area. A sell stop at 417.00 only triggers if sellers continue through the new low; stop sits above the failed-breakdown/reclaim zone near 421.25, with 410.00 as the next downside extension/round-number target.
📍 Entry: 417.00
🛑 Stop: 421.25
🎯 Target: 410.00
⚖️ R:R: 1.6
ZC Corn: Key Inflection at 455 as Trade Winds ShiftMacro Crosscurrents Competing for the Wheel
Corn markets have been pulled in multiple directions over the past month. The single biggest fundamental development came out of Beijing on May 14, 2026, when President Trump and President Xi met for a high-stakes summit that produced a headline agricultural deal. The White House confirmed that China agreed to purchase at least $17 billion annually in US agricultural goods for 2026, 2027, and 2028, on top of the soybean commitments Beijing made at th
ZC Long — $ZCN26 pulling back into demand shelf at 475-476 withiSetup: On the 4h, ZC has reversed the early-April low (~448) and is now trending in a clean sequence of higher lows and higher highs, currently testing the 480 area for the first time since mid-March. The 1h chart shows an intraday pullback from the 479–480 supply zone during the Apr 30 session, finding support near 474–475.5 — the prior Apr 28–29 breakout shelf and a natural demand cluster. The most recent 1h bars (Apr 30 overnight and May 1 pre-open) are consolidating in that 474.5–478.5 band
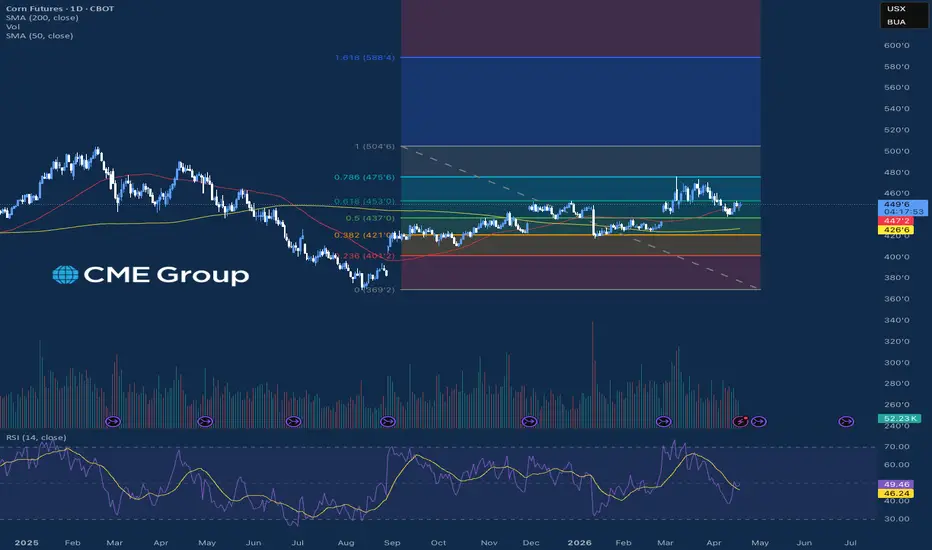
Grain Markets Starting off Q2The grain futures markets for corn, soybeans, and wheat are currently in a sideways pattern as traders balance massive supply buffers against new-crop planting uncertainties. In April 2026, the market is grappling with a heavy supply overhang from the record-breaking 2025 harvest, which has kept prices for corn and wheat near the $4.50 and $6.00 levels, respectively. While corn prices have seen occasional support from rallying wheat markets, the overall sentiment remains cautious due to the USDA
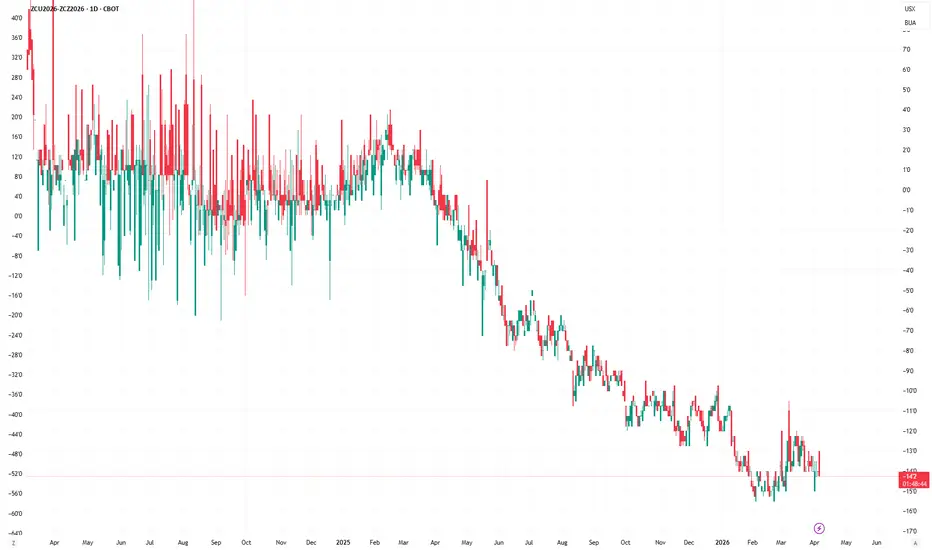
Corn Sep/Dec Spread AnalysisMost traders watch the Corn outright chart.
I prefer to look at Intramarket spreads between delivery months.
Current Sep/Dec Corn spread: ~-14'2
→ Clear contango/carry structure
→ December priced stronger than September
Why spreads matter:
1. **Seasonal Context**: Pre-harvest pressure typical for August
2. **Old Crop**: Stocks-to-use % → relatively tight
3. **New Crop**: Planting 95% complete, weather OK
The spread itself tells more about market structure, carry, and seasonal transitions tha