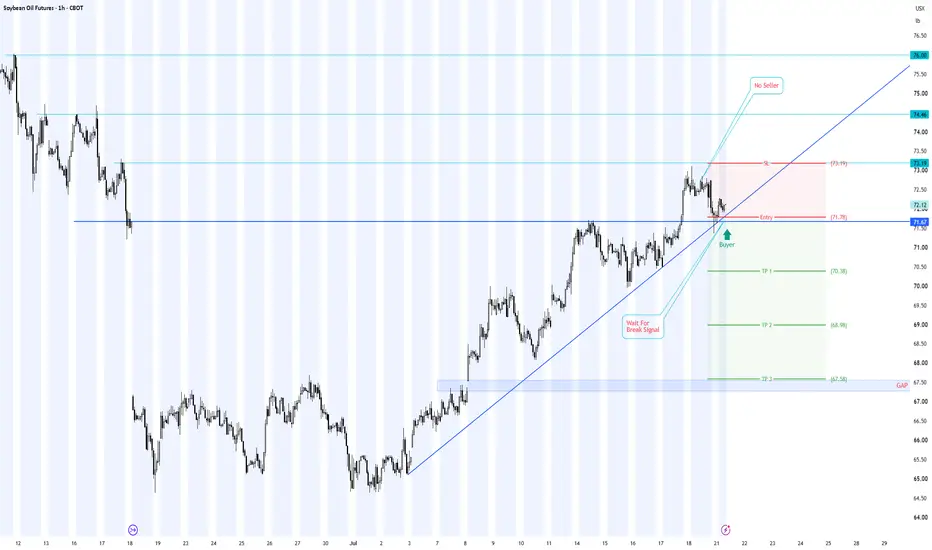
Soybean Oil (ZL1!) 1H: Trapping the Trendline Buyers
1. Buyer & Seller Psychology Analysis
• The Retail Buyer Trap: Retail buyers are aggressively buying the touch of the ascending trendline and horizontal support at 71.78 (marked "Buyer"), expecting the uptrend to resume toward 74.46. This buying behavior has clustered a massive pool of sell-stop liquidity (stop losses) directly beneath 71.78.
• The Trapped Buyers' Liquidation: As price hesitates at the high (marked "No Seller"), retail buyers are stuck holding positions at an unfavorable level. Once the trendline support breaks, these buyers will be forced to cut losses simultaneously, creating an aggressive panic-sell reaction.
• The Short Catalyst: We wait for the breakdown signal ("Wait For Break Signal") to confirm that buyers are completely trapped, riding their forced liquidation momentum down to fill the lower gap at 67.58.
2. Trade Setup
• Entry: 71.78 (Selling the trendline breakdown & buyer stop-loss trigger)
• Stop Loss (SL): 73.19 (Placed safely above the local high)
• Take Profit 1 (TP1): 70.38
• Take Profit 2 (TP2): 68.98
• Take Profit 3 (TP3): 67.58 (Targeting the lower gap fill)
In-depth trading ideas
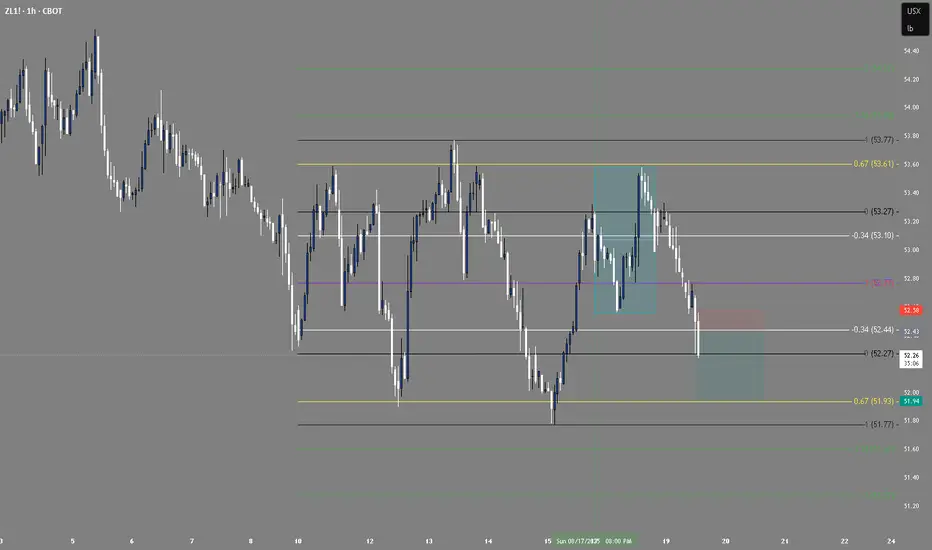
ZL Long — $ZLN26 long setup on a pullback to the 75.15 breakout ZL has reclaimed the 75.00 area after a capitulation low at 72.86 and is building higher lows on the 1h chart. The cleanest setup is not chasing 75.50, but buying a pullback into the 75.10-75.20 breakout shelf if it holds; invalidation is back below 74.55, while the next meaningful upside level is the 76.70 area from the 4h swing high. Reward/risk is acceptable at roughly 2.6:1, though confidence is capped by low RVOL and price still trading below the broader 4h EMA200.
📍 Entry: 75.15
🛑 Stop: 74.55
🎯 Target: 76.70
⚖️ R:R: 2.58
SBO : Topping possibilitySince August 2024 market moved 111.6% over 448 trading days culminated in wave b of a larger degree to be followed by a move down for wave c.
Compelling indications of a high probable turn is seen with pronounced divergence between price and MACD followed by wave c(red) into a zone where 1.13 and 1.27 of wave a displayed loss of momentum and a 5-wave structure to complete wave c.
The wave relationship between wave v(0.618) to wave iii also fell in the resistive zone.
a 3.618 ratio from the top of wave i(blue) to wave v further adds weight to the topping possibility.
Weekly closing displayed a reversal minus which generally indicates a high chance of a reversal over and above the low closing.
A confirmation of the downturn is needed. Let the market unfold itself .
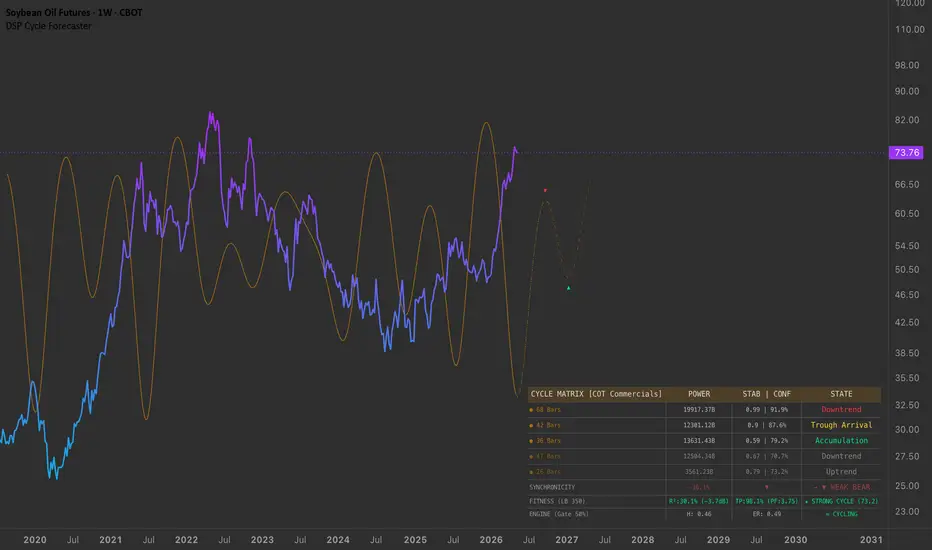
HOW-TO: Decoding Smart Money Cycles Using COT Data & DSPWhile most market participants apply Digital Signal Processing (DSP) strictly to price charts, advanced quantitative analysis allows us to extract cyclical rhythms from fundamental market internals. This publication serves as a technical guide on how to configure and interpret the DSP Cycle Forecaster when tracking institutional flows via the CFTC Commitments of Traders (COT) net positioning.
1. Bypassing Price Noise: Analyzing the "Smart Money"
In heavily commercialized commodity markets like Soybean Oil ( CBOT:ZL1! ), price action can be highly distorted by short-term speculative noise. To uncover the true structural floor, we shift the Data Source input from "Price" to "COT Commercials."
This setting forces the Goertzel algorithm to ignore daily price bars and instead run a spectral scan directly on the net hedging positions of commercial producers and processors—the true structural drivers of supply and demand.
2. Reading the Institutional Fitness Metrics
When evaluating a cycle model, we rely on three historical checkpoints generated in our metrics dashboard:
Pearson R2 (Swing Correlation): At a Lookback window of 350 weeks, the model logs an R2 of 30.1% (-3.7dB). This mathematically proves that nearly one-third of the long-term trend variance in commercial positioning is perfectly explained by our cyclic baseline.
Turning Point Accuracy (TP): The model displays a remarkable 98.1% TP accuracy. This means that historically, 98% of the mathematical peaks and troughs isolated by the algorithm matched a real-world pivot in commercial positioning within a tight ±3 bar tolerance.
Synthetic Profit Factor (PF): A compressed trade-simulation backtest of this phase alignment yields a PF of 3.75, validating the high statistical edge of the model.
Combined, these metrics trigger a ★ STRONG CYCLE (73.2) status, indicating a highly reliable environment.
3. Interpreting the Dominant Cycles
The spectral scanner has isolated a cluster of powerful macro cycles anchored by the smart money:
The 68-Week Dominant Wave: This is the primary structural rhythm, currently carrying a Bartels Confidence score of 91.9%. It is currently in a 'Downtrend' phase, indicating that macro commercial hedging pressure has been actively expanding.
The 42-Week Harmonic Wave: Operating with a 87.6% Bartels confidence, this faster cycle has entered 'Trough Arrival', signaling that the near-term positioning expansion is reaching structural exhaustion.
4. Regime Validation: H & ER
Before execution, we verify the structural regime via the platform's dual filters:
Hurst Exponent (H): 0.46 (Anti-persistent, confirming mean-reverting behavior).
Efficiency Ratio (ER): 0.49 (Balanced, non-trending structure).
The engine accurately classifies the environment as = CYCLING. In this regime, cycle turning points carry maximum mathematical weight. Traders should watch for the 68-week cycle to complete its downtrend phase and rotate alongside the 42-week wave into a localized trough to signal the next major commercials accumulation zone.
Disclaimer: This publication is for educational purposes to demonstrate the technical application of DSP math on alternative data structures. All trading involves inherent risk, and past cyclical accuracy does not guarantee future performance.
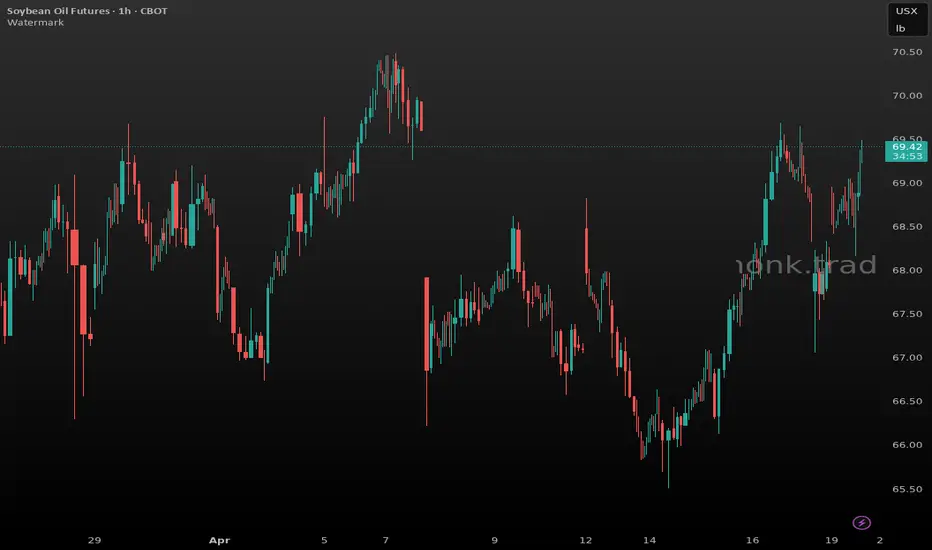
ZL Long — $BOK6 ZL pulling back to breakout support at 69.0 afteHTF 4h shows ZL in a clear uptrend from ~60 in late Feb to highs near 70.4, with each pullback finding buyers at higher lows. Price pulled back from the 70.4 HTF high to ~65.5 area Apr 13-14, then aggressively recovered — the April 16 session saw a strong breakout day with high volume (10k+ on the 08:00 bar) pushing from 68 to 69.5. Current LTF action on Apr 17 shows a healthy pullback from the 69.5 high back toward 68.0-68.1, followed by a weekend gap-up open Apr 20 at 68.86 and steady grind higher to current 69.42. The 68.5-69.0 zone is the breakout-turned-support level from the Apr 16 move. Symbol context confirms soy oil outperformance with biofuel/export demand. Entry at 69.0 on any minor dip toward that support level with stop below 68.5 (prior breakout base), targeting retest of 70.2-70.4 prior highs. R/R ~2.4:1. Volume on the recovery is constructive. No imminent catalyst risk visible.
📍 Entry: 69
🛑 Stop: 68.5
🎯 Target: 70.2
⚖️ R:R: 2.40
SOYBEAN OIL MAINTAINS STRONG BULLISH MOMENTUM – HARMONIC PATTERNKEY TAKEAWAYS:
Price structure confirms a breakout from the long-term accumulation zone, transitioning into a strong growth phase.
A Harmonic pattern is forming with a Fibonacci extension convergence point at the 74.60 area.
Short-term profit-taking pressure is appearing at psychological resistance levels but has not altered the primary trend.
Date: March 26, 2026 | Timeframe: Daily (1D) | Contract Code: ZL1! (Soybean Oil)
1. Trend and Price Structure Overview
On the Daily chart, Soybean Oil has ended its prolonged downtrend from 2023 after establishing a solid floor at the 40.00 price level (Point A). Currently, price action is moving within a steep ascending channel, characterized by a series of higher lows. The breach of the critical 63.78 resistance (1.618 Fibonacci level) confirms the return of the bulls in the medium term.
2. Notable Technical Price Levels
Target Resistance: 74.60 (2.618 Fibo - Projected Point D).
Immediate Resistance: 69.33 (Previous peak from late 2022).
Key Support: 63.78 (1.618 Fibo - Recently broken).
Psychological Support: 58.37.
3. Detailed Technical Analysis
3.1 Market Sentiment and Fund Flows
Market sentiment has shifted to an extremely optimistic (Bullish) state. Aggressive buying power completely overwhelms supply as the price approaches old support zones. Smart Money appears to have entered heavily after the accumulation structure at Point C was completed, pushing the price up with a high slope, indicating FOMO (Fear Of Missing Out) among buyers.
3.2 Price Action
Observing the most recent candle cluster near the 67.31 zone, the price shows signs of stalling with small bodies and long upper wicks. This suggests that selling pressure is emerging as the price nears the red resistance zone at 69.33. However, the preceding bearish candles were not accompanied by high volume, suggesting these are merely technical "breathers" before the uptrend resumes.
3.3 Wave Structure
Based on the chart, the wave structure is developing according to a bullish Harmonic pattern with specific measurement ratios:
The AB leg rose from the 40.00 bottom.
The BC corrective leg stayed above key support, building momentum for the CD breakout.
The CD leg's target is heading straight for the 74.60 threshold, corresponding to the 2.62 Fibonacci extension.
4. Strategic Perspective
The market is under the absolute control of the bulls. The primary strategy is to prioritize Long positions when the price retraces to technical support zones. Strictly avoid Short positions against the trend, as the upward momentum remains very strong.
5. Technical Trading Scenarios
(Referencing the strategy from March 25, 2026: Yesterday, we prioritized holding long positions when the price broke above 65.00. Current profit levels are well-protected).
Old Strategy Evaluation: Long positions from the 63.00 - 64.00 range hold a significant advantage. Continue moving the Trailing Stop up to 64.50.
Session Plan:
Scenario 1: If the price retraces to retest the 63.78 - 64.70 zone, open additional Long positions.
Scenario 2: If the price breaks directly above 69.33, the next expected target will be 74.60.
6. Recommendation for Businesses
For import-dependent enterprises, this is a high-risk period for rising costs. It is recommended that businesses consider locking in purchase prices through futures contracts to protect profit margins before the price reaches the 74.60 target zone. Avoid waiting for a deep correction, as the current structure is very resilient.
SBO Update from 19 Feb 2026Market appears volatile and impulsive in the light of the political situation in the Middle East.
Technically wave (c) of a larger degree wave b is unfolding with resistive objective suggested at areas 71.42-72.59 / 76.64 /93.23-93.98.
Current bar displayed imminent correction possibility towards 62.53-62.69 / 60.62 and likely a wave 4 congestion before attempting higher levels mentioned above.
Soybean Oil Has Moved As Much Since the Beginning of 2026My Long-Term Trajectory for Commodities.
It all started years ago when I began investing in gold. Back then, I believed that global money printing was unsustainable and that precious metals were effective inflation-hedge assets. Inflation, in my view, would inevitably escalate over time.
Then came 2022, when US CPI hit a high of 9%. That was when gold began drawing stronger attention from central banks and investors.
Another belief of mine is that gold is the leader of commodities. As long as gold remains elevated, it suggests that the fight against inflation is far from over.
Looking at the current situation, QE and money printing are unlikely to ease. Therefore, the risk of higher inflation is still in play, reinforcing the case for commodities as an inflation hedge. The rest of the commodities should move according to their own timing and underlying catalysts.
Commodity ratios have been helpful for me in rotating — cashing out of one and moving into another. From gold/silver spread to gold/platinum to gold/copper to gold/oil to gold/uranium...
While many are focusing on crude oil due to tensions in the Middle East, I’ve noticed that among the more popular oil markets, soybean oil has been moving much higher than the others.
Could soybean oil be the next to move along with crude oil after precious metals?
Soybean Oil
Ticker: ZL
Minimum fluctuation:
1/100 of one cent (0.0001) per pound = $6.00
Disclaimer:
• What presented here is not a recommendation, please consult your licensed broker.
• Our mission is to create lateral thinking skills for every investor and trader, knowing when to take a calculated risk with market uncertainty and a bolder risk when opportunity arises.
CME Real-time Market Data help identify trading set-ups in real-time and express my market views. If you have futures in your trading portfolio, you can check out on CME Group data plans available that suit your trading needs tradingview.com/cme/
Oil Is Moving Higher, But It’s Not CrudeWhile many focus on crude oil due to tensions in the Middle East, I’ve noticed that among the few popular oil markets, soybean oil is moving much higher than the others.
Could soybean oil be the next to move after precious metals?
Soybean Oil
Ticker: ZL
Minimum fluctuation:
1/100 of one cent (0.0001) per pound = $6.00
Disclaimer:
• What presented here is not a recommendation, please consult your licensed broker.
• Our mission is to create lateral thinking skills for every investor and trader, knowing when to take a calculated risk with market uncertainty and a bolder risk when opportunity arises.
CME Real-time Market Data help identify trading set-ups in real-time and express my market views. If you have futures in your trading portfolio, you can check out on CME Group data plans available that suit your trading needs www.tradingview.com
SBO -Upside push for nowFollowing up on 8 December' 2024 outlook., price movement suggests a potential wave b to the upside.
The retracement at wave a(green) presented a confluence of 0.618 retracement and a measured move between wave c to wave a saw support between 42.05-38.31 which pivoted prices towards an upside bias.
The current price rise is suggesting the completion of wave c's culmination into a larger cycle wave b. On measured move, the red bars are the potential technical targets worth noting.
Rising momentum in MACD technically supports the current trend too.
SBO Bottoming OutlookAfter the bottoming of 37.66 in August 2024 the market went sluggish, but it maintained a bullish swing where rising bottoms were exhibited. A rounded bottoming pattern presented itself with a divergence showing towards the current recent low 48.27 and MACD is moving into positive territory suggest upside potential.
Leaning on the wave principle, wave c is likely in the making toward the prior wave b (yellow) as an objective.
Support from the rounded bottom formation together with the wave count mitigate a firmer market in the months ahead.
Technical analysis across soybeans mix (ZL, ZS & ZM) and HOTechnical analysis across soybeans (ZS), soymeal (ZM), soybean oil (ZL), and NY Harbor ULSD (HO) points to an imminent shift in trend for soybean oil, with strong prospects for a reversal and medium-term recovery.
Soybean Oil (ZL) – Daily Chart Focus
Support Zone & Anchored VWAP: ZL has reached the “golden pocket” reversal area between 50% and 61.8% Fibonacci retracement (48.48–46.63), confirming major technical support. Current price action is also interacting with an anchored VWAP—suggesting that this is a fair value zone for institutional buyers and sellers.
Momentum & Volume: RSI is at oversold levels and volume is elevated, indicating potential exhaustion of selling and fresh accumulation. Candle formation shows lower wicks at support, hinting at strong defensive buying.
Reversal Scenario: Should ZL reclaim the VWAP on a daily close and RSI begins to turn up, it would confirm a high-probability reversal. If this support zone breaks, the next anchor is 45.75–43.85.
Soy Complex – Soybeans (ZS) & Soymeal (ZM)
Soybean (ZS) : Both daily and weekly charts show breakout momentum, above prior resistance, on sharply rising volume and RSI. Price structure favors continued upside, which helps stabilize weaker components, including ZL.
Soymeal (ZM) : Shows extreme outperformance, with a runaway weekly breakout and volume spike. This leads the soy complex higher and increases the likelihood that soybean oil finds foothold and rebounds if ZS and ZM remain strong.
NY Harbor ULSD (HO) – Energy Market Link
Trend & Support: HO! remains on a bullish trajectory with strong support, base-building above key volume areas. RSI is positive, supporting a further rally.
BOHO Spread Implications: Strong HO prices tighten the BOHO spread, which directly enhances biofuel blending margins for soybean oil. This translates to increased discretionary demand for ZL when energy markets are trending higher.
Combined Outlook: Soybean Oil’s Trend & Prospect
| Market | Current Trend | Signal for ZL | Outlook for Soybean Oil |
| --- | --- | --- | --- |
| Soybeans | Breakout, bullish | Supportive | Underpins stability |
| Soymeal | Explosive rally | Strong leadership | Increases reversal odds |
| ULSD (HO) | Bullish, stable | BOHO favorable | Fuels biofuel demand |
| Soybean Oil | Testing strong support | Oversold, ready to turn | High-probability reversal |
Final Read:
Soybean oil is at its most statistically reliable technical reversal zone, supported by strength in the broader soy complex and a bullish energy market. If buyers defend the golden pocket and reclaim anchored VWAP, a trend reversal and corrective rally are highly probable. Price action, volume, and momentum are all aligned for a mean reversion if confirmation occurs in upcoming sessions.
Analysis techniques – Soybean Oil Futures (Dec 2025)Analysis techniques – Soybean Oil Futures (Dec 2025)
Date: 03/10/2025 | Timeframe: D1 | Contract Code: ZLZ25
1. Trend Overview and Price Structure
Soybean oil (Dec 2025) closed at 50.41 cents/pound (+0.16%), consolidating within a tight range of 49.5 – 50.5. After a prolonged decline since July, the market is forming a temporary base but remains under bearish pressure. Current structure suggests indecision, awaiting a breakout from the consolidation box.
2. Key Technical Levels
Resistance: 50.5 – 53.7 – 56.9
Support: 49.0 – 46.5 – 41.8
3. Detailed Technical Analysis
Short-term trend: Sideways consolidation in 49.5 – 50.5; breakout will set next direction.
Volume: Average trading volume, limited new flows.
Wave structure: The prior bearish wave is stalling; a corrective rebound could emerge if 50.5 is breached.
Confirmation signals: A close above 50.5 opens upside toward 53.7 – 56.9; a break below 49 targets 46.5 – 41.8.
4. VNC View
Short term, soybean oil is in a fragile balance. A breakout from 49.5 – 50.5 range will provide a clear trading signal. Medium term, global vegetable oil supply (palm, sunflower) exerts strong competition, limiting sustainable rallies unless supported by crude oil or biodiesel demand.
5. Suggested Technical Strategies
Long Setup (on breakout):
Entry: 50.6 – 51.0
TP: 53.7 – 56.9
SL: 49.5
Probability: 60%
Short Setup (on breakdown):
Entry: 48.8 – 49.0
TP: 46.5 – 41.8
SL: 50.5
Probability: 55%
6. Corporate Hedging Guidance
Edible oil producers: May hedge raw material costs near 49 – 50.
Biodiesel industry: Watch 50.5 breakout; increase hedging if confirmed.
Exporters: Favor partial selling near 53.7 – 56.9 during rallies to avoid downside risks toward 46 – 42.
Soybean Oil Weekly Roundup - September 12, 2025🌱 Soybean Oil Weekly Roundup by Southwind 🌱
🗓️ Week ending: September 12, 2025
📊 Price & Chart
Daily: Soft close with momentum lagging as price hovers below key moving averages on the rebound, keeping near-term tone steady but unconfirmed for trend expansion.
Weekly: A strong rounded-bottom base has been forming since 2024; if confirmed above the neckline, historical pattern behavior supports further upside follow-through.
🟢 Key Technicals
Support: 51.13–49.79 (retracement zone and high-volume area acting as the pivotal demand cluster).
Resistance: 57.17 level (major weekly barrier); a decisive breakout and close above would confirm an advancing phase.
RSI: Neutral on both timeframes, not yet stretched to overbought, leaving room for extension if buyers press the advantage.
🌾 Soybean Factor
Soybeans remain in a constructive setup, and the crush linkage typically transmits strength from soybeans into soybean oil pricing via processing margins and product correlations.
🧭 Fundamentals
U.S. soybean oil use for biofuel is held at 15.5B lbs for 2025/26, reflecting policy support and explicitly reducing exports, which tightens global supply and is price‑positive when demand persists.
Industry and media coverage echo USDA’s view that biofuel makers could consume over half of U.S. soyoil next year, implying materially lower exports and firmer global pricing baselines.
India’s import mix flexes with relative prices—recently favoring soyoil when cheaper versus palm—but flows can pivot back to palm as spreads shift, shaping the global veg‑oil balance near term.
MPOC expects China and India demand to rise when palm is “reasonably priced,” making the palm–soyoil relationship a key transmission channel for price support across oils.
Technicals 🧭
💼 Flows & Traders
Positioning and flows remain measured, but cross-complex momentum can build if soybeans lead and spreads favor product-led rotation into soybean oil and palm on relative value.
🚦 Triggers
🟢 Bull signal: Break and weekly close above 57.17 with participation, ideally accompanied by continued soybean strength and supportive crush margins.
🟡 Range/neutral: Bounces from 51.13–49.79 keep rotation intact; expect choppy trade unless a soybean-led impulse accelerates.
🔴 Bear risk: A clean loss of 49.79 opens a deeper base test toward lower weekly supports before any renewed attempt to resolve higher.
#Soybean Oil #ZL1! #ZL
Soybean Oil Futures Face Breakdown Risk Below $50
Current candle is a bearish red candle breaking below the lower Bollinger Band → suggests weakness and possible continuation.
The 20-day moving average (middle Bollinger Band) is sloping downward.
Price is trading below the 20-day MA → bearish short-term momentum.
Price is riding the lower band → typical bearish trend behavior.
If price breaks below 50.00 with volume, expect acceleration toward 48.50 – 47.00.
Soybean Oil Weekly Roundup - Week ending: Aug 29, 2025🌱 Soybean Oil Weekly Roundup by Southwind 🌱
🗓️ Week ending: Aug 29, 2025
📊 Price & Chart
- Daily: Soft close, momentum weak, price under key moving averages.
- Weekly: Strong **rounded bottom** base building since 2024. Soybean’s bullish setup may help push soy oil higher.
🟢 Key Technicals
- Support: 51.13–49.79 (retracement zone, high volume area).
- Resistance: 57.17 level (major weekly barrier). Breakout above confirms uptrend.
- RSI: Neutral, still not overbought.
🌾 Soybean Factor
- Soybeans are in a bullish pattern, which usually lifts soybean oil due to their processing link (crush spread correlation).
🧭 Fundamentals
- USDA: Ample US stocks, balance sheet steady for now.
- Biofuels: Bigger 2025/26 demand projection supports medium-term outlook. ⛽
- Vegoil Market: Palm/sunflower still weighing on short-term prices, but watch for reversal.
💼 Flows & Traders
- Specs still cautious, but cross-commodity rally potential as soybeans lead. Prepare for possible upside if bull trend develops.
🚦Triggers
- 🟢 Bull signal: Break above 57.17 with volume and soybean strength.
- 🟡 Range/neutral: Bounce from support, chop likely unless soybean rally accelerates.
- 🔴 Bear risk: Loss of 49.79 support zone targets deeper base.
#Soybean Oil #ZL1! #ZL
high RR opportunity as sellers return to support in uptrend 1->4 : creates higher highs and lows, making numebr 1 a major market low when number 2 surpassed the previous pivot before this count, and number 3 a solid market low when number 4 surpassed number 2
4->5 : we return to solid major buyers in number 3 , I decided to make the pivot here becase this is the horizontal intersection of all 3 candles making this pivot without violating any of the candle bodies
what do I think will happen ?
* with a fractal higher high in the candles it shows a good sign that we might continue up from here and if the pattern and momentum/trend follows continue and surpass number 4 at some point
* we are on an uptrend and have returned to fill a gap with bullish candles at this point on the daily timeframe
* bullish divergence on both RSI and MFI
* oversold on both RSI and MFI
* zones have a 62% follow through rate on bullish follow throughs , over past 2,500 candles, you can reduce lookback to a few hundred and manually count using replay to ensure its only realtime counts, this helps in confirming our stop loss as well as a breakeven ( and potentially add position ) and take profit point.
Why Soybean Oil Outperforms Crude Oil?From their recent lows, soybean oil has quietly crept up by 50%, while crude oil has risen by 40%. The reason goes beyond the recent renewal of tensions in the Middle East — it runs deeper than that.
Mirco SoybeanOil Futures
Ticker: MZL
Minimum fluctuation:
0.02 per pound = $1.20
Disclaimer:
• What presented here is not a recommendation, please consult your licensed broker.
• Our mission is to create lateral thinking skills for every investor and trader, knowing when to take a calculated risk with market uncertainty and a bolder risk when opportunity arises.
CME Real-time Market Data help identify trading set-ups in real-time and express my market views. If you have futures in your trading portfolio, you can check out on CME Group data plans available that suit your trading needs www.tradingview.com
Trading the Micro: www.cmegroup.com
www.cmegroup.com
Why the Sudden Surge in Soybean Oil Prices?Recent sharp increases in Chicago soybean oil prices reflect a confluence of dynamic global and domestic factors. Geopolitical tensions, particularly those impacting crude oil markets, have played a significant role, as evidenced by the recent surge in Brent crude futures following events in the Middle East. This volatility in the broader energy complex directly influences the cost and strategic value of alternative fuels, positioning soybean oil at the forefront of this market shift.
A primary driver of this ascent is the transformative policy initiatives from the U.S. Environmental Protection Agency (EPA). The EPA's proposed Renewable Fuel Standard (RFS) volume requirements for 2026 and 2027 represent an aggressive push towards increased domestic biofuel production. These mandates, significantly exceeding previous targets, aim to bolster U.S. energy security and provide substantial support for American agriculture by boosting demand for soybeans and their derivatives. Key changes, such as the transition to RIN equivalents and reduced RIN costs for imports, are designed to further incentivize domestic consumption and reshape market dynamics.
This policy-driven demand fundamentally reorients the U.S. soybean oil market, causing Chicago Board of Trade futures to increasingly reflect internal American forces rather than global trends. This necessitates a shift in focus for traders towards physical market prices in other regions for international insights. The market has reacted swiftly, with notable increases in futures prices, a surge in open interest, and record trading volumes, indicating strong investor confidence in soybean oil's role within this evolving landscape. Concurrently, the new mandates exert pressure on imported biofuel feedstocks, further solidifying the emphasis on domestic supply.
Ultimately, the rise of soybean oil prices signifies more than just market speculation; it marks a pivotal transformation. It positions soybean oil as an essential commodity within the U.S.'s energy independence strategy, where robust domestic demand, shaped by forward-looking policy, becomes the prevailing force. This transition underscores how intertwined agricultural markets now are with national energy objectives and global geopolitical stability.
Soybean OilTo me the view is pretty clear. In 2026 we may see 75$
* The purpose of my graphic drawings is purely educational.
* What i write here is not an investment advice. Please do your own research before investing in any asset.
* Never take my personal opinions as investment advice, you may lose your money.