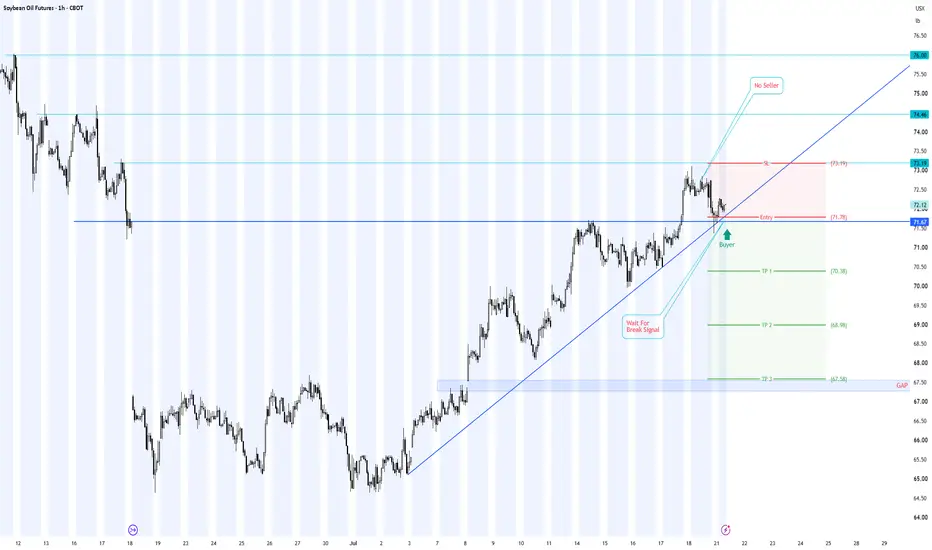
Soybean Oil (ZL1!) 1H: Trapping the Trendline Buyers
1. Buyer & Seller Psychology Analysis
• The Retail Buyer Trap: Retail buyers are aggressively buying the touch of the ascending trendline and horizontal support at 71.78 (marked "Buyer"), expecting the uptrend to resume toward 74.46. This buying behavior has clustered a massive pool of sell-stop l
Soybean Oil Futures (Sep 2026)
No trades
No trades
Compare with Soybean Oil Futures (Sep 2026)
Contract highlights
ZL Long — $ZLN26 long setup on a pullback to the 75.15 breakout ZL has reclaimed the 75.00 area after a capitulation low at 72.86 and is building higher lows on the 1h chart. The cleanest setup is not chasing 75.50, but buying a pullback into the 75.10-75.20 breakout shelf if it holds; invalidation is back below 74.55, while the next meaningful upside level is t
SBO : Topping possibilitySince August 2024 market moved 111.6% over 448 trading days culminated in wave b of a larger degree to be followed by a move down for wave c.
Compelling indications of a high probable turn is seen with pronounced divergence between price and MACD followed by wave c(red) into a zone where 1.13 and 1
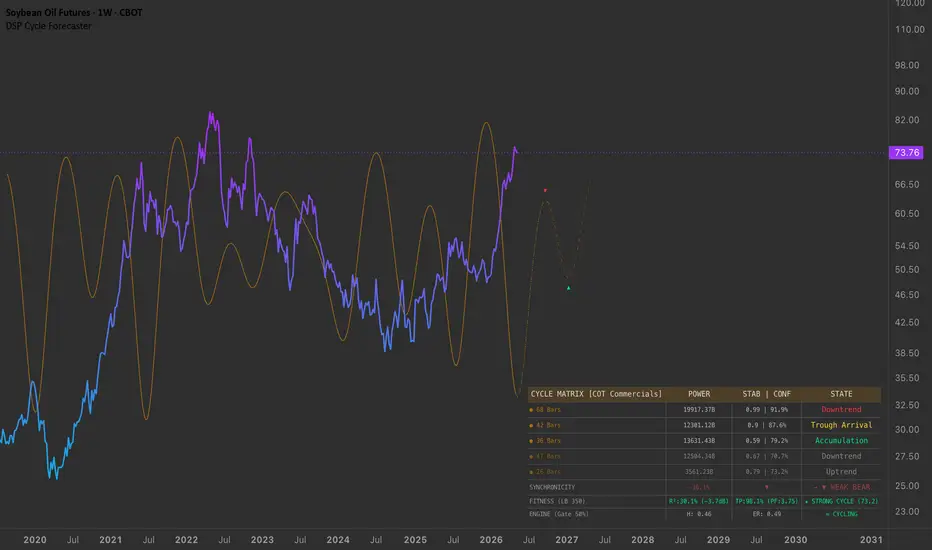
HOW-TO: Decoding Smart Money Cycles Using COT Data & DSPWhile most market participants apply Digital Signal Processing (DSP) strictly to price charts, advanced quantitative analysis allows us to extract cyclical rhythms from fundamental market internals. This publication serves as a technical guide on how to configure and interpret the DSP Cycle Forecast
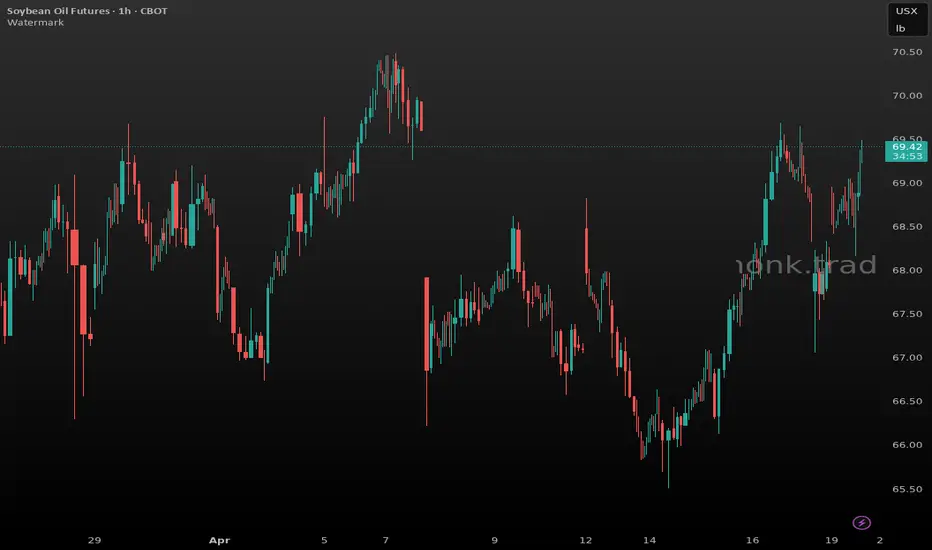
ZL Long — $BOK6 ZL pulling back to breakout support at 69.0 afteHTF 4h shows ZL in a clear uptrend from ~60 in late Feb to highs near 70.4, with each pullback finding buyers at higher lows. Price pulled back from the 70.4 HTF high to ~65.5 area Apr 13-14, then aggressively recovered — the April 16 session saw a strong breakout day with high volume (10k+ on the 0
SOYBEAN OIL MAINTAINS STRONG BULLISH MOMENTUM – HARMONIC PATTERNKEY TAKEAWAYS:
Price structure confirms a breakout from the long-term accumulation zone, transitioning into a strong growth phase.
A Harmonic pattern is forming with a Fibonacci extension convergence point at the 74.60 area.
Short-term profit-taking pressure is appearing at psychological resistan
SBO Update from 19 Feb 2026Market appears volatile and impulsive in the light of the political situation in the Middle East.
Technically wave (c) of a larger degree wave b is unfolding with resistive objective suggested at areas 71.42-72.59 / 76.64 /93.23-93.98.
Current bar displayed imminent correction possibility towards
Soybean Oil Has Moved As Much Since the Beginning of 2026My Long-Term Trajectory for Commodities.
It all started years ago when I began investing in gold. Back then, I believed that global money printing was unsustainable and that precious metals were effective inflation-hedge assets. Inflation, in my view, would inevitably escalate over time.
Then came
Oil Is Moving Higher, But It’s Not CrudeWhile many focus on crude oil due to tensions in the Middle East, I’ve noticed that among the few popular oil markets, soybean oil is moving much higher than the others.
Could soybean oil be the next to move after precious metals?
Soybean Oil
Ticker: ZL
Minimum fluctuation:
1/100 of one cent (0.0
SBO -Upside push for nowFollowing up on 8 December' 2024 outlook., price movement suggests a potential wave b to the upside.
The retracement at wave a(green) presented a confluence of 0.618 retracement and a measured move between wave c to wave a saw support between 42.05-38.31 which pivoted prices towards an upside bias.
See all ideas
Summarizing what the indicators are suggesting.
Neutral
SellBuy
Strong sellStrong buy
Strong sellSellNeutralBuyStrong buy
Neutral
SellBuy
Strong sellStrong buy
Strong sellSellNeutralBuyStrong buy
Neutral
SellBuy
Strong sellStrong buy
Strong sellSellNeutralBuyStrong buy
A representation of what an asset is worth today and what the market thinks it will be worth in the future.
Displays a symbol's price movements over previous years to identify recurring trends.
Frequently asked questions
The current price of Soybean Oil Futures (Sep 2026) is 70.46 USX / LBR — it has risen 0.46% in the past 24 hours. Watch Soybean Oil Futures (Sep 2026) price in more detail on the chart.
The volume of Soybean Oil Futures (Sep 2026) is 3.47 K. Track more important stats on the Soybean Oil Futures (Sep 2026) chart.
The nearest expiration date for Soybean Oil Futures (Sep 2026) is Sep 14, 2026.
Traders prefer to sell futures contracts when they've already made money on the investment, but still have plenty of time left before the expiration date. Thus, many consider it a good option to sell Soybean Oil Futures (Sep 2026) before Sep 14, 2026.
Open interest is the number of contracts held by traders in active positions — they're not closed or expired. For Soybean Oil Futures (Sep 2026) this number is 111.35 K. You can use it to track a prevailing market trend and adjust your own strategy: declining open interest for Soybean Oil Futures (Sep 2026) shows that traders are closing their positions, which means a weakening trend.
Buying or selling futures contracts depends on many factors: season, underlying commodity, your own trading strategy. So mostly it's up to you, but if you look for some certain calculations to take into account, you can study technical analysis for Soybean Oil Futures (Sep 2026). Today its technical rating is sell, but remember that market conditions change all the time, so it's always crucial to do your own research. See more of Soybean Oil Futures (Sep 2026) technicals for a more comprehensive analysis.