October Daytrading Dow Jones Futures Results Ended +6.35RI will walk you through each of my trades this month. I am going to call it a month. It was an average month for me. Made some errors and will rebound in November. I ended October with +6.35R. Still profitable but was aiming for minimum 8R. My errors costed me 5R.
The reason I am calling it a month now is FOMC is next week. FOMC is in my experience a very manipulating week. Moves don't follow through as much; traps are set on both sides and overall, just insipidus price action. Not to mention,
In-depth trading ideas
CBOT Dow Futures (YM) Rolling Strategy to Position Higher ReturnCBOT_MINI:YM1!
The 2026 midterm elections are on November 3rd.
On Kalshi, Democrats are priced at 91 percent to control the House and 69 percent to control the Senate.
The Dow Jones Industrial Average is the best long-history U.S. stock market benchmark. From 1929 to 2025 we have 97 years of data, covering 16 presidents and 24 four-year terms.
We treat the midterm as the midpoint of each presidential term. That splits every term into a first half—years one and two—and a second half—years
YM vs ES: does a lagging Dow catch up? 49 sessions tested👋 A popular intraday idea: when the Dow lags the S&P 500 in the first hour, it "catches up" later. I used that reason in my own Dow long today, and that long was invalidated. So I measured it.
📊 Method
• CME futures YM (Dow) and ES (S&P 500), 30-minute bars, 49 US cash sessions (18 Aug to 26 Oct 2026).
• First hour = 13:30 to 14:30 UTC (9:30 to 10:30 New York). Rest of day = 14:30 to 20:00 UTC.
• Spread = YM % change minus ES % change. "YM lags" = first-hour spread below −0.10%.
• For scale: th
Dow futures LONG above 52,545: the laggard targets 52,818👋 Dow futures (YM, Dec) have been the laggard today. Since the 13:30 UTC cash open, NQ is up about 0.9% and ES about 0.4%, and both trade above Monday's highs. YM is up about 0.1% and is still inside Monday's range. This is a volume-profile read on whether the laggard catches up. Levels come from the VWAP & Volume Profile Order Flow Map and CME volume (5m bars, 5-point rows).
📊 Where value is
• Last week (Oct 19-23): value area ~52,065-52,825, POC 52,695.
• Friday cash session: value 52,420-5
Dow Jones (YM) — Buyers Losing Control | Order Flow Short Setup CBOT_MINI:YM1!
YM | Bearish Setup — Order Flow & Volume Profile Analysis 📉
Buyers attempted to push price higher, but their efforts failed to produce meaningful upside continuation.
Price reached a significant high-volume area around 52,000, where it struggled to establish acceptance above resistance.
Despite buying activity, there was no sustained bullish follow-through. Sellers eventually stepped in and pushed price lower.
What I'm seeing in Order Flow:
Buying pressure failed to gen
Trap Days and How to Avoid ThemAvoiding trap days are very important to save capital and to increase win rate. Trap days have very specific characteristics to them. Mainly, they get you to buy/sell up high/ down low and trap both sides. These are no edge days and the best course of action is to walk away.
Roughly 50% of all trading days, are in fact Trap days/ No edge days.
I will use the bearish continuation daily template to highlight what a trap day is and what a viable short entry should look like
Excellent Beari
Day trading October New Monthly CycleNew Month, New timing Cycle. New monthly candle forming.
This is the third month now showing my monthly process.
Now that the first two days have traded, I have gathered some vital information.
The monthly open in orange 51,335. What I am seeing is so far the first two days have been mean reverting around the monthly open.
The 15-minute ATR (the timeframe I enter in on) is at 110
I have decided that I will be using 185 tick stops for the entirety of October. No matter how and where
Dow Futures (YM) Bearish Sequence Targets 49570The short-term Elliott Wave view in Dow Futures (YM) shows that the cycle from the August 5, 2026 high remains active as a double three corrective structure. From that peak, wave (w) finished at 51609. A rally in wave (x) then ended at 52840. The Index has since resumed its decline and broke below the termination point of wave (w). This break confirms that the next leg lower has started. The projected downside target is the 100% to 161.8% Fibonacci extension of wave (w), which lies between 47542
October Preparation New Month Template StartNow that September has three trading days left, the new month is about to be upon us. I don't know what the monthly open will be yet, but once I do, I will mark it in orange.
So far this month, September has been a bearish template with a sort of creeping down motion. Creeping trends either blow off in the direction they are creeping in, or they violently reverse.
I take it day by day and won't know what October will look like until it plays out. Just a ball park estimate, I think October wi
September Results Day Trading Dow JonesI am going to call it a month being up 12.5R with Thursday's trade closing in green. I will take the rest of the month off to regroup and to let the month play out. Usually, at the end of month's, the market likes to manipulate prices and set up for the next month.
Using the 1-hour chart, I have drawn what the monthly candle looks like and the price action inside of it. Every month I mark out the open of the month and two black vertical lines.
Below are my trades and my thought processes
First Half of September Trades Taken Results Day TradingPre FOMC tomorrow, these are my results so far
10 trades taken
6 wins
4 losses
using 1.6 risk to reward
(1.5 plus 0.1 for commissions)
125 tick stops
200 tick targets
So far up 5.6R
I am risking 3% risk per trade
So far, I am ok with the results. Two losses were just random variance and didn't work out. Nothing to fret about that. The other two were just poor execution and being a dummy. One loss I entered in way too early before the pullback to the 20 and got tagged out. I reentered a
Trading idea for the MYM on September 10, 2026CBOT_MINI:MYM1!
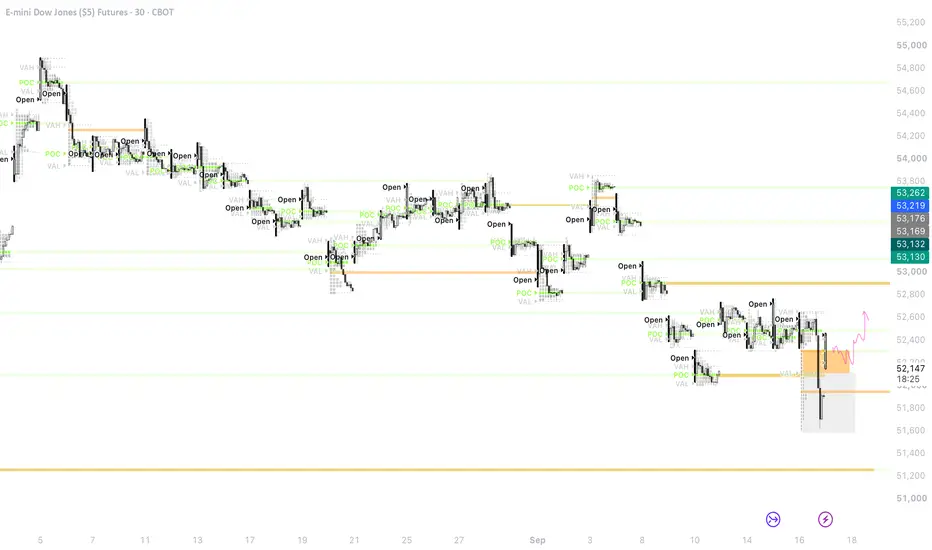
The price is in a neutral position from a technical standpoint. I'd like to see how it reacts at Monday's open and how it unfolds over time to make a better decision on whether to go long or short. For now, I see a good buying opportunity, but I'm not too fond of the fact that the daily 20-period SMA is so close; however, I think the market could still rise further.