First Half of September Trades Taken Results Day TradingPre FOMC tomorrow, these are my results so far
10 trades taken
6 wins
4 losses
using 1.6 risk to reward
(1.5 plus 0.1 for commissions)
125 tick stops
200 tick targets
So far up 5.6R
I am risking 3% risk per trade
So far, I am ok with the results. Two losses were just random variance and didn't work out. Nothing to fret about that. The other two were just poor execution and being a dummy. One loss I entered in way too early before the pullback to the 20 and got tagged out. I reentered and tried it again. The other loss, I honestly don't know what I was thinking. I shorted right at the low of day and immediately got slapped. I occasionally have these dumb trades/squirrel brain moments. What I do is cut all losses at 125 ticks so if I am a moron, I am out fast. This is the one thing I do not mess around with. Get out and walk away.
With FOMC on Wednesday, I am taking the day off. I DO NOT touch FOMC Wednesday's. I have about 8 or 9 good trading days left in September. I might take 6-8 more trades depending on what presents and if my setups are there. My goal is to sustain the 60%-win rate I have and finish the month out with a 10R month.
In-depth trading ideas
September Results Day Trading Dow JonesI am going to call it a month being up 12.5R with Thursday's trade closing in green. I will take the rest of the month off to regroup and to let the month play out. Usually, at the end of month's, the market likes to manipulate prices and set up for the next month.
Using the 1-hour chart, I have drawn what the monthly candle looks like and the price action inside of it. Every month I mark out the open of the month and two black vertical lines.
Below are my trades and my thought processes
All in all, not a bad month. All I can control is my risk per trade and I just keep executing base hits.
October Preparation New Month Template StartNow that September has three trading days left, the new month is about to be upon us. I don't know what the monthly open will be yet, but once I do, I will mark it in orange.
So far this month, September has been a bearish template with a sort of creeping down motion. Creeping trends either blow off in the direction they are creeping in, or they violently reverse.
I take it day by day and won't know what October will look like until it plays out. Just a ball park estimate, I think October will be a massive dump month to slam down into the monthly 20sma. That doesn't mean there won't be any good Long day trades. As a day trader, I care very little what side the market sets up. It either presents me my setups or I don't participate.
Below I will highlight my thought processes
Spike and channel creeping trend down
Trading idea for the MYM on September 10, 2026CBOT_MINI:MYM1!
The price is in a neutral position from a technical standpoint. I'd like to see how it reacts at Monday's open and how it unfolds over time to make a better decision on whether to go long or short. For now, I see a good buying opportunity, but I'm not too fond of the fact that the daily 20-period SMA is so close; however, I think the market could still rise further.
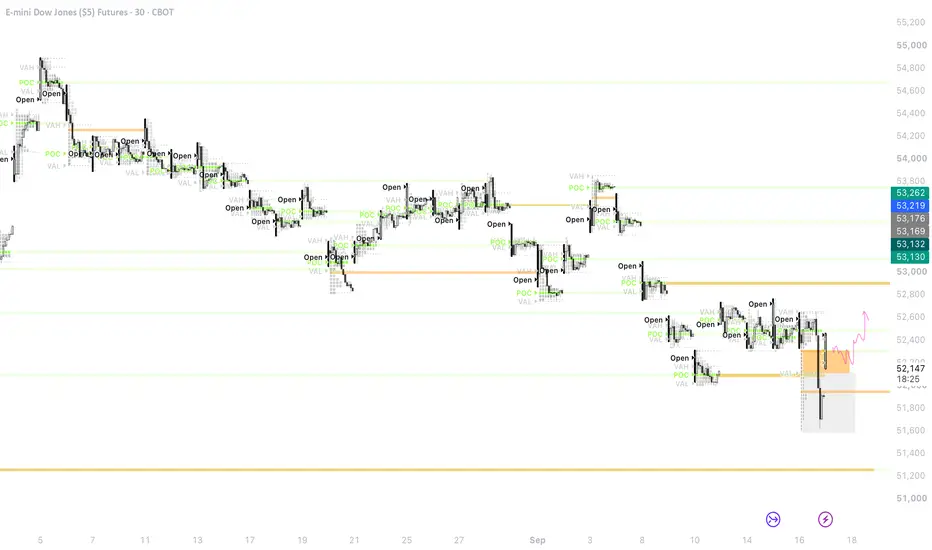
US30 15M: Wait for Bullish Break of Structure (BOS) ConfirmationOn the 15-minute timeframe, US30 (Sep 2026) has dropped into a major lower demand/support zone near the $52,060 - $52,127 area after sweeping previous swing lows. Price is currently consolidating within this support block, setting up a potential bullish reversal scenario.
Technical Reference Levels
Projected BOS Confirmation Level: ~$52,180 (Awaiting Break of Structure Level)
Invalidation / Structural Level: ~$52,005.1 (Below the lower demand zone boundary)
Upside Target Level: ~$52,673.1 (Overhead resistance / liquidity target)
Technical Setup Logic
The technical plan calls for patience: awaiting a confirmed bullish Break of Structure (BOS) above the minor lower-high resistance (near $52,180) to validate buyer control. Upon a confirmed BOS and subsequent retest of the demand area, the setup targets higher liquidity near $52,673.1, with structural invalidation below $52,005.1.
Disclaimer & Purpose
This post is strictly for educational, analytical, and charting practice purposes only. It is not a financial idea, trading signal, or investment advice. Always manage your own risk and perform independent research.
Trading Craft 101 · Lesson 04 — Backtesting 101🔵 WHY BACKTEST AT ALL
A backtest is the cheapest way to discover that your edge does not exist. Better to find it in data than in your account. But a backtest is only as honest as its rules — and most backtests are dishonest in the same, quiet way.
🔵 THE EXACT-MECHANICS RULE
Before any test, write the trade in full mechanical detail: the exact entry condition, the exact stop, the exact target, the exact size. "Enter near support" is not testable — "buy on a daily close above X, stop below Y, first target Z" is. If two people reading your rules would trade differently, the rules are not rules yet.
🔵 THE SILENT LIES
Watch for the classics: curve-fitting (the rules were tuned on the same data they are tested on), ignoring costs (spread, commission, slippage — they eat small edges whole), cherry-picking the start date, and "after-the-fact" entry — entering at the exact low because the chart is already drawn. Every one of these inflates the result.
🔵 THE 80% RULE
A realistic backtest should survive a haircut: subtract costs, assume worse fills, test a different start date. If the edge disappears under the haircut, it was never an edge — it was precision disguised as insight.
Next lesson: the journal — the tool that turns your own trading into data.
Educational content only. Not investment advice.
#DJIA Futures - 7500 Points move expected?Date: 23-03-2026
#Dow Jones Futures
Earlier we had captured 8000 points move from Apr 2025 and 3500 points since last month,
Now the new levels are emerging which are highlighted 10 days ago and the same is getting updated here.
The levels are drawn on the chart. New 7500+ points move is expected and its non-directional call. No advice for anyone.
I don't mind shorts, but I'd like to get a correction for that!Yesterday was a bank holiday, and today we opened with a strong sell-off into short positions, since the overall narrative for us is still bearish. I’d like to see a correction so we can assess whether the trend will continue, especially since we’re now testing the long NPOC—it would be good to get confirmation and trigger a correction toward the short zones.
**The Four-Quadrant Framework: Using DXY to Navigate Risk**Just as we learned to analyze situations through four quadrants in school, markets can also be approached through a four-quadrant framework.
At the center of my framework is the U.S. Dollar Index (DXY). Its direction often provides an important signal about global liquidity and whether markets are shifting toward a **risk-on or risk-off environment**. Once the DXY trend and market regime become clearer, traders can better align their strategies across equities, commodities, cryptocurrencies, and other risk assets.
DXY should not be treated as a standalone trading signal. It is most effective when combined with market structure, liquidity, volatility, momentum, and disciplined risk management.
This framework has contributed to my current ranking of **23rd out of 55,886 participants—approximately the top 0.04%**. I have made mistakes along the way, as every trader does, but mistakes are valuable when they lead to honest review, adaptation, and better execution.
Master the market regime, align your strategy with it, and remain disciplined. It is never too late to correct course and return to the right path.
Cheers, and trade wisely.
My August 2026 PerformanceI want to share my August performance to follow up with my strategy so you can see how an entire month looks like from start to finish. I will admit, I made some mistakes and fumbled at the start. Lessons learned to go into September strong.
I took 12 trades total
Won 7
Lost 5
58% win rate
Total R gained/Lost: +9R
Mistakes made:
I was feeling confident in increasing my targets to 3.5-4R after years of using 2-2.5R
My second trade hit 2R before rolling over (a 3R mistake)
My third trade only went 1.5R before rolling over ( who cares)
I took two trades outside of my New York timing window (Revenge traded -2R mistakes)
Improvements:
On over 80% of my winners, they were in deep red before going to target. Need to improve my timing
My Trades:
I will continue this series for September, October, November and December to show my process and trading strategy
Another Run Down On My Daytrading Strategy Highly EffectiveI want to walk through another month on how I go about trading to both help others and to solidify my own understanding of the process.
Every month using the daily chart, there are roughly 20 daily bars. Every month has a beginning, end and an open. I am not interested in the close because it is irrelevant. My daytrading strategy is to trade the monthly bar, using the daily candlesticks.
I am a 15 minute chart trader that happens to use the daily chart within the monthly candle. Once you understand this dynamic, trading becomes a whole lot easier.
The monthly open, I mark in orange every month
Each daily candle open, I mark in cyan blue every day
Step One:
Mark the vertical lines in black seperating the start and end of the month
Step Two:
Let the first trading day of the month unfold. DO NOT TRADE. Mark the monthly open. See what happens. Gather information.
Step Three:
Figure out what dates for NFP, CPI and FOMC
Step Four:
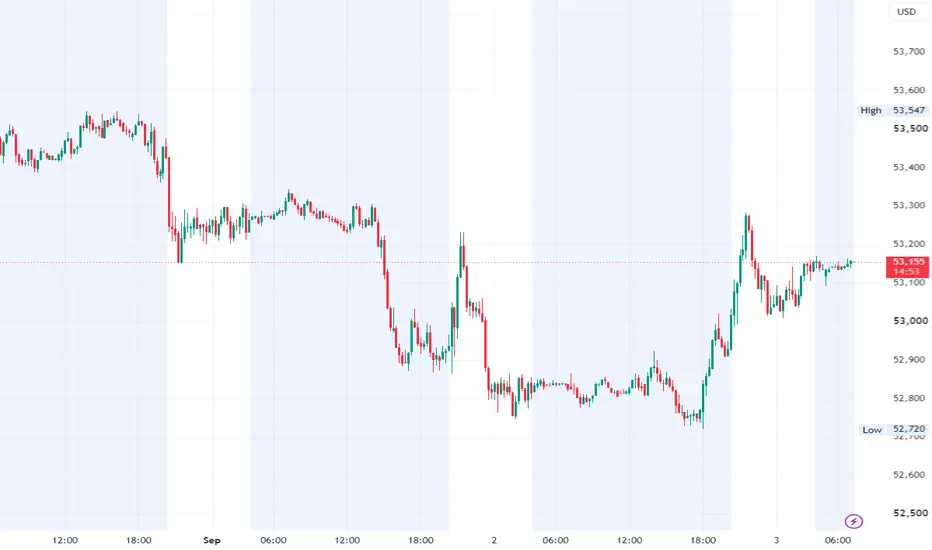
On the hourly chart, mark every daily start with a thin blue vertical line
Step Five:
The hardest part, LIVE TRADING, day by day. Only trade the New York session and ONLY after the first two, 15 minute candles (30 minutes) after the open.
There are only two setups to go for. Either a High of Day/Low of Day Reversal or a trend continuation setup.
The stop loss placement is a fixed tick stop based on ATR. In the case of August, I was using a 125 tick stop. The target is a fixed 2 to 1. In this case it was 250 ticks.
I will hold trades overnight and throughout the weekend until either my stop or target is hit.
There is roughly 20 trading days in a month. At one trade per day max and skipping no edge days, I try to place 10-14 trades per month. I try to aim for a 50-60% win rate using 2 to 1.
Below is examples of 11 trades in August that meet my criteria for a trade and these are trades that I have taken myself
Reversals:
Must be AT/NEAR the High of Day/ Low of Day 30 minutes after NY open
Continuations:
Must be AT/NEAR the 20sma 30 minutes after the open
Out of these 12 trades, there was a total of 24R available. Let's say you mucked up a couple and only won half. 6 winners, 6 losers. You made 6R this month. Not bad.
I want you to really study these setups and make them your own. I follow this same system month in, month out. Every month there is always 10-14 great New York session trades 30 minutes after the open.
Looking ahead in September, I have drawn out the backbone structure of the month. I do not know yet the monthly open as I wait until the first trading day is done. This is for demonstration purposes only.
Your job as a trader is to take the best 10-14 New York trades, 30 minutes after the open. Use strict 2 to 1 and hold until either stopped out or target hit. No breakeven shenanigans. Take the loss like a man. Risk 1.5-2% per trade. Take only one trade per day, win or lose that's it. I can show you the rules to the game, but it is up to you to practice how to play. I can't show you the mental side of things. That takes time. Figure out your weak points and work on them. Patience, Discipline and Strict Risk Management.
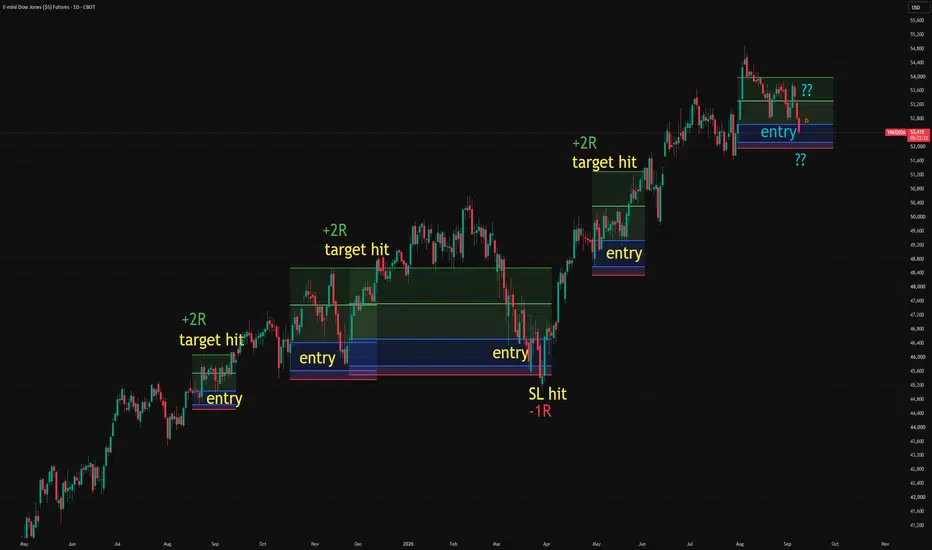
Valuation, zone and seasonality: three quiet votes on Dow futureThe chart is a Dow futures daily: a pullback into the blue demand zone, the top edge aligned with the gap close above.
My reference points:
Entry: the blue zone
Stop: below the red support line
First target: 1R, with room to extend if momentum carries
Valuation
The gauge at the bottom sits in the cheap band. Not a timing tool, but it shifts the asymmetry toward the long side.
Seasonality
The current window has historically skewed long in this contract. The pattern table shows the recent seasonal runs with their historical hit rates — a tailwind, not a promise.
Macro score
Neutral at zero. No direction from the top-down, which is fine: this is a level trade, not a macro call.
Zone, valuation and seasonality line up; the macro stays out of the way. That is the whole setup.
Educational content only. Not investment advice.
Looking to short the Dow - 1H This setup is what my algo finds every day.
Just a few days ago, I traded the same setup but on a lower time frame.
I don't know about you, but to me it is exactly the same setup.
I particularly like this Wash & Rinse. We have first a big range, a sweep to the upside and then a breakdown:
This is a lot of trapped buyers. If price goes up and gives them a chance to get out at breakeven, they are going to be part of what causes the potential imbalance to the downside. They would become buyers selling to get out.
Very easy setup to trade. It is not the best in the world, but it certainly prints money.
US Equities: Cautiously Bullish With Elevated Short-Term RiskWelcome back to the Weekly Forex Forecast for the week of Aug 17-21st.
In this video, we will analyze the following FX market: S&P 500, NASDAQ 100 and The Dow Jones.
Watch the daily/weekly Equilibrium (50% level) of the prior week's trading range. Since the S&P 500 and Nasdaq are extended near premium highs, watch for whether the indices hold their current order blocks or experience a mean reversion pull-back into discount levels early in the week before continuing higher.
The best opportunities will be longs from discount. Aggressive traders may see valid sells to those levels.
Enjoy!
May profits be upon you.
Leave any questions or comments in the comment section.
I appreciate any feedback from my viewers!
Like and/or subscribe if you want more accurate analysis.
Thank you so much!
Disclaimer:
I do not provide personal investment advice and I am not a qualified licensed investment advisor.
All information found here, including any ideas, opinions, views, predictions, forecasts, commentaries, suggestions, expressed or implied herein, are for informational, entertainment or educational purposes only and should not be construed as personal investment advice. While the information provided is believed to be accurate, it may include errors or inaccuracies.
I will not and cannot be held liable for any actions you take as a result of anything you read here.
Conduct your own due diligence, or consult a licensed financial advisor or broker before making any and all investment decisions. Any investments, trades, speculations, or decisions made on the basis of any information found on this channel, expressed or implied herein, are committed at your own risk, financial or otherwise.