GER40:Inverse Head & Shoulders: Breakout Could Target 26,470GER40:Inverse Head & Shoulders: Breakout Could Target 26,470
GER40 is forming a clear Inverse Head & Shoulders pattern on the 4H chart, with the left shoulder, head, and right shoulder visibly established.
Price is now approaching the key neckline around 25,777, which is the main confirmation level for the bullish setup.
A sustained 4H breakout and close above 25,777 could open the way toward the first target at 26,123, followed by the major target around 26,469. A breakout-retest of the neckline could provide additional confirmation before the next leg higher.
Key levels:
🔑 25,777
🎯 26,123
🎯 26,470
⚠️ Failure to break and hold above the neckline could invalidate or delay the bullish scenario.
You can find more details on the chart.
Thank you! 🍀
⚠️PS: Do your own analysis and use your own strategy to join the trade.
❤️ If this analysis helps your trading day, please support it with a like or comment ❤️
In-depth trading ideas
Pullback resistance ahead?DAX40 (DE40) is rising towards the pivot, which has been identified as a pullback resistance that aligns with the 38.2% Fibonacci retracement and could reverse towards the 1st support, which is an overlap support.
Pivot: 25,774.86
1st Support: 25,268.45
1st Resistance: 26,230.07
Disclaimer:
The opinions given above constitute general market commentary and do not constitute the opinion or advice of IC Markets or any form of personal or investment advice.
Any opinions, news, research, analyses, prices, other information, or links to third-party sites contained on this website are provided on an "as-is" basis, are intended to be informative only, and are not advice, a recommendation, research, a record of our trading prices, an offer of, or solicitation for, a transaction in any financial instrument and thus should not be treated as such. The information provided does not involve any specific investment objectives, financial situation, or needs of any specific person who may receive it. Please be aware that past performance is not a reliable indicator of future performance and/or results. Past performance or forward-looking scenarios based upon the reasonable beliefs of the third-party provider are not a guarantee of future performance. Actual results may differ materially from those anticipated in forward-looking or past performance statements. IC Markets makes no representation or warranty and assumes no liability as to the accuracy or completeness of the information provided, nor any loss arising from any investment based on a recommendation, forecast, or any information supplied by any third party.
DAX Free Signal! Sell!
Hello,Traders!
DAX is retracing toward the underside of the broken horizontal supply area after bearish displacement, where mitigation could renew selling toward the marked liquidity objective.
------------------
Stop Loss: 25,913
Take Profit: 25,559
Entry: 25,764
Time Frame: 9H
------------------
Sell!
Comment and subscribe to help us grow!
Check out other forecasts below too!
Heading towards 50% Fib resistance?GER40 is rising towards the resistance level, a pullback resistance that aligns with the 50% Fibonacci retracement and could reverse from this level to our take profit.
Entry: 25,934.99
Why we like it:
There is a pullback resistance level that aligns with the 50% Fibonacci retracement.
Stop loss: 26,240.27
Why we like it:
There is a pullback resistance level.
Take profit: 25,561.08
Why we like it:
There is a pullback support level.
Enjoying your TradingView experience? Review us!
Please be advised that the information presented on TradingView is provided to Vantage (‘Vantage Global Limited’, ‘we’) by a third-party provider (‘Everest Fortune Group’). Please be reminded that you are solely responsible for the trading decisions on your account. There is a very high degree of risk involved in trading. Any information and/or content is intended entirely for research, educational and informational purposes only and does not constitute investment or consultation advice or investment strategy. The information is not tailored to the investment needs of any specific person and therefore does not involve a consideration of any of the investment objectives, financial situation or needs of any viewer that may receive it. Kindly also note that past performance is not a reliable indicator of future results. Actual results may differ materially from those anticipated in forward-looking or past performance statements. We assume no liability as to the accuracy or completeness of any of the information and/or content provided herein and the Company cannot be held responsible for any omission, mistake nor for any loss or damage including without limitation to any loss of profit which may arise from reliance on any information supplied by Everest Fortune Group.
DAX - Technical Analysis
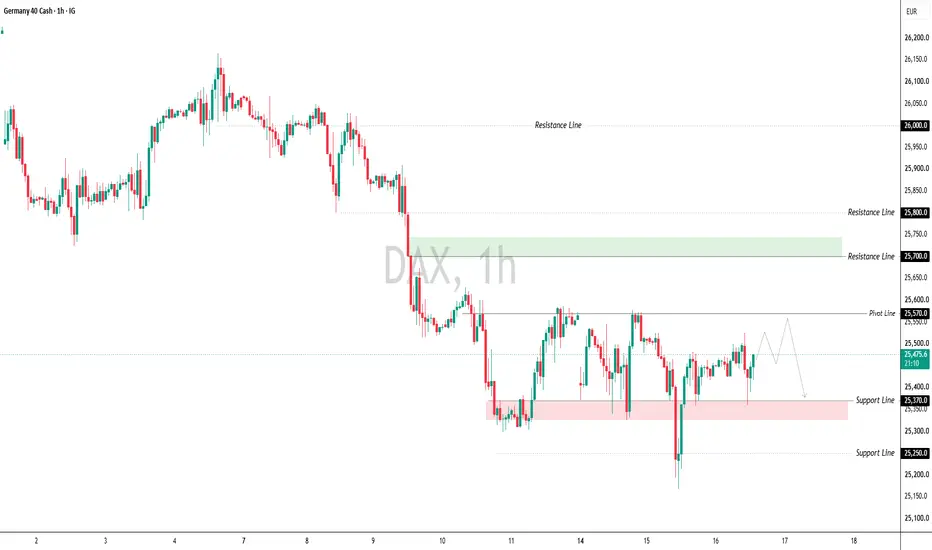
Trading below the 25570 pivot point sustains bearish momentum, targeting the 25370 support level. A breakout below 25370 will extend the decline toward 25250.
Conversely, breaking above the pivot level and holding with a confirmed 1-hour candle close will trigger an upward move toward the resistance lines at 25700 and subsequently 25800.
Resistance Levels: 25700 – 25800
Support Levels: 25370 – 25250
DAX - Technical Analysis
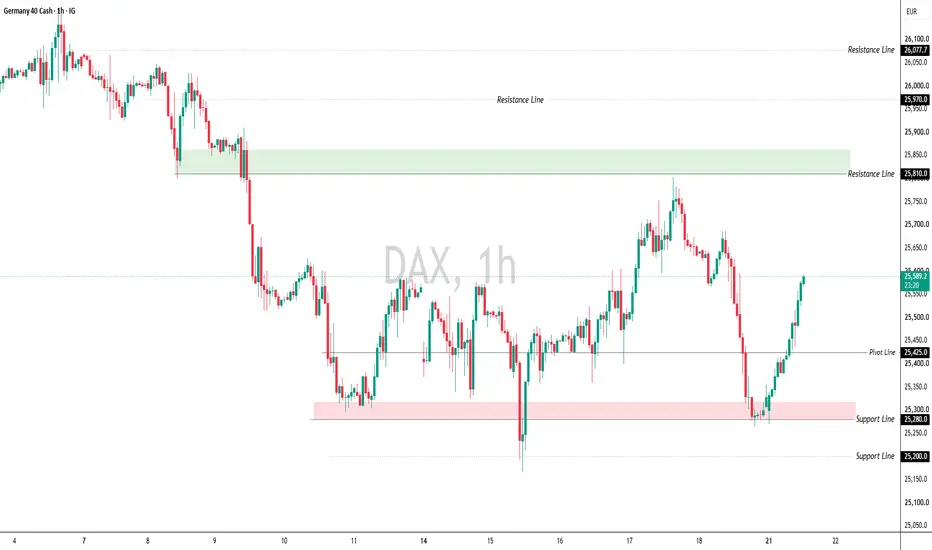
The price is attempting an upside move toward the resistance level at 25810. A breakout above this resistance level will drive the direction further toward 25970.
Conversely, a breakout below the pivot level at 25425 will shift the trend downward toward 25280.
Resistance Levels: 25810 – 25970
Support Levels: 25280 – 25200
DAX - Technical Analysis
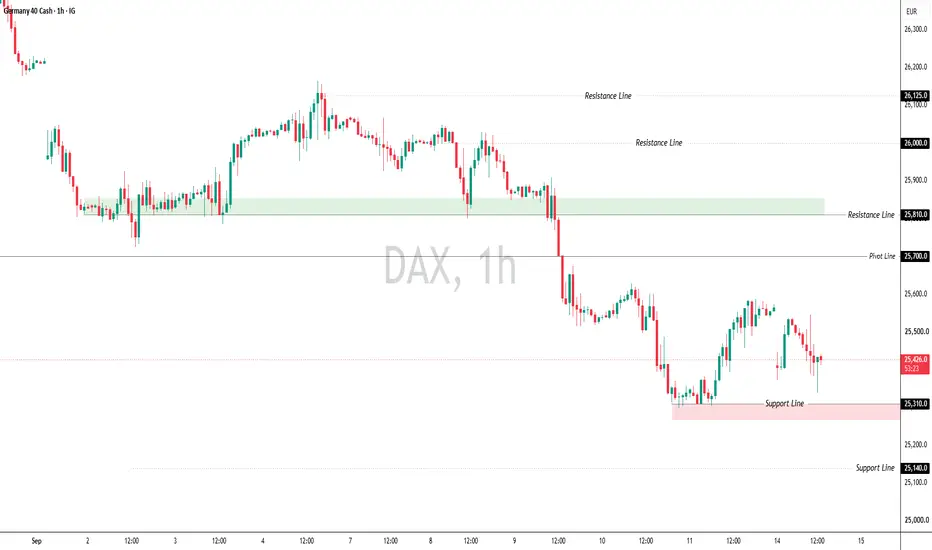
Holding below the 25700 pivot level indicates bearish momentum toward the support levels at 25310 and subsequently 25140.
If the price attempts a bullish recovery and holds above the pivot level with a confirmed 1-hour candle close, the momentum will shift upward toward 25810 and then 26000.
Resistance Levels: 25810 – 26000
Support Levels: 25310 – 25140
DAX 2002 Channel Up calls for massive correction.DAX (DE40) has been trading within a Channel Up since 2002 and the Dotcom crash, a highly symmetrical pattern with clear Tops and Bottoms on key Fibonacci levels.
Right now, while the index is trading within the 0.618 - 0.786 Fibonacci range, a new Sell Signal has already emerged, prompting that we may have already formed such a Top. After all, that Fib Zone has formed all of the market's major cyclical peaks since the 2008 U.S. Housing Crisis. And all of them have targeted the 1M MA50 (blue trend-line) at a minimum, while touching the 0.382 Fib of the Channel.
As you can see, the 1M RSI has already been rejected on its Overbought Resistance Zone since February and is printing a pattern similar to all previous 6 major corrections/ Bearish Legs of the Channel Up. The 'shortest' of those Legs has been -24.58%. Our Target is a little above that and the 0.382 Fib at 21000.
---
** Please LIKE 👍, FOLLOW ✅, SHARE 🙌 and COMMENT ✍ if you enjoy this idea! Also share your ideas and charts in the comments section below! This is best way to keep it relevant, support us, keep the content here free and allow the idea to reach as many people as possible. **
---
💸💸💸💸💸💸
👇 👇 👇 👇 👇 👇
GER30 H4 | Falling Towards Pullback SupportBased on the H4 chart analysis, we can see that the price is falling to our buy entry level at 25,171.07, which is a pullback support that is slightly above the 78.6% Fibonacci retracement.
Our stop loss is set at 24,724.94, which is a pullback support.
Our take profit is set at 25,621.80, which is a pullback resistance level.
High Risk Investment Warning
65% of retail investor accounts lose money when trading CFDs with this provider. You should consider whether you understand how CFDs work and whether you can afford to take the high risk of losing your money.
DAX 40 Market Structure: Bearish Pressure Builds━━━━━━━━━━━
🇩🇪💼 GER40 | GERMANY 40 INDEX CFD 💼🇩🇪
🏴☠️ THE GREAT FRANKFURT HEIST — BEARISH BLUEPRINT 🏴☠️
📉 Day Trade / Swing Trade Opportunity Guide 🎯⏳
━━━━━━━━━━━
Dear Ladies & Gentleman (Thief OG's) 👋🧠💰
Welcome to the Thief Trader war room. The Frankfurt vault is wide open and the GER40 blueprint is locked, loaded, and ready to execute. We are eyeing a short-side opportunity on Germany's flagship index — the GER40 (DAX 40) — and the heist map is drawn. Let's walk through it together, crew.
━━━━━━━━━━━
📡 LIVE MARKET SNAPSHOT — 10 SEPTEMBER 2026 (London Time)
━━━━━━━━━━━
🔹 GER40 (DAX 40) Last Close ~26,008 pts (Tue 9 Sep 2026)
🔹 GER40 All-Time High 26,620 pts (28 Aug 2026)
🔹 GER40 Weekly Change -0.40%
🔹 GER40 Monthly Change -2.19%
🔹 EUR/USD Rate ~1.1644
🔹 Brent Crude Oil ~$101 / bbl (intraday spike)
🔹 US500 (S&P 500) ~7,629 pts (9 Sep 2026 close)
🔹 ECB Deposit Rate (Current) 2.25%
🔹 ECB Rate Decision 🔴 LIVE TODAY +25 bps hike to 2.50% expected (12:15 GMT)
⚠️ HIGH-IMPACT EVENT ALERT: ECB Interest Rate Decision & Press Conference
📅 Date: TODAY — Thursday, 10 September 2026
🕐 Decision: 12:15 GMT | Press Conference: 12:45 GMT (President Lagarde)
⚡ EXPECT EXTREME VOLATILITY — Trade with caution around announcement windows.
━━━━━━━━━━━
🗺️ MY HEIST PLAN — Entry, Vault Targets & Escape Hatch 💰🔐
━━━━━━━━━━━
🚪 ENTRY — OPEN ENTRY (Flexible)
YOU CAN ENTER THE MARKET AT ANY LEVEL — at market, on a pullback into the Police Force zone, on a breakdown candle, or on a retracement. The Thief Trader does not give fixed entry levels. This is YOUR trade. Pick your spot, read your momentum, and confirm your signal before pulling the trigger. Day traders can scalp entries on the 15M or 1H chart; swing traders can position from the 4H or daily.
🏦 VAULT — PROFIT TARGET ZONES (Thief OG's Escape Route)
At the major support zone below current price — which is acting as a strong demand floor, combined with oversold conditions, trapped long positions, and a high-probability reversal cluster — the Police Force down there is ready to push back hard against the sellers. Do NOT overstay your welcome. When the price hits these vaults, pack your loot and escape.
🎯 PRIMARY TARGET (Day Traders) — 25,300 pts
🎯 MAIN / FINAL TARGET (Swing Traders) — 25,000 pts
⚠️ Dear Ladies & Gentleman (Thief OG's) i'am not recommended to set only my TP. its your own choice you can make money then take money at your own risk.
🚨 ESCAPE HATCH — Stop Loss (Thief SL)
🛑 Thief SL @ 25,900 pts (above the Police Force resistance zone)
⚠️ Dear Ladies & Gentleman (Thief OG's) i'am not recommended to set only my SL. its your own choice you can make money then take money at your own risk.
📌 Position Management Tips for the OG Crew:
- Day Traders: Scale out 50% at 25,300 and trail the rest toward 25,000
- Swing Traders: Hold with patience and exit in full near 25,000 vault zone
- Move stop to breakeven once price moves 200–300 pts in your favour
- Do NOT hold through the ECB press conference without a tight plan — volatility is extreme
━━━━━━━━━━━
📋 POSSIBLE SCENARIO — What Could Happen Next? 🔮
━━━━━━━━━━━
📉 BEARISH SCENARIO (Primary Bias):
Price continues its descent from the 26,620 all-time high. The 25,900 Police Force level holds as resistance on any bounce attempt. Momentum carries price toward 25,300 (Primary Target) and then 25,000 (Final Vault). A confirmed ECB rate hike today combined with hawkish forward guidance could accelerate the selloff. Industrials and banks continue to lead losses as higher rates and elevated oil prices squeeze margins.
📈 BULLISH SCENARIO (Counter-Bias — Watch Out):
If the ECB surprises with a softer tone or signals a pause after today's hike, markets could interpret this as the end of the tightening cycle — triggering a sharp relief rally. A reclaim and close above 26,200–26,300 on the daily chart would invalidate the bearish descending channel and potentially open a retest of 26,620 highs. SAP, RWE, and E.ON — which have been the index's strongest components — could lead a recovery if energy stocks outperform.
➡️ SIDEWAYS SCENARIO (Consolidation):
Price chops between 25,900 (resistance) and 25,300 (support) in a tight holding pattern ahead of or following the ECB decision. This would represent a technical consolidation before the next directional move. Day traders could range-trade this zone; swing traders should wait for confirmation of breakout direction.
━━━━━━━━━━━━━━━━━━━━━━━━━━━━━━━━━━━━━━━━━━━━━━━━━━━━━━
📰 FUNDAMENTAL & ECONOMICS BREAKDOWN — What The Market Says 🌍💹
━━━━━━━━━━━━━━━━━━━━━━━━━━━━━━━━━━━━━━━━━━━━━━━━━━━━━━
This section reflects actual live market conditions — both bullish and bearish drivers — as reported by the market. This is what the data says, independent of trade direction.
─────────────────────────────
🔴 BEARISH FUNDAMENTAL DRIVERS
─────────────────────────────
🛢️ OIL PRICE SURGE — THE BIG THREAT:
Brent Crude has surged to ~$101 per barrel, briefly breaching the $100 mark for the first time since late July 2026. The escalation of US-Iran military clashes in the Gulf — including the US military striking five Iranian crude oil tankers — has dramatically tightened global energy supply expectations. For Germany, a net energy importer with a heavy industrial base (Chemicals, Autos, Manufacturing), this is a direct margin squeeze. Energy-intensive sectors like industrials are already leading DAX losses.
🏦 ECB HAWKISH RATE HIKE — LIVE EVENT TODAY:
The ECB is widely expected to raise its Deposit Facility Rate by 25 basis points to 2.50% at today's decision (12:15 GMT, 10 September 2026). This would mark the second rate hike of 2026, with markets now pricing two ECB rate hikes for the full year and a terminal deposit rate of ~3.1% by late 2027. Higher rates increase the discount rate on future corporate earnings — mechanically reducing equity valuations across the DAX 40 universe. The ECB's own staff projections (to be released today) will be closely scrutinised for updated growth and inflation forecasts.
📉 EUROZONE INFLATION STILL ELEVATED:
Eurozone HICP inflation reached 3.3% in August 2026, with energy inflation surging to 14.3% year-on-year. Germany's CPI reached 2.8% in July after the expiration of the fuel tax rebate, above the ECB's 2% target. Core inflation, which strips out food and energy, climbed to 2.5%, signalling that price pressures are broadening beyond just energy — this keeps the ECB in tightening mode.
📊 GERMAN ECONOMIC GROWTH UNDER PRESSURE:
Germany's GDP growth is forecast at just +0.4% to +0.9% for full-year 2026 — the weakest of any major eurozone economy. Germany's unemployment rose by 71,000 in July 2026, surpassing 3 million unemployed (unemployment rate: 6.4%). The ECB's Survey of Professional Forecasters placed eurozone GDP growth for 2026 at just 0.9%, revised lower due to the energy shock from the US-Iran war. Weak growth combined with high inflation (stagflation-lite) is historically toxic for equity index performance.
📊 BOND YIELDS AT 15-YEAR HIGHS:
German 10-year Bund yields have reached a 15-year high, directly raising the discount rate for German equities and making fixed income more attractive relative to stocks. This is a structural headwind for the DAX 40.
📉 STOCK-SPECIFIC PRESSURE:
Rheinmetall fell 3.16%, Beiersdorf dropped ~2% after Deutsche Bank downgraded to Sell, Deutsche Boerse declined 1.7% after announcing a €600 million convertible bond. These are heavyweight DAX components and their weakness drags the index.
─────────────────────────────
🟢 BULLISH FUNDAMENTAL DRIVERS
─────────────────────────────
💪 GERMAN FISCAL EXPANSION:
Germany's constitutional reform from March 2025 unlocked a major fiscal expansion program. Government spending is a positive growth tailwind for corporate Germany, particularly for infrastructure, defence, and clean energy companies in the DAX.
📈 GERMAN GDP UPGRADE — IFO AUTUMN FORECAST:
The ifo Institute (September 2026 Autumn Forecast) raised Germany's 2026 GDP growth estimate to +1.4% — a significant +0.6 percentage point upgrade from their summer forecast. Germany's recovery forces are gaining momentum, powered by fiscal stimulus and growing international demand.
🌍 EXPORT RESILIENCE:
A weaker Euro (EUR/USD ~1.1644 vs recent highs) actually supports German exporters by making their goods cheaper in global markets. DAX heavyweights like SAP, Siemens, BMW, and Volkswagen benefit from currency weakness — this is a structural bullish offset.
⚡ ENERGY SECTOR UPSIDE:
Higher oil prices hurt industrials but benefit energy producers and utilities within the DAX. RWE (+1.65%) and E.ON (+1.50%) were among the top DAX gainers on 9 September, providing a partial offset to index losses.
🏁 END OF RATE HIKE CYCLE SPECULATION:
Some analysts see today's hike as potentially the last of the current cycle, given that "underlying inflation measures have continued to ease" and "wage pressures remain relatively contained." If Lagarde signals a prolonged hold after today, this could trigger a sharp bullish relief rally for European equities.
━━━━━━━━━━━
👁️ AREAS I AM WATCHING — Correlated Pairs & Markets 🔭📌
━━━━━━━━━━━
The GER40 does not trade in isolation. These correlated markets give us confirmation, divergence signals, and early warning signs. Always cross-reference before sizing your position.
─────────────────────────────────────────────────────────
📊 EUR/USD (Euro / US Dollar) — "The Fiber"
💵 Current Rate: ~1.1644
🔗 Correlation: INVERSE to GER40 (generally)
Key Point: A stronger Euro raises export costs for German blue chips and can drag on DAX performance. A weaker EUR/USD supports export earnings. With the ECB hiking today, EUR/USD may initially spike — which could cap any DAX recovery attempt. If EUR/USD breaks above 1.1700 decisively, expect DAX to face added headwinds from the currency channel. If EUR/USD softens post-ECB, it could temporarily cushion DAX downside.
─────────────────────────────────────────────────────────
📊 UK100 (FTSE 100) — "The British Bulldog"
🔗 Correlation: POSITIVE to GER40
Key Point: Europe's two heavyweight indices — DAX and FTSE — historically track each other under risk-on and risk-off conditions. When the DAX has extended losses over consecutive sessions, the UK100 usually begins to wobble too. If GER40 breaks below 25,600, watch the UK100 for sympathy weakness. A UK100 break below its own support levels would add bearish confluence to the GER40 setup.
─────────────────────────────────────────────────────────
📊 US30 (Dow Jones Industrial Average) — "Wall Street's Big Dog"
🔗 Correlation: POSITIVE to GER40
Key Point: The US30 declined alongside European markets on 9 September 2026, falling ~396 points (-0.36%) as higher Treasury yields and oil prices hit sentiment globally. Rising US bond yields — now at 52-week highs — are being driven by the same energy-inflation dynamic hitting European markets. If the Fed meeting next week delivers a hawkish surprise, US30 downside will spill over into GER40 weakness. Watch for US30 below its key moving average support for confirmation.
─────────────────────────────────────────────────────────
📊 US500 (S&P 500) — "The Big Board"
🔗 Correlation: POSITIVE to GER40
Current Level: ~7,629 (9 Sep 2026 close, -0.58% session)
Key Point: The US500 is also in a shallow pullback after its own recent highs, declining -1.60% over the past month. A continued US500 selloff driven by tech weakness (Alphabet -3.18%, Salesforce -3.01%) reduces risk appetite globally and puts selling pressure on the GER40. These two indices are locked in a risk-sentiment feedback loop — watch them together.
─────────────────────────────────────────────────────────
📊 USOIL / WTI Crude Oil — "The Black Gold Factor"
🔗 Correlation: INVERSE (high oil = bad for DAX industrials)
Current Level: Brent ~$101/bbl; WTI approaching $100
Key Point: The most critical macro input for the GER40 right now. Surging oil prices from US-Iran conflict escalation squeeze German industrial profit margins, fuel inflation, and force the ECB to keep hiking. Every $5/bbl increase in Brent is an additional headwind for energy-intensive DAX sectors. If Brent holds above $100 through October, the GER40 faces a structural ceiling.
─────────────────────────────────────────────────────────
📊 XAU/USD (Gold / US Dollar) — "The Safety Magnet"
🔗 Correlation: INVERSE to risk assets including GER40
Key Point: In a risk-off environment, capital flows FROM equity indices INTO gold. Rising geopolitical tensions (US-Iran war, Strait of Hormuz disruptions), soaring oil prices, and hawkish central banks are all classic gold-buying catalysts. A sustained gold rally above its recent highs would be a strong confirmation that risk-off is dominating — and that the GER40 short setup is gaining macro tailwind. Monitor gold closely as a sentiment indicator.
─────────────────────────────────────────────────────────
━━━━━━━━━━━
🎓 EDUCATIONAL BREAKDOWN — Understanding the GER40 / DAX 40 🏫📚
━━━━━━━━━━━
WHAT EXACTLY IS THE GER40 (DAX 40)?
The GER40 — also known as the DAX 40 or simply the DAX — is Germany's premier stock market index, tracking the 40 largest and most liquid blue-chip companies listed on the Frankfurt Stock Exchange (Deutsche Börse). Think of it as Germany's answer to the Dow Jones or the UK100 — it is the heartbeat of the German and, by extension, the broader European economy.
The index is calculated using a free-float, market-capitalisation-weighted methodology, meaning only publicly tradable shares count toward a company's weighting. Companies must maintain a minimum 10% free float, demonstrate adequate liquidity, and meet strict financial reporting standards to qualify for inclusion. The composition is reviewed quarterly.
The GER40 accounts for roughly 80% of Germany's total market capitalisation — making it far more representative of the economy than most global indices. The index spans sectors including Financials, Industrials, Technology, Healthcare, Chemicals, Autos, and Utilities. Key components include SAP (Germany's tech giant), Siemens, BMW, Volkswagen, Allianz, Deutsche Bank, Rheinmetall, RWE, and E.ON.
WHY DOES THE GER40 MATTER FOR GLOBAL TRADERS?
🔹 It is the most-watched index in continental Europe.
🔹 It serves as a real-time barometer for European economic health.
🔹 It is highly sensitive to energy prices — Germany is one of the largest industrial economies in the world and a net energy importer, making it disproportionately affected by oil and gas price swings.
🔹 The EUR/USD exchange rate directly influences GER40 corporate earnings — a weaker Euro boosts export competitiveness; a stronger Euro compresses margins.
🔹 ECB monetary policy decisions move the GER40 violently — rate hikes raise borrowing costs and reduce the present value of future corporate earnings.
🔹 Geopolitical events in energy-producing regions (Middle East, Russia) create outsized volatility in the GER40 versus other global indices.
HOW IS THE GER40 CFD DIFFERENT FROM THE UNDERLYING INDEX?
When you trade GER40 as a CFD (Contract For Difference), you are not buying the underlying shares of the 40 companies. Instead, you are speculating on the price movement of the index. CFDs allow you to go long (buy) OR short (sell), use leverage, and trade outside of traditional Frankfurt Stock Exchange hours. However, CFD trading amplifies both gains AND losses — this is why disciplined position sizing, a defined stop loss (Thief SL), and clear profit targets (Vault levels) are essential. Never oversize. Never trade without a plan. The Thief Trader way is: Plan the heist first, execute second, escape with the loot third. 🏴☠️
━━━━━━━━━━━
💬 THIEF TRADER MOTIVATION — From The Boss To The OG Crew 🏆🔥
━━━━━━━━━━━
"The market is the most expensive classroom in the world. Every candle is a lesson. Every loss is tuition. Every winning trade is proof that your education is paying off." — Thief Boss 🎓
"A good thief never rushes the vault. A great thief waits until the alarm is off, the guards are distracted, and the timing is perfect. Trade like a great thief." — Thief Boss 🏴☠️
"Risk management isn't the boring part of trading. It IS trading. The trade setup is just the heist plan. Protecting your capital is the escape route. Always know your exit before you enter." — Thief Boss 🚪💨
Stay disciplined, Thief OG's. The market rewards patience. 🙌
━━━━━━━━━━━
🤝 JOIN THE HEIST CREW — Community Call To Action 📣
━━━━━━━━━━━
If this idea gave you value, fuel the crew!
👍 BOOST this idea to keep the Thief Trader signal strong on TradingView!
❤️ LIKE to show your OG crew love!
🔔 FOLLOW @ThiefTrader so you never miss the next heist blueprint!
💬 COMMENT your entry level, your take, your questions — let's build together!
The Thief Trader community is built on SHARING knowledge, not hoarding it.
Every boost, every like, every comment helps more traders find these setups.
Be part of the crew. Power the mission. 🏴☠️💼
DAX Critical make-or-break test on the 1D MA100DAX (DE40) has been trading within a 5-month Channel Up since early April and yesterday it almost hit its bottom (Higher Lows trend-line). With the 1D MA100 (green trend-line) exactly on that bottom trend-line, it is highly likely to see a new Bullish Leg emerging, targeting at least 27200, a +7.60% rise similar to all 4 previous Legs.
If on the other hand the 1D MA100 breaks, the pattern could shift to a Top Arc formation similar to January - February that led to a 1W MA100 (red trend-line) crash. In that case, the Target should be 23600.
---
** Please LIKE 👍, FOLLOW ✅, SHARE 🙌 and COMMENT ✍ if you enjoy this idea! Also share your ideas and charts in the comments section below! This is best way to keep it relevant, support us, keep the content here free and allow the idea to reach as many people as possible. **
---
💸💸💸💸💸💸
👇 👇 👇 👇 👇 👇
GER40 (DAX 40): Structural Pullback & Key Target Roadmap━━━━━━━━━━━━━━━━
🇩🇪💼 GER40 | GERMANY 40 INDEX CFD 💼🇩🇪
🏴☠️ THE GREAT FRANKFURT VAULT RAID — BULLISH BLUEPRINT 🏴☠️
📈 Day Trade / Swing Trade Opportunity Guide 🎯⏳
━━━━━━━━━━━━━━━━
Dear Ladies & Gentleman (Thief OG's) 👋🧠💰
Welcome to the Thief Trader war room — Frankfurt edition.
The GER40 vault is cracked open and the blueprint is live.
We're locking in a bullish operation on one of the most-watched
indices on the planet. Gear up. The heist is on. 🚀🔐
━━━━━━━━━━━━━━━━
📊 LIVE MARKET SNAPSHOT — GER40 / DE40 "GERMANY 40" INDEX CFD
━━━━━━━━━━━━━━━━
🕐 Data Verified: Thursday, 17 September 2026 — London Time (BST)
📍 Asset: GER40 / DE40 — Germany 40 Index CFD (Frankfurt Stock Exchange / Xetra)
💹 Current Price: ~25,450 – 25,560 (CFD prices vary by provider — verify with your broker)
📈 Today's Session Range: 25,361 – 25,612
🔺 All-Time High: 26,618.74 (recorded 28 August 2026)
📉 52-Week Low: 21,863.81
🧭 Trend Direction (Daily): Bullish pullback — reloading at moving average confluence
📊 Direction Bias (Thief Trader): BULLISH 🟢
━━━━━━━━━━━━━━━━
🎯 MY MARKET BIAS
━━━━━━━━━━━━━━━━
My market bias on GER40 is BULLISH for this setup.
The bias is supported by a Daily timeframe confirmation where price
is printing a moving average pullback — one of the cleanest
reversal signals in technical analysis when combined with the
broader structural trend.
The structural case remains bullish as long as GER40 holds above
the key channel support zone. A confirmed bounce with body closes
above the day's moving average region confirms long-side momentum.
Entry is most favourable during the pullback, not the chase.
This is not a blind long — it is a disciplined, confirmation-based
bullish play aligned with the dominant trend of the index.
━━━━━━━━━━━━━━━━
📐 POSSIBLE SCENARIO — THE FRANKFURT HEIST PLAN 🏴☠️
━━━━━━━━━━━━━━━━
💡 POSSIBLE SCENARIO — BULLISH PULLBACK CONTINUATION:
Price is currently inside a high-probability reaction zone after
pulling back from the August ATH. If daily moving average support
holds, price prints a bullish rejection candle or structure break
on lower timeframes — the setup triggers a continuation leg toward
the 26,000 vault, and beyond that the police force zone at 26,500.
📌 Primary Bullish Path:
→ Price finds support at moving average zone (~25,200–25,400)
→ Lower timeframe (15m / 30m) confirms bullish reversal signal
→ Price pushes through minor resistance at 25,600–25,800
→ First vault raid at 26,000 ✅
→ Momentum extension toward the main vault / final escape point at 26,500 🏆
→ POLICE FORCE zone at 26,500 — strong resistance cluster, overbought
conditions, institutional trap zone and potential reversal area —
THIS IS WHERE THE THIEF ESCAPES WITH THE LOOT 💼💰
📌 Alternative / Invalidation Scenario:
→ Price fails to hold the moving average cluster
→ Break below 24,800–24,600 on a daily close signals caution
→ Deeper pullback toward 23,800–23,400 channel support remains
possible if macro conditions deteriorate sharply
━━━━━━━━━━━━━━━━
🔑 HEIST ENTRY PLAN — LAYERED LOADING STRATEGY 🧱
━━━━━━━━━━━━━━━━
📌 Entry Type: Bullish Layered / Scaled Entry
💡 "The vault is open 24/7 — Thief enters at any time! 🔓💰"
→ Deploy multiple buy limit orders across the moving average
pullback zone on the 15m–30m chart.
→ Load entries at recent swing lows and structure support levels.
→ Each entry at a better price = a lower average and a wider
profit margin — this is the Thief's edge.
→ Set price alerts at the key decision zones and be ready.
→ Be early. Be patient. Be precise.
━━━━━━━━━━━━━━━━
🎯 ESCAPE TARGETS — THE VAULT LOCATIONS 💰
━━━━━━━━━━━━━━━━
🏆 1st Target (First Vault) ————————————— 26,000 🔓
🏆 MAIN / FINAL Target (Police Force Zone) —— 26,500 🚔
⚠️ Why the Police Force guards 26,500:
The 26,500 zone sits just below the all-time high of 26,618. This
level is a convergence of strong historical resistance, overbought
momentum signals, and institutional distribution potential. Smart
money has been known to reverse price sharply at this zone. The
police are waiting. Grab the loot and run! 🏃♂️💨
━━━━━━━━━━━━━━━━
⚠️ TP DISCLAIMER — READ THIS, THIEF OG's ⚠️
━━━━━━━━━━━━━━━━
Dear Ladies & Gentleman (Thief OG's) — I am NOT recommending you
set only my TP levels. These are reference points on the map, not
a mandate. It is YOUR own choice. You can make money, then TAKE
money — at your own risk. Partial exits, trailing stops, booking
at structure — all valid. Manage your trade YOUR way. 💼🔥
━━━━━━━━━━━━━━━━
🛡️ THIEF STOP LOSS — THE ESCAPE HATCH 🚪
━━━━━━━━━━━━━━━━
🔐 Thief SL Reference: @ 22,500
(Positioned beneath the key structural swing low zone — below the
4H channel support base and significant multi-month demand level)
Adjust your SL based on your lot size, number of active entries,
and personal risk tolerance. Protect the crew first. Always.
━━━━━━━━━━━━━━━━
⚠️ SL DISCLAIMER — READ THIS, THIEF OG's ⚠️
━━━━━━━━━━━━━━━━
Dear Ladies & Gentleman (Thief OG's) — I am NOT recommending you
set only my SL. It is YOUR own choice. You can make money, then
TAKE money — at your own risk. Know your exposure. Protect your
account first. The heist only works when the crew comes home safe.
━━━━━━━━━━━━━━━━
👀 AREAS I AM WATCHING
━━━━━━━━━━━━━━━━
🔎 Key Structural Zones on My Radar:
— 25,200 – 25,400 ➤ Daily moving average confluence zone —
critical pullback support. Bull case hinges on this holding.
— 25,600 – 25,800 ➤ Minor intraday resistance cluster. Clean
break above this confirms the bullish reload is complete.
— 26,000 ➤ First vault / Round number resistance / Previous
minor swing area — expect price reaction here. Partial booking zone.
— 26,500 ➤ Police force zone — the final vault. Overbought,
over-extended, institutional supply zone. Exit / escape area.
— 26,618 ➤ All-Time High — the ceiling of the house. Respect it.
— 24,800 – 24,600 ➤ Invalidation level for the bullish scenario.
Daily close below here would signal caution for longs.
— 23,400 – 23,800 ➤ Deeper channel support floor. Not in immediate
play, but a critical watch zone if bearish pressure increases.
I am also watching:
→ US Dollar Index (DXY) — a stronger dollar post-Fed tends to
weigh on risk assets and global equities including GER40
→ EUR/USD — currently near 1.1460 post-Fed hike; EUR weakness can
be a mixed signal for German exporters (cheaper exports, but
reduced purchasing power)
→ Bond yields (German 10-yr Bund: ~3.55% — 17-year high) — rising
yields increase the cost of capital and can pressure equity multiples
→ Crude Oil — Brent above $100/barrel is a macro headwind for
European equities via inflationary cost pressure
━━━━━━━━━━━━━━━━
🌍 CORRELATED PAIRS & MARKETS TO WATCH 🔗
━━━━━━━━━━━━━━━━
These are the markets running alongside our GER40 heist. Watch
them. They tell the story the candles sometimes can't. 📖
— EUR/USD ≈ $1.1460 💶
The euro is under pressure post-Fed hike and after the ECB's
own 25 bps hike to 2.50%. A weaker EUR is a DOUBLE-EDGED signal
for GER40: cheaper German exports benefit major DAX constituents
(Siemens, BASF, Volkswagen) but signals risk-off macro sentiment.
EUR/USD dropping below 1.1400 would be a bearish signal for the
broader European risk environment. If EUR/USD recovers above
1.1550–1.1600, this is a tailwind for GER40 bulls.
— UK100 / FTSE 100 ≈ £10,687 📊
GER40 and UK100 share a strong POSITIVE correlation — they are
both European equity benchmarks responding to similar macro
drivers (ECB, Fed, risk sentiment, oil prices, bond yields).
FTSE strength = GER40 tailwind. FTSE weakness = watch out.
Today's BoE decision is a major catalyst — a hold or dovish tone
supports European equities broadly.
— CAC 40 (France 40) ≈ ~8,111 🇫🇷
Direct European peer. CAC 40 moves closely with GER40 on risk
macro events. A CAC 40 rally confirms regional risk-on momentum.
A CAC 40 sell-off warns that the GER40 bullish play faces
regional headwinds. Watch the pair as a real-time confirmation signal.
— US30 / Dow Jones ≈ $52,407 🇺🇸
GER40 has a POSITIVE correlation with Wall Street — US30 and S&P
500 sentiment bleeds into European morning sessions. A positive
US30 close boosts Frankfurt open sentiment. Post-Fed hike, US
markets held firm (S&P 500 up 0.4%) — a constructive signal for
GER40 bulls going into the European session.
— GBP/USD ≈ $1.3389 💷
Cable reflects global USD strength. A falling GBP/USD signals
broad dollar dominance — this tends to be a BEARISH input for
European equities. GBP/USD has slipped below 1.3400 post-Fed,
adding to the cautious risk backdrop.
— USD/JPY ≈ ~158–160 area 🇯🇵
A rising USD/JPY reflects USD strength and risk-on global
appetite — often mildly POSITIVE for equities including GER40.
However, extreme USD/JPY gains (above 160) can trigger yen
intervention concerns, destabilising global risk markets broadly.
— XAU/USD (Gold) ≈ ~$4,250–$4,360 area 🥇
Gold is inversely correlated to risk equity indices like GER40.
Gold fell after the Fed hike — this is a PRO-RISK signal and
broadly supports the GER40 bullish case. If Gold rallies sharply
from here, monitor for safe-haven rotation OUT of equities.
— Brent Crude Oil ≈ $100+ per barrel 🛢️
Oil above $100 is a persistent macro headwind for GER40 —
it drives input cost inflation, pressures corporate margins,
and keeps ECB and Fed policy hawkish. Watch $105 as the
next critical level — a sustained break above that level
could amplify selling pressure on European equities.
━━━━━━━━━━━━━━━━
🌐 FUNDAMENTAL & ECONOMIC FACTORS — NEUTRAL ANALYSIS 📰
━━━━━━━━━━━━━━━━
⚠️ This section reflects ACTUAL market conditions only —
presented neutrally. Bullish AND bearish drivers included.
The market says what the market says. 📊
- - - - - - - - - - - - - - - - - - - - - - - - - - - - -
🟢 BULLISH DRIVERS / SUPPORTIVE FACTORS
- - - - - - - - - - - - - - - - - - - - - - - - - - - - -
→ 🏗️ Germany's €500B Infrastructure Investment Fund
Approved in early 2026, this is the largest fiscal stimulus
in German post-war history. Capital deployment into defence,
infrastructure, and energy transition is a multi-year structural
tailwind for DAX industrials, defence names, and utilities.
Stocks like Siemens Energy (+69.5% YoY), Infineon (+76.3% YoY)
reflect early beneficiary pricing.
→ 📈 German GDP Growth Recovery Expected at +1.5% for 2026
After two years of recession in 2023–2024 and near-zero growth
in 2025, Germany's KfW research institute projects +1.5% GDP
growth for 2026 — a genuine recovery narrative that supports the
earnings case for DAX constituents.
→ 🏭 Improved German Economic Sentiment
Several German economic research institutes significantly raised
their forecasts in early September 2026, citing stronger-than-
expected exports and a less severe impact from the Iran conflict
than originally anticipated. The ifo Business Climate Index rose
to 88.8 in August (from 86.7 in July) — a constructive data point.
→ 🤖 AI and Tech Sector Momentum
Tech and AI-linked names within the DAX (Siemens, Infineon,
SAP on recovery days) are absorbing institutional capital flows.
Hochtief, Infineon and Siemens Energy were the top DAX gainers
on September 16, rising between 1.7% and 3.2% in a single session.
→ 🏦 GER40 Global Revenue Base = Domestic Weakness Insulation
The majority of large DAX companies earn most of their revenue
outside Germany. This decouples index performance from weak
German domestic fundamentals — a key structural argument for
GER40 bulls even when German retail or manufacturing data is soft.
→ 🌍 Post-ATH Pullback = Value Re-Entry Zone
The index pulled back ~4.5% from the August 28 ATH of 26,618.
Historical data shows that the DAX's 5-month Channel Up structure
(April–September 2026) has produced strong bullish legs off
moving average pullback zones — structurally this is a
high-probability reload area for bulls.
→ 🛡️ European Defence Rearmament Demand
NATO's 2% GDP defence commitment is driving German defence-linked
spending — a genuine multi-year earnings tailwind for Industrials.
- - - - - - - - - - - - - - - - - - - - - - - - - - - - -
🔴 BEARISH DRIVERS / RISK FACTORS
- - - - - - - - - - - - - - - - - - - - - - - - - - - - -
→ 🏦 Fed Hike to 3.75%–4.00% — First Since 2023
The FOMC unanimously raised the Fed Funds rate by 25 bps on
September 16, 2026 — the first US rate hike since July 2023.
Fed Chair Kevin Warsh stated inflation remains elevated and
signalled at least one more hike this year. The September dot
plot projects a median year-end rate of 4.1%, up from 3.8%
in June. A hawkish Fed = stronger USD = tighter global financial
conditions = headwind for equity multiples.
→ 🇩🇪 ECB Deposit Rate Now at 2.50% — Hike Cycle Active
The ECB raised its deposit rate to 2.50% in September 2026 —
second hike this year. Markets are pricing the ECB deposit rate
at ~2.90% by December 2026, with potential for 3.40% by late
2027. Rising borrowing costs squeeze corporate investment and
consumer spending across the Eurozone.
→ 📊 German 10-Year Bund Yield at ~3.55% — Highest Since 2009
Rising Bund yields increase the discount rate applied to equity
cash flows, mechanically compressing valuation multiples.
Financials benefit but growth/tech and high-multiple sectors
face structural headwinds.
→ 💰 German Inflation: HICP at 2.9% (August 2026)
Inflation ticked higher month-on-month, from 2.8% in July to
2.9% in August. Core HICP (ex-food and energy) remains at 2.6%.
Persistently above-target inflation keeps ECB policy hawkish.
Final August HICP figures release on 17 September 2026.
→ 🛢️ Brent Crude Oil Above $100/Barrel
Elevated oil prices — fuelled by the ongoing US-Iran Gulf conflict
— are squeezing corporate margins across energy-intensive German
sectors (autos, chemicals, manufacturing) and driving broader
inflationary pressure across the Eurozone.
→ 🏭 Germany Manufacturing PMI Remains Below 50
Manufacturing PMI has been in contraction territory for much of
2025–2026. Germany's industrial heartland continues to face
structural challenges: high energy costs, excessive bureaucracy,
weak competitiveness, and the EV transition disrupting the
automotive supply chain.
→ 🌍 US-EU Tariff Uncertainty
US tariffs on EU goods are currently set at a 15% baseline rate
with steeper sector-specific levies on steel, aluminium, and
automobiles. This is a direct earnings headwind for Siemens,
automakers, and the broader German industrial supply chain.
→ 🌐 ZEW Eurozone Sentiment: 25.8 vs 39.9 Expected
The ZEW survey of Eurozone investor sentiment fell sharply to
25.8 in September versus a forecast of 39.9 — a significant
miss that signals deteriorating investor confidence in the
near-term Eurozone economic outlook.
→ 🔄 EUR/USD at ~1.1460 — Multi-Week Lows Post-Fed
EUR/USD has broken below its moving averages for the first time
since late July. The pair is now below both the 50-day and 200-day
EMAs, with RSI near 31.9 — reflecting persistent USD dominance
and bearish Euro momentum in the near term.
━━━━━━━━━━━━━━━━
📅 ECONOMIC CALENDAR — UPCOMING HIGH-IMPACT EVENTS 🔔
━━━━━━━━━━━━━━━━
All times in London Time (BST) 🇬🇧
🔴 HIGH IMPACT — TODAY / IMMINENT:
📌 17 Sep 2026 — Germany HICP Final (August) | 09:00 BST
Final confirmation of Germany's August inflation reading
(preliminary: +2.9% YoY, Core: +2.6%). A higher-than-expected
print increases ECB hawkish pressure. A softer print would ease
yields and be mildly supportive for GER40.
📌 17 Sep 2026 — Bank of England (BoE) Rate Decision | 12:00 BST
BoE holds Bank Rate at 3.75%. All eyes on forward guidance.
A hawkish BoE signal supports GBP/USD recovery and broader
European risk sentiment. A dovish hold could weigh on GBP.
📌 17 Sep 2026 — US Initial Jobless Claims | 13:30 BST
First major US data post-Fed hike. A weak labour market reading
(rising claims) could reduce the probability of the next Fed hike
— a potential short-term tailwind for equities. A strong reading
(falling claims) supports further Fed tightening — dollar bullish,
risk-asset cautious.
📌 17 Sep 2026 — US Philly Fed Manufacturing Index | 13:30 BST
Regional manufacturing health check. Below zero = contraction.
Watch as an early indicator of US economic resilience post-hike.
📌 17 Sep 2026 — ECB's Philip Lane Speech | 07:00 BST
ECB Chief Economist Lane speaks after the Eurozone's final
August inflation release. Any hawkish signal on October hike
probability would boost EUR and Bund yield expectations.
🟡 MEDIUM IMPACT — UPCOMING:
📌 Oct 2026 — ECB Rate Decision
Markets pricing ~78% probability of another 25 bps ECB hike
in October (deposit rate to 2.75%). A confirmed hike = tighter
financial conditions, but EUR supportive. A hold = Euro bearish.
📌 Oct–Nov 2026 — Germany Federal Budget Announcement (Q3 2026)
Sets the pace of deployment for the €500B infrastructure fund.
Faster-than-expected spending deployment = GER40 industrials
tailwind. Delayed or reduced deployment = structural headwind.
📌 Nov 2026 — FOMC Meeting (Next Fed Decision)
Dot plot signals at least one more US rate hike possible.
Markets watching for confirmation or reversal of hawkish bias.
━━━━━━━━━━━━━━━━
📚 EDUCATIONAL BREAKDOWN — THIEF TRADER MASTERCLASS 🎓
━━━━━━━━━━━━━━━━
📖 LESSON: HOW TO TRADE THE MOVING AVERAGE PULLBACK ON A DAY CHART
The Moving Average Pullback is one of the cleanest high-probability
setups in technical analysis — and it's exactly what we're targeting
on GER40 today. Here's why it works and how to approach it:
🔷 What Is a Moving Average Pullback?
When an asset is in a clear uptrend (series of higher highs and
higher lows), price will periodically retreat to touch its moving
average (commonly the 20, 50, or 200-period MA) before resuming the
trend direction. This "pullback to the mean" is institutional money
reloading positions at better prices — and retail traders can read
this signal.
🔷 Why Does It Work on GER40?
The DAX 40 is driven by institutions — pension funds, hedge funds,
and sovereign wealth. These players don't chase price. They WAIT for
the dip. The moving average zone is where their orders tend to cluster.
When price touches this zone and reverses, you're trading WITH the
institutional flow — not against it.
🔷 How the Thief Trader Uses It (Day Chart Confirmation):
Step 1 → Identify the major trend on the Daily chart (must be bullish)
Step 2 → Mark the key moving average zone (20 MA / 50 MA / 200 MA)
Step 3 → Wait for price to pull back INTO this zone
Step 4 → Drop to 15m / 30m chart for entry confirmation signal
(bullish engulfing, pin bar, break of structure to upside)
Step 5 → Enter with layered buy limit orders in the MA zone
Step 6 → Set SL below the MA zone / recent structural swing low
Step 7 → Target the next resistance zone (the vault) and escape clean
🔷 What Does "Layered Entry" Mean?
Instead of placing one single entry at one price level, the Thief
places multiple smaller buy limit orders across a price range within
the setup zone. This achieves two things:
1. A lower average entry price = more profit potential
2. If price dips further before reversing, more orders get filled
at even better prices — building a stronger position
🔷 What Are Overbought Conditions and Why Does the Thief Escape?
When price reaches the Police Force zone (our target at 26,500),
oscillators like RSI climb above 70 — signalling "overbought."
This means price has moved too far, too fast. Institutional players
start distributing (selling) their positions, trapping late buyers.
THIS is why the Thief never holds into the Police Force — take the
profit, leave the trap for others.
🔷 Why Does the Thief Use a Risk-to-Reward Framework?
Every heist needs a plan for if things go wrong. The SL is the
exit hatch — a pre-agreed point where the crew accepts a small
controlled loss rather than a catastrophic one. Good traders
treat every trade as a BUSINESS DECISION, not an emotional one.
Set the risk. Define the reward. Execute without fear.
━━━━━━━━━━━━━━━━
💬 THIEF TRADER MOTIVATION — FROM THE WAR ROOM 🔥
━━━━━━━━━━━━━━━━
"The best thieves don't steal from the market.
They WAIT for the market to offer what's already theirs.
Patience is not weakness — it's the sharpest weapon in the vault.
Load the plan. Trust the levels. Execute with precision.
Take the money. Protect the crew. Always live to trade another day."
— Thief Trader 🏴☠️
"The Frankfurt vault doesn't open for the reckless.
It opens for those who studied the blueprint,
watched the guards change shift at the MA zone,
and struck at exactly the right moment.
You are not gambling. You are ENGINEERING the heist."
— The Market Heist Master 💼🧠
━━━━━━━━━━━━━━━━
🤝 HEY THIEF OG's — SHOW THE CREW SOME LOVE! ❤️🔥
━━━━━━━━━━━━━━━━
If this blueprint added value to your trading day — drop a
LIKE 👍, a BOOST 🚀, and a FOLLOW 🔔 on TradingView.
Your support keeps the Thief Trader war room operational
and the blueprints coming thick and fast.
💬 Drop your thoughts in the comments — are you bullish or bearish
on GER40 from here? The crew wants to hear your read.
DAX - Technical Analysis
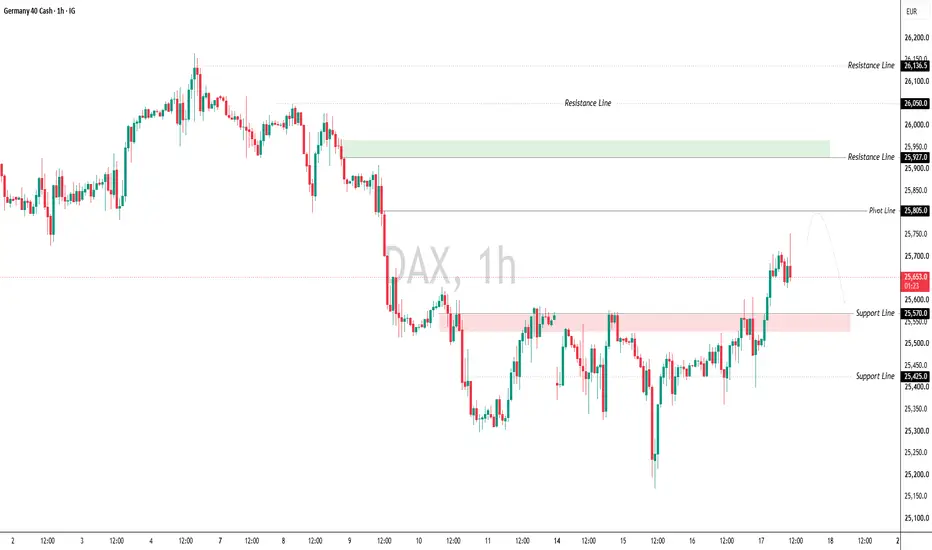
As long as the price remains below the 25805 level, the bearish trajectory is expected to persist.
The price may currently undergo a brief bullish correction toward the pivot level before resuming its decline to target the support line at 25570. A confirmed breakout below this level will extend the downward momentum further toward 25425.
However, if the price manages to break above the 25805 pivot point, the trend will shift upward toward the resistance level at 25927. A breakout and solid consolidation above 25927 will pave the way toward 26050 and subsequently 26136.
Resistance Levels: 25927 – 26050
Support Levels: 25570 – 25425
DAX 40 Update: DAX Index Falls on FridayPEPPERSTONE:GER40
Frankfurt's DAX 40 index fell approximately 0.7% to the 25,500 level on Friday, reversing course after two consecutive sessions of gains and moving in line with broader European market trends.
A cautious sentiment returned to European markets following a week dominated by central bank decisions, even as oil prices resumed their decline.
----------------------------------------------------------------------------------------------------------------
✅ Price Action Analysis (H4 Timeframe)
The macro H4 structure reflects a Bearish Structure / Relief Retest Phase. After a gradual decline from the record high near the 26,624.5 green line, the GER40 index slid downward, establishing a temporary bottom via a liquidity sweep (a "wick" penetration below the level) at the floor of the Major Demand Zone (25,197.0 – 25,307.0).
At the 25,441.2 price level, the most recent H4 candle shows a minor downward correction after bouncing off the 25,197.0 low and stalling at the 25,828.3 green line resistance.
The current candle is holding above the local Higher Low (HL) area—specifically above the 25,307.0 floor—indicating an attempt to build a defensive base prior to the next potential recovery push.
----------------------------------------------------------------------------------------------------------------
✅ Key Zones:
- ⚡Resistance / Supply Zone (SBR): The 25,828.3 green line range (SBR area & nearest local resistance), the 26,174 green line, and the 26,624.5 green line (peak of the Major Supply Zone).
- ⚡Support / Demand Zone: The 25,307.0 – 25,400.0 green line range and the 25,197.0 green line (the absolute floor of the Major Demand Zone).
----------------------------------------------------------------------------------------------------------------
✅ Forward Outlook
- ⚡The sharp decline from the peak of 26,624.5 to the low of 25,197.0 is calculated as the completion of Sub-Wave A (or Wave 1). The upward rebound touching the green line at 25,828.3 is identified as the formation of Sub-Wave B (a micro zigzag correction).
- ⚡The mild decline from 25,828.3 to 25,441.2 is currently identified as the formation of a micro sub-wave 2/B within a relief rally structure.
- ⚡Price action is projected to complete consolidation above the 25,307.0 demand level before launching an impulsive upward push (relief wave) to break the 25,828 resistance, aiming to test the Supply Zone barrier near the green line at 26,174.
DAX 40 ($DE40) 4H: Rejection at Descending ChannelDAX 40 ( ICMARKETS:DE40 ) 4H: Rejection at Descending Channel Resistance & 200-EMA Triggers Downside Wave Toward 24,693 Floor
### 🇩🇪 Germany DAX 40 Index ( ICMARKETS:DE40 ) 4-Hour Technical Matrix (Ref: DE40_2026-09-22_09-33-14.png)
We are issuing an updated 4-Hour (4H) intraday structural study for the Germany DAX 40 Index ( ICMARKETS:DE40 / IC Markets). Price action continues to strictly respect its active descending channel, suffering another precise dynamic rejection at the confluence of the upper trendline boundary and the trailing 200-period moving average.
The index is trading down **-0.68% (-173.60 pts)** at **25,429.40**, surrendering its immediate trailing **17-EMA** and accelerating lower within the lower half of the channel structure.
---
### 🔍 Technical Architecture & Level Roadmap:
Our quantitative 4H framework isolates the key dynamic moving average barriers, trendline boundaries, and target downside demand nodes:
1. **Overhead Rejection Confluence Node:**
* **200-Period Exponential Moving Average (200-EMA):** **25,763.63** (purple line) — Institutional dynamic baseline acting as major intraday overhead resistance.
* **17-Period Dynamic Resistance (17-EMA):** **25,533.21** (red line) — Trailing dynamic ceiling currently capping short-term relief attempts.
* **Upper Channel Resistance Guide:** Descending diagonal trendline capping high-level rallies.
2. **Primary Downside Expansion Target (Red Arrow & Highlight Circle):**
* **Lower Channel Support Boundary:** Diagonal trendline floor defining the bottom of the corrective corridor.
* **Horizontal Polarity Support Floor:** **24,693.80** (red line) — Key macro demand floor aligning with the lower channel target zone.
3. **Macro Supply Ceiling:**
* **Macro All-Time High Resistance:** **26,606.92** — Long-term range peak.
---
### 🛡️ Strategic Operational Scenarios:
* **Scenario A — Bearish Channel Continuation (Red Arrow Projection):** Maintained price action below the **25,533.21 (17-EMA)** dynamic ceiling keeps the bearish impulse active, favoring a continuation lower toward the **24,693.80** static floor and lower channel support node highlighted in the target circle.
* **Scenario B — Bullish Channel Breakout Invalidation:** A sustained 4H closing break above **25,763.63 (200-EMA)** breaks the active channel geometry, invalidating the short-term bearish bias and opening room for a recovery toward **26,000** and **26,606.92**.
### 📊 Tactical Parameters Summary:
* **Current Bias:** Bearish Channel Continuation
* **Immediate Dynamic Resistance (17-EMA):** 25,533.21
* **Institutional Dynamic Resistance (200-EMA):** 25,763.63
* **Primary Support Floor Target:** 24,693.80
* **Macro Peak Ceiling:** 26,606.92
---
📊 **ChartPro Data**
*European Equities Architecture, Intraday Dynamics & Systematic Risk Management.*
⚠️ **Disclaimer:** For educational and informational purposes only. This active market study represents a personal trading framework and does not constitute financial or investment advice.
Potential bearish reversal?DAX40 (DE40) is rising towards the pivot, which has been identiifed as an overlap resistance and could reverse towards the 1st support, which acts as a pullback support.
Pivot: 25,823.46
1st Support: 24,639.56
1st Resistance: 26,586.19
Disclaimer:
The opinions given above constitute general market commentary and do not constitute the opinion or advice of IC Markets or any form of personal or investment advice.
Any opinions, news, research, analyses, prices, other information, or links to third-party sites contained on this website are provided on an "as-is" basis, are intended to be informative only, and are not advice, a recommendation, research, a record of our trading prices, an offer of, or solicitation for, a transaction in any financial instrument and thus should not be treated as such. The information provided does not involve any specific investment objectives, financial situation, or needs of any specific person who may receive it. Please be aware that past performance is not a reliable indicator of future performance and/or results. Past performance or forward-looking scenarios based upon the reasonable beliefs of the third-party provider are not a guarantee of future performance. Actual results may differ materially from those anticipated in forward-looking or past performance statements. IC Markets makes no representation or warranty and assumes no liability as to the accuracy or completeness of the information provided, nor any loss arising from any investment based on a recommendation, forecast, or any information supplied by any third party.
DAX: Last support zone standing before 23,900DAX is bearish on its 1D technical outlook (RSI = 40.912, MACD = -63.900, ADX = 24.679) as it had a strong red candle today following a rejection on the 1D MA50, that hit again the 1D MA100. Directly under it is the HL trendline of May, with the two forming together the 4 month support zone. If it holds, the bull trend continues to a HH possibly around 27,000. If it breaks though, target the 1.382 Fibonacci extension (TP = 23,900), which was what happened on the March correction that bottomed almost on its 1W MA100.
## If you like our free content follow our profile to get more daily ideas. ##
## Comments and likes are greatly appreciated. ##
DAX: Aggressive bearish correction ahead to 23,500.DAX is almost oversold on its 1D technical outlook (RSI = 33.969, MACD = -41.100, ADX = 26.937) and neutral on 1W (RSI = 51.003) as it is having a strong weekly bearish reversal towards the 1W MA50. The 4 year Channel Up has given its most effective buy signals below it, last time (March 2026) on the 1W MA100 itself, while the 1W RSI also hit its own S zone. Consequently we expect DAX to hit both the 1W MA100 and the bottom of the pattern (TP = 23,500).
## If you like our free content follow our profile to get more daily ideas. ##
## Comments and likes are greatly appreciated. ##
DAX 40 ($DE40) Daily: Strong Corrective Wave TargetsDAX 40 ( ICMARKETS:DE40 ) Daily: Strong Corrective Wave Targets 200-EMA & 24,693 Confluence Zone Following Channel Breakdown
### 🇩🇪 Germany DAX 40 Index ( ICMARKETS:DE40 ) Daily Technical Matrix (Ref: DE40_2026-09-15_08-48-43.png)
Following up on our previous structural outlook published on August 13, 2026, and updated as of September 15, 2026, the Germany DAX 40 Index ( ICMARKETS:DE40 / IC Markets) is executing a pronounced corrective decline. Price action has decisively broken below its primary ascending channel guide (green trendline) and trailing **17-EMA**, heading directly toward its high-confluence dynamic and structural support node.
The index is trading down **-1.16% (-295.10 pts)** at **25,221.30**, entering the lower Fibonacci retracement bands.
---
### 🔍 Technical Architecture & Level Roadmap:
Our quantitative Daily (1D) framework isolates the key Fibonacci levels, structural polarity floors, and downside extension targets:
1. **High-Confluence Demand Target (Green Circle Focus Node):**
* **200-Period Exponential Moving Average (200-EMA):** **24,813.28** (purple line) — Core dynamic institutional baseline driving macro trend support.
* **Horizontal Polarity Support Floor:** **24,693.80** (red line) — Structural horizontal boundary aligning perfectly with the **1.000 Fib (24,686.70)** swing base.
2. **Fibonacci Retracement Grid:**
* **0.618 Retracement:** **25,407.88** — Immediate overhead hurdle recently surrendered by buyers.
* **0.786 Retracement:** **25,090.74** — Intermediate buffer zone ahead of the main support node.
* **0.382 / 0.236 Retracements:** **25,853.37** / **26,128.97** — Confluence resistance parameters.
3. **Overhead Supply & Dynamic Ceilings:**
* **17-Period Dynamic Resistance (17-EMA):** **25,775.94** (red line) — Trailing dynamic ceiling to reclaim for short-term stabilization.
* **Macro All-Time High Resistance:** **26,606.92** — Range ceiling.
4. **Bearish Extension Projections (In Case of Breakdown):**
* **1.618 Fibonacci Extension Target:** **23,520.19** — Primary downside expansion zone if **24,693.80** fails.
* **2.618 Fibonacci Extension Target:** **21,632.50** — Secondary macro target floor.
---
### 🛡️ Strategic Operational Scenarios:
* **Scenario A — Support Defense at 200-EMA Confluence:** The primary expected reaction zone lies within the **24,813.28 (200-EMA) – 24,693.80** structural belt. A bullish defense and reversal structure in this green highlight node provides a high-probability base for trend continuation toward **25,775.94 (17-EMA)**.
* **Scenario B — Structural Breakdown Below 24,693:** A daily close beneath **24,693.80** invalidates the macro support node, confirming an extended impulse lower toward **23,520.19 (1.618 Fib Extension)** and potentially **21,632.50 (2.618 Fib Extension)**.
### 📊 Tactical Parameters Summary:
* **Current Bias:** Corrective Pullback / Support Test
* **Primary Support Node (200-EMA / Static Floor):** 24,813.28 / 24,693.80
* **Immediate Dynamic Resistance (17-EMA):** 25,775.94
* **Macro Range Peak:** 26,606.92
* **Bearish Fibonacci Extension Targets:** 23,520.19 (1.618) | 21,632.50 (2.618)
---
📊 **ChartPro Data**
*European Equities Architecture, Fibonacci Matrix & Systematic Risk Management.*
⚠️ **Disclaimer:** For educational and informational purposes only. This active market study represents a personal trading framework and does not constitute financial or investment advice.