France 40 Index - Signs of downside continuation (H4)The France 40 Index shows signs of downside continuation after a daily correction that followed the first downside impulse of this bearish move.
In fact, the index has broken below the previous month's low which per se doesn't mean anything, but as long as you don't have macd divergence on the way down on let's say this timeframe (H4), any H1 correction or corrective structure is a setup for more downside, i.e. an opportunity for shorts.
Ideally you should find a setup on the H1 timeframe that a
In-depth trading ideas
FRA40 — H4 potential bullish reversalTriple bottom forming with bullish RSI divergence.
Daily bullish trend — added confluence.
Daily retracement into the golden pocket zone.
H1 execution: wait for neckline breakout.
Stop loss below the Alligator crossing channel.
Risk/reward: 1:2.
Potential bullish reversal with daily-chart confluence.
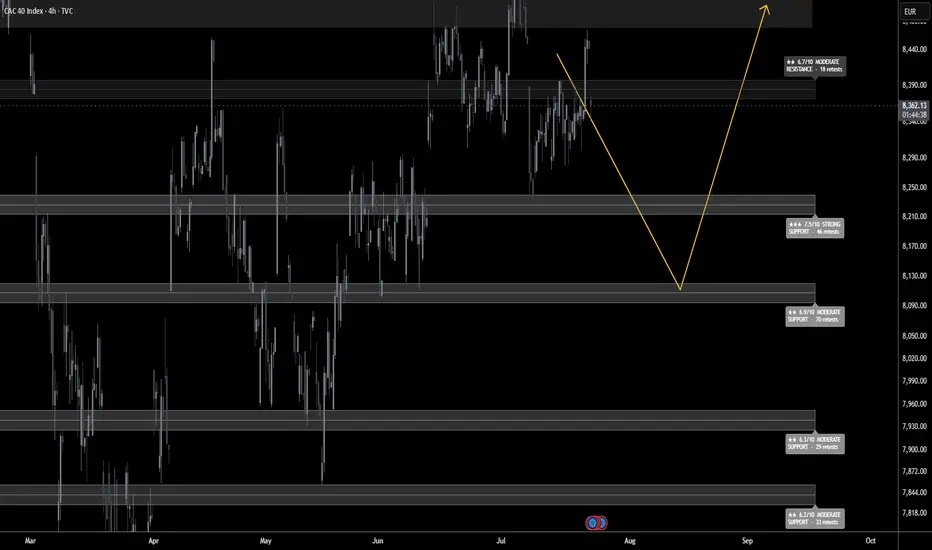
CAC 40 — Bullish Setup | Pullback Before UpsideThe CAC 40 is developing a potential bullish setup, with the current structure suggesting that the market may first experience a moderate move lower before the next upside phase takes shape.
From a technical perspective, the initial decline would represent a corrective phase within the broader setup rather than the primary direction of the trade. Once that downside reaction develops, the analysis points toward a renewed shift toward the buy side, with higher levels coming into focus.
The curre
France 40 Near ATH — Short-Term Sell SetupFrance 40 is currently trading near its all-time high levels, where the market appears to be facing increased selling pressure after an extended bullish move. At these elevated levels, price is showing signs that a short-term downside move could develop as sellers begin to step in and take control.
The current trade idea is focused on the selling side, with expectations of a temporary decline from the present high-zone area. After reaching such elevated levels, the market can experience profit-
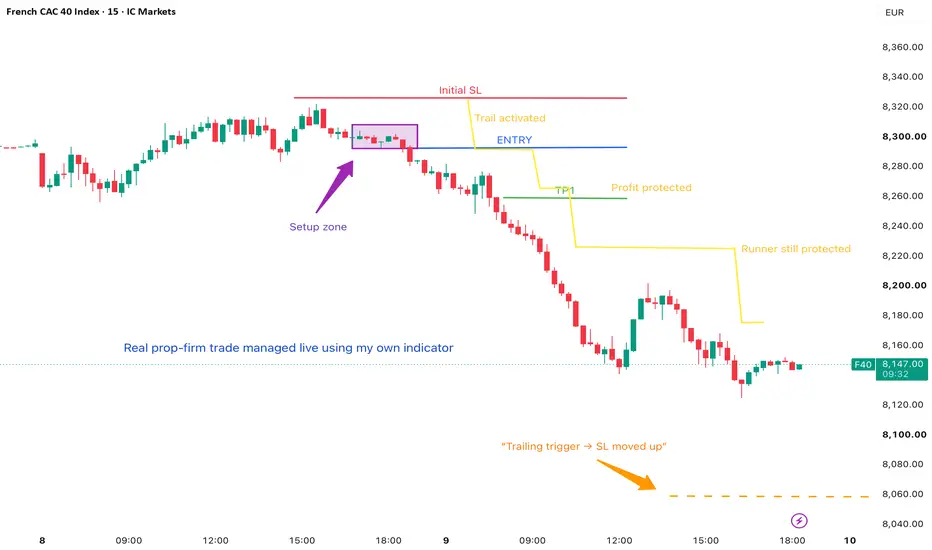
Smart Trailing Stop: Protect Profits, Let Winners RunA trailing stop should not simply follow price candle after candle.
If it is too aggressive, it can close a good position during a normal market pullback.
If it is too slow, a large part of the unrealized profit can be given back.
The goal of a smart trailing stop is therefore to find the right balance: progressively reduce risk while still giving the market enough room to continue.
In this F40 M15 example, the setup is bearish.
The trade starts with a defined entry and an initial structural
CAC 40 Holds Support After Extended SelloffThe CAC has fallen just under 6% from its record high in around one month, and mostly in a straight line. The fact that August was a bearish outside month coupled with a bearish divergence suggests this pullback could have further to go.
However, perhaps it can bounce over the near term, given it is trying to form a base around its 200-day EMA and July low with a bullish divergence on the daily RSI (2).
But bulls may be treading a fine line to try and squeeze a decent reward to risk ratio at
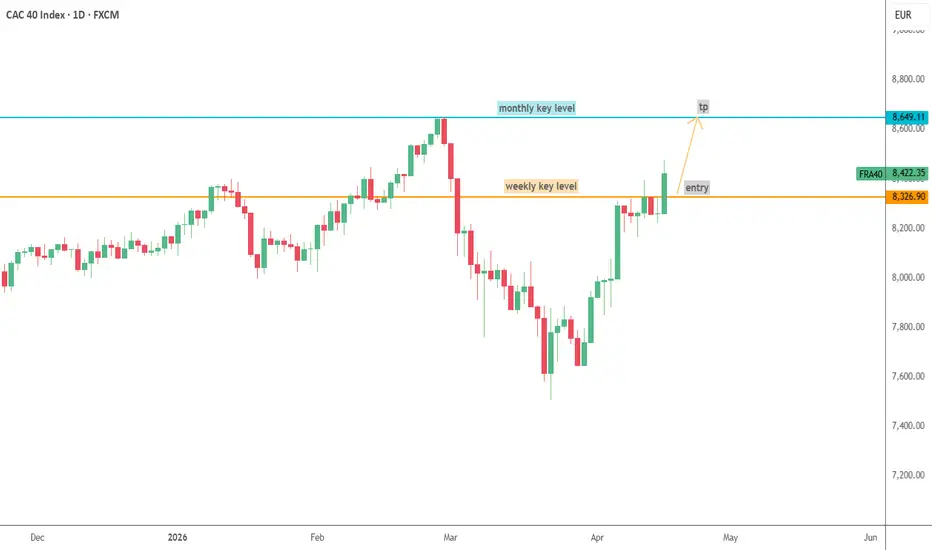
France 40 Breaks to a Record: Fundamental and Technical ViewEducation / Technical and Fundamental Analysis
Market: France 40 Cash
Timeframe: Daily
Bias: Constructive above 8,648, with confirmation required beyond 8,762
The France 40 has broken above a multi-month triangle and moved beyond its previous year-to-date record. At first glance, the message appears straightforward: price is rising, momentum is strengthening and new highs are attracting buyers.
But a breakout becomes more useful when we understand what the market is actually repricing.
An equ
CAC40 H4: Why 8,456 Is the Only Level That Matters▪️ CAC40 H4 SNAPSHOT — EXECUTIVE SUMMARY
▪️ the CAC has rolled over to 8,408 after failing at 8,551. The pullback is orderly so far, with price rotating back toward the middle of its range.
▪️ Primary outlook is bearish-to-cautious — 8,456 now caps the tape. Sellers own the near term unless it is reclaimed. Heavy liquidity stacked at 8,130 can pull prices lower.
▪️ Key resistance zone: 8,456, rejected 19 times on the way down. Beyond it, 8,551 is the next hurdle.
▪️ Major defense line: 8,278
CAC40 H1: Why 8,385 Is the Only Level That Matters▪️ CAC40 H1 SNAPSHOT — EXECUTIVE SUMMARY
▪️ the CAC40 is coiling near 8,367 just under the highs, building energy against resistance after a clean run off support.
▪️ Primary outlook is neutral-to-constructive — 8,385 is the trigger; a decisive break and hold flips the tape into continuation.
▪️ Key resistance / breakout trigger: 8,385, tested 18 times — the gate to the next leg. Above it the chart is thin — a clean break has room to extend.
▪️ Major defense line: 8,227 — a strong level at 4
CAC 40 March 2024 high of 8,253.39 was retested a year later in March '25 and this level of resistance has been broken converting it to a support level which is in the process of being tested. I believe this support level will hold for the remainder of July and as we move deeper into the 2nd half of the year we will continue to see higher prices and a new ATH. A fall in price below 7,500 will invalidate this theory and likely be the alarm bell for trend reversal.
CAC @ 8,346: The 7.6/10 Wall at 8,377 vs Strong 8,331 Floor▪️ CAC M30 SNAPSHOT — EXECUTIVE SUMMARY
▪️ the DAX is basing near 8,346, leaning on a shelf that buyers have repeatedly defended. Structure is coiling, with a firm floor beneath price and a stack of supply overhead.
▪️ Primary outlook is neutral-to-constructive — 8,331 is the line in the sand. Defended, it keeps the recovery intact; forfeited, it hands the initiative back to sellers.
▪️ Key resistance zone: 8,377, tagged 37 times and likely to cap the first attempt. Above that sits 8,424, the
FR40 SWING SHORTBased on my analysis FR40 price is currently at a weekly supply zone which was filled 14 April 25 13:00 South African time currently we are in D1 Supply area and we purged H4/H3/H2/H1 Liquidity on the H1 timeframe there's a Supply zone which I anticipate price to fill the entry.
This is my out look on FR40 for the coming week reasons for the swing trade.
1. Daily Supply Zone.
2. 1-4 Hour Buyside Liquidity sweep.
3. 1 Hour Supply zone.
FRANCE 40 - which setups are worth it and which are notLook at this buy setup and ask yourself:
is it worth it?
Clearly not.
Had a 30 min red candle appeared earlier on in the impulsive move at the time we published the potential setup:
www.tradingview.com
we would have considered taking the buy.
But now it's too late and you can very well see that, being the target fixed, taking this 30 min/1hr engulfing engulfing setup has a terrible risk to reward (1:1).
So no, no setup for us.
Trade well. Stay disciplined.
If you find value in this perspective
FRANCE 40 - Potential buy setupAny 30 min. red indecision candle that you see completing in the chart, you can use it as an entry. Once it's complete, put a stop buy order above the high with a stop loss below the low.
This should optimise your risk to reward significantly as per the long setup frame on the chart (we placed it a little on the right as opposed of putting it right on the chart because it is hypothetical, as it's levels depend on where this 30 min candle appears, how big it is etc. etc.)
You want to wait for th
FRA40 Bullish Setup With Clear Targets AheadTHIEF TRADE SETUP — CAC 40 / France 40 Index CFD 📊 (Day Trade & Swing Trade Opportunity)
🎯 "The Market is the Battlefield. The Chart is the Map. The Thief Knows Both." 🗺️💰
⚔️ ASSET: France 40 Index CFD — CAC 40 (Cotation Assistée en Continu)
The CAC 40 is the flagship benchmark index of Euronext Paris, tracking the 40 largest and most liquid blue-chip companies listed on the exchange by free-float market capitalisation. Heavyweights include LVMH, Hermès, TotalEnergies, Airbus, BNP Paribas, Schn
CAC 40 Extends Correction Amid Energy Crisis and Bond Market ShiThe CAC 40 index continues its corrective movement, trading near 7799.0, as investors rotate capital from risk assets into bonds amid rising inflation concerns and escalating geopolitical tensions.
The ongoing US–Iran conflict and growing risks to global energy supply chains remain the key drivers of market sentiment.
⸻
Energy Risks Pressure European Markets
France is taking preventive measures to stabilize its energy market amid supply risks:
• Focus on Gravenchon refinery
• ~20% of natio
FR40 Bullish Structure | Smart Pullbacks in Control🔷 FR40 / CAC40 — FRANCE 40
📊 Index Market Capital Flow Blueprint (Swing Trade)
🧭 Market Bias
🟢 Bullish Structure Confirmed
Price continues to respect the Triangular Moving Average (TMA) with multiple clean pullbacks, signaling sustained institutional accumulation and healthy trend continuation.
🧠 Trade Plan Logic
📐 Triangular Moving Average = Dynamic Support
Multiple pullback reactions 🧲
Higher-timeframe trend intact 📈
Momentum maintained above structure 🏗️
This behavior typically reflects smar
CAC 40The CAC 40 continues to hold steady despite minor volatility, showing resilience in the current macro environment. We still have roughly 30 days until the next Federal Reserve meeting, and markets will likely begin positioning ahead of that decision.
I do expect a meaningful rate cut, which could provide support to the broader economy. Lower rates typically ease borrowing conditions, improve liquidity, and can act as a tailwind for equities particularly major indices like the CAC 40.
For now, th
CAC 40 at Major ResistanceThe CAC 40 index is currently testing a major supply / resistance zone around 8,300–8,400, a level that has previously acted as a strong rejection area.
Price is trading above the moving average, indicating that the overall structure remains bullish, but momentum is slowing as sellers step in near resistance.
This area is technically a decision zone.
🟢 Bullish Scenario
• Strong daily close above 8,400
• Successful breakout and acceptance above resistance
• Upside targets:
• 8,550
• 8,7