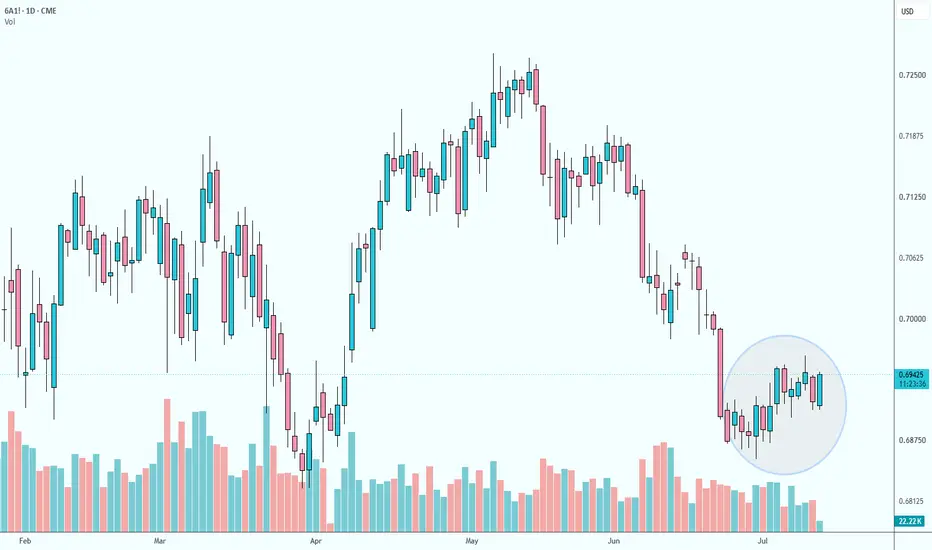
𝗔𝗨𝗗 𝗙𝘂𝘁𝘂𝗿𝗲𝘀 (𝟲𝗔𝟭!) 𝗪𝗲𝗲𝗸𝗹𝘆 𝗢𝘂𝘁𝗹𝗼𝗼𝗸 𝗔𝗨𝗗 𝗙𝘂𝘁𝘂𝗿𝗲𝘀 (𝟲𝗔𝟭!) 𝗪𝗲𝗲𝗸𝗹𝘆 𝗢𝘂𝘁𝗹𝗼𝗼𝗸 | 𝗔𝘂𝗴𝘂𝘀𝘁 𝟭𝟬–𝟭𝟰, 𝟮𝟬𝟮𝟲
Similar to almost all major currencies against the USD, **AUD Futures have been bullish against the USD over the past two weeks**.
From the recent low, price has moved approximately **200 pips higher**.
Price has now slightly touched a **bearish D1 Fair Value Gap (FVG)**.
Just above this area, there is an **old low from July 15**, which could become an important liquidity reference.
It is therefore possible that price first takes out this old low, reaches deeper into the **D1 FVG or a bearish Order Block**, and then reacts lower.
If this happens, I would be looking for **Sellside liquidity** to become the next potential draw on liquidity.
My bias for the coming week is therefore:
**𝗔𝗨𝗗 𝗙𝘂𝘁𝘂𝗿𝗲𝘀 → 𝗦𝗵𝗼𝗿𝘁**
But as always, the bias is only a framework.
I will wait for the market to show confirmation through **liquidity, market structure and displacement** before considering an entry.
**𝗡𝗼 𝗿𝗮𝗶𝗱, 𝗻𝗼 𝘁𝗿𝗮𝗱𝗲.**
*Disclaimer: This content is for educational and informational purposes only and does not constitute financial or investment advice. Trading financial markets involves substantial risk, and past performance is not indicative of future results. Always conduct your own research and consider your individual risk tolerance before making any trading decisions.*
Australian Dollar Futures (Jun 2031)
No trades
No trades
In-depth trading ideas
AUDUSD Short Trade Using Supply and DemandAUD Analysis:
Technicals:
- Price inside daily supply.
Sentiment/Fundamentals:
- COT adding into shorts + closing longs.
- Recent Manufactuing + Services have been good + Unemployment stayed same.
- AUD Inflation data coming out Tuesday.
OVerall:
- Still short from the 1hr supply created mentioned last week, but traders may look to use 4hr RBD for entry higher up RBD around 0.70000
US CPI Can Release Compressed Volatility6A offers an active volatility trade rather than a directional call. Neutral momentum, divided positioning and conflicting macro forces leave the break's direction unresolved, but US CPI provides a credible catalyst for the compressed range to expand.
Where the edge is
Recent range compression has encouraged oversized range positioning. If CPI produces sustained acceptance outside the range, forced exits can amplify the initial move and accelerate volatility in 6A.
Evidence
The recent average range has narrowed and AUD/USD remains compressed. Risk aversion, oil and relative-rate pressure cap rallies, while softer US inflation could reverse recent Dollar support.
Trade idea
Prefer a limited-risk long strangle using options on 6A futures into CPI. Judge the trade by sustained expansion, not the first brief sweep. Use acceptance beyond the range as confirmation.
--------------------
When charting futures, the data provided could be delayed. Traders working with the ticker symbols discussed in this idea may prefer to use CME Group real-time data plan on TradingView: tradingview.com/cme/ .
This consideration is particularly important for shorter-term traders, whereas it may be less critical for those focused on longer-term trading strategies.
General Disclaimer:
The trade ideas presented herein are solely for illustrative purposes forming a part of a case study intended to demonstrate key principles in risk management within the context of the specific market scenarios discussed. These ideas are not to be interpreted as investment recommendations or financial advice. They do not endorse or promote any specific trading strategies, financial products, or services. The information provided is based on data believed to be reliable; however, its accuracy or completeness cannot be guaranteed. Trading in financial markets involves risks, including the potential loss of principal. Each individual should conduct their own research and consult with professional financial advisors before making any investment decisions. The author or publisher of this content bears no responsibility for any actions taken based on the information provided or for any resultant financial or other losses.
Short trade
🔴 6A1! AUD Futures — Sellside Continuation Into External Liquidity
Pair: 6A1! Australian Dollar Futures
Timeframe: 1H
Direction: 🔴 Sellside
Session: London AM
Entry: 0.69265
Stop Loss: 0.69400
Target: 0.68555
R:R: 5.26
🧠 Idea
AUD Futures has broken down from a broader internal range and is now delivering into lower sellside liquidity.
Price failed to hold above the previous support shelf, broke beneath the equal-low region, and is now trading toward the lower bullish order block / external liquidity zone.
The short idea is based on bearish continuation after structure failure.
🧭 Bias
🔴 Bearish while price remains below 0.69400
The sellside route remains valid as long as the price does not reclaim the failed support/breaker area.
🔍 Thesis
🔹 Price created a larger range after the April expansion.
🔹 The May high around 0.72540 marked the upper range extreme.
🔹 Since then, the price has formed lower highs and broken internal supports.
🔹 The breakdown below 0.69529 / 0.69400 confirms bearish pressure.
🔹 Price is now attacking external liquidity around 0.69045 / 0.68900.
🔹 The next major target is the lower bullish OB near 0.68555.
16 June 2026 AUDUSD Short (Possible Swing Trade)I initially posted a trade idea of using the current H4 Supply zone.
However, there's nothing certain in trading.
So if my initial trade idea doesn't work, the second trade idea would be when price break through, take liquidity, enters Supply Zone and gives confirmation.
AUD Short 16 June 2026Today at 8.30pm, there will be US news. On Forex Factory and Investing.com, those news are considered low/medium impact.
However, MyFXBook, they are considered High Impact. So if you're using Prop Firm accounts, do be mindful.
I'm currently already in a short position on the H1 Candle with the arrow, I sold at the Breakout.
From Price Action perspective on the LTF, price could retest the support which is the lower part of the range.
For this morning price movement downwards, I've also used the Fibonacci Retracement tool to mark out the 50% mark.
That extension move seem to have created a liquidity area to be taken which can be used as the fuel required for a further downward push.
A conservative short idea would be the first one that gives a 1:2R trade.
The second one risks a tighter stop but gives a possible 1:5R trade.
AUD/USD (6A) — Swing Analysis June 13, 2026Bearish bias, no open position, waiting for pullback.
The Australian Dollar is under structural pressure: the yield advantage of Australian rates over US rates is compressing rapidly, the US PPI came in well above expectations (1.1% vs 0.7% forecast) and the US Dollar maintains a dominant daily uptrend. Large speculative funds reduced their long exposure on AUD by over 23,600 contracts in a single week, a clear sign of growing disengagement. In the short term a technical bounce is underway, but it is happening on very low volume: there are no real institutional buyers supporting the move.
The current price at 0.7032 sits just 32 pips above a significant institutional floor at 0.7000, where nearly 1,800 July PUT contracts are clustered. Selling here means selling directly above a wall of buyers: the risk/reward is insufficient.
The strategy is to wait for the ongoing bounce to carry price toward the institutional resistance at 0.7050/0.7055, a confluence zone between July and June CALL options and recent technical highs. Only if price is rejected from that zone is a Short entry considered, with stop at 0.7105 and target at 0.6900, for a risk/reward ratio of 1:2.73. If price breaks above 0.7055 with strength, no entry. If price breaks directly below 0.7000, do not chase: wait for a retest of the level before reassessing.
Key calendar risks this week: RBA on June 16 and FOMC on June 17 can generate sharp moves on open swing positions.
AUD/USD Bears Have Control, But the Short Is Already Paid8 June 2026, 9:05 AM London, UK
Monday opens with Friday's payroll shock still driving a broad dollar bid, reinforced by risk aversion, Middle East headlines and higher oil. The best tactical battlefield is not a blind dollar chase, but the timing around live option gravity and nearby stop zones. USD/JPY is pinned around the 160.00 and 160.25 expiries while intervention risk keeps convexity preferable to naked spot. EUR/USD and cable have accepted lower after earlier squeeze setups failed, but both are close to support where cut-related flow can distort the first London move. AUD remains the cleanest pro-cyclical casualty, while USD/CAD is pressing highs despite firmer oil. Crosses are more selective, with EUR/GBP range-bound, AUD/NZD vulnerable to exhaustion after a crowded squeeze, and EUR/CHF testing a short-covering zone.
--------------------
EUR/USD — Spot: 1.1518
Technical Analysis
- Late Friday selling broke the 1.1577 range base, and Monday's 1.1507 low tested the 76.4% retracement area.
- The former range base at 1.1577 is first rebound supply. Below spot, 1.1480 pivot support and the 1.1451 lower Bollinger area are the next floors before 1.1409.
- A close back above 1.1577 is needed to blunt the downside break.
Sell-side Research
- Bank of America says near-term risks favour short EUR/USD as US real rates and Fed hike pricing support the dollar, while keeping a medium-term constructive EUR view.
- Credit Agricole says a fully priced ECB hike with dovish guidance would do little to boost EUR rate appeal and leave the currency vulnerable to geopolitical risk.
Market Chatter
- Today's 10am New York cut has EUR/USD expiries at 1.1500 for USD 1.2bn, 1.1520/30, 1.1570/80 and larger strikes above.
- Strong payrolls lifted US Treasury yields and the dollar. Spot has already tested clustered stops just below the 1.1510 area.
Strategy
The dollar break has already paid, but option gravity around 1.1500/30 can slow the next leg before the cut. The underpriced path is post-cut downside continuation only if 1.1500 fails to hold, while reclaiming 1.1577 cancels fresh shorts.
--------------------
GBP/USD — Spot: 1.3330
Technical Analysis
- Friday's false break above the daily Ichimoku cloud top reversed sharply, leaving sterling heavy near a three-week low.
- 1.3348 has capped Monday, with 1.3384 pivot resistance and 1.3409 overhead. The 1.3304 May low and 1.3278 Fibonacci level are next supports.
- The speed of the reversal argues consolidation or corrective gains before another clean downside extension.
Sell-side Research
- Bank of America flags positioning risks around GBP shorts, a counterweight to the immediate dollar-led pressure on cable.
Market Chatter
- Risk aversion and higher oil on Middle East news supported the safe-haven dollar while cable held below 1.3350.
- Asia trade sat inside a 1.3316-1.3348 range, with stop-liquidity near 1.3318 close enough for a London sweep.
Strategy
Friday's downside has accepted below the old range floor, but chasing into 1.3318 stop-liquidity is poor value after the first flush. The better tactic is sell failed rebounds below 1.3384, with 1.3304 the support test.
--------------------
USD/JPY — Spot: 160.22
Technical Analysis
- The bull trend remains intact, but the 10-day average near 159.76 is a nearby trigger if the pair closes below it.
- 160.54 pivot resistance and the 160.72 2026 high cap immediate upside. The 159.86/73 lows and 158.87 50-day average are the main floors.
- Daily RSI is easing and positive momentum is fading, which raises the cost of chasing above 160.
Sell-side Research
- ANZ says USD/JPY remains biased higher near term, with 160.72 and 162 in view if US data keep supporting the dollar, but intervention risk is high.
- Credit Agricole says yen support mainly comes from the threat of intervention, while a BOJ hike has limited upside for JPY unless guidance is hawkish.
- MUFG expects 25bp hikes from the BOJ and ECB this month, with the Fed likely standing pat while the June FOMC remains a major focus.
Market Chatter
- Today's 10am New York cut has USD 3.4bn at 160.00 and roughly USD 1bn at 160.25/30, anchoring spot near the figure.
- Intervention threat limits upside, but one-month volatility and tail hedges have reawakened as spot holds above 160.
- IMM and CTA data show net JPY shorts increased as of Tuesday, while JGB yields are also rising.
Strategy
Spot has accepted above 160, but the 160.00/25 expiry complex makes pre-cut chasing unattractive. The underpriced path is a post-cut topside test toward 160.54/72 if 160.00 holds, with intervention risk arguing for options over naked spot.
--------------------
USD/CAD — Spot: 1.3951
Technical Analysis
- Friday's rebound from 1.3866 to 1.3941 cemented the bull trend resumption, although overbought RSI argues for consolidation.
- The 1.3967 2026 high is the immediate topside reference before the 1.4042 upper Bollinger area. Support sits at 1.3920, then 1.3866.
- The 10-day average near 1.3862 continues to define the broader trend floor.
Sell-side Research
- CIBC says Canadian jobs beat strongly, but the Bank of Canada should stay on hold unless labour tightening and core inflation accelerate.
- Societe Generale says a Bank of Canada hike this week would be a huge surprise, keeping policy risk tilted toward patience.
Market Chatter
- The pair is testing highs while WTI rebounds, showing the dollar impulse is still dominating CAD support.
- Stop-liquidity sits near 1.3970, just above the 2026 high, creating a clear sweep zone if dollar demand persists.
Strategy
The topside break has paid, and 1.3970 stop-liquidity is close enough to attract late USD buyers. The better risk is no fresh chase into the sweep, wait for a pullback to hold above 1.3920 or accepted trade through 1.3970.
--------------------
AUD/USD — Spot: 0.7050
Technical Analysis
- The range broke lower after Friday's payrolls surprise, with Monday's 0.7016 Asia low near a two-month low before a rebound to 0.7050.
- 0.7072 at the 10-day average and 0.7087 lower Bollinger area are immediate overhead resistance. The 0.7031 technical floor and 0.7000/05 handle are support.
- Weekly and monthly signals still keep downside risk in control.
Sell-side Research
- Bank of America positioning signals flag risks around AUD longs, while strong US data keep the dollar side supported.
Market Chatter
- Thin conditions from the Australian holiday exacerbated swings, with Asian equities sharply lower.
- CFTC data showed net AUD long fell 30% to 41,812 contracts in the week to June 2, after the prior 29% drop from a 13-year high.
- Low AUD/USD implied volatility before payrolls left volatility cheap relative to realised moves.
Strategy
The bearish AUD story is no longer early, but long liquidation risk remains while rebounds fail below 0.7072/87. The underpriced path is a second downside test through 0.7031 toward 0.7000, not dip-buying before risk sentiment stabilizes.
--------------------
EUR/GBP — Spot: 0.8641
Technical Analysis
- The cross remains tight and range-bound, with a falling monthly Ichimoku cloud still leaning on the euro.
- 0.8676 and 0.8687 are clean caps, while 0.8632 has been tested and 0.8619/12 remains the key floor.
- Current trade near 0.8641 leaves no clean breakout signal.
Sell-side Research
- ANZ expects ECB hikes in June and September as policymakers manage a persistent energy shock.
- Credit Agricole says a dovish ECB hike would do little to boost EUR, while Bank of America flags positioning risks around GBP shorts.
Market Chatter
- Stop-liquidity below 0.8605 is distant for the current session, keeping today's fight inside the 0.8627-0.8647 range.
- Upcoming ECB and BoE meetings make policy divergence important, but neither is a next-hours trigger.
Strategy
The cross offers little directional edge after another failed downside extension. The cleaner tactic is range discipline, fade strength below 0.8676 unless acceptance holds beyond it, and avoid fresh shorts unless 0.8627 breaks and retests from underneath.
--------------------
AUD/NZD — Spot: 1.2151
Technical Analysis
- The current range is compressed around 1.2134-1.2165, with repeated rejection below 1.2167.
- 1.2134 remains near pullback support, while 1.2165/67 is the live exhaustion cap.
Sell-side Research
- ANZ thinks AUD/NZD has peaked and targets 1.17 by year-end as RBA-RBNZ differentials move in NZD's favour.
- JP Morgan says a daily close above 1.2134 points to gains toward recent highs below 1.2300.
- MUFG sees scope for NZD to advance, but doubts the RBNZ will deliver all tightening currently priced.
Market Chatter
- Retail traders remain heavily short, keeping local squeeze risk alive while 1.2134 holds.
- The last available leveraged-futures snapshot favoured AUD over NZD at a three-year extreme, a medium-term ownership warning if the squeeze fails.
- The post-RBNZ selloff has already retraced more than half, showing the hawkish NZD story is no longer one-way.
Strategy
The cross is squeezing shorts, but the easy upside has been paid near 1.2165/67. The underpriced path is exhaustion unless that cap breaks and holds, with a hold below 1.2134 turning leveraged futures ownership into liquidation risk.
--------------------
EUR/CHF — Spot: 0.9190
Technical Analysis
- The cross rebounded from 0.9154 to 0.9190, leaving 0.9198 as the session rejection high.
- Recent ranges keep 0.9154/55 as support and 0.9191/98 as the immediate resistance band.
Sell-side Research
- Goldman Sachs remains medium-term bullish CHF, watching the June 18 SNB meeting for intervention-bias and haven-benefit signals.
- Societe Generale says hawkish ECB and FOMC rhetoric could offer the SNB relief through upward pressure on other interest rates.
Market Chatter
- Stop-liquidity is clustered near 0.9198, exactly where today's rally has started to hesitate.
- The June 18 SNB meeting remains the policy horizon for the franc intervention-bias debate, not a same-session trigger.
Strategy
Friday's lower-range idea has failed after the 0.9154 rebound, but 0.9198 is a live stop-sweep zone. The better trade is not chasing CHF weakness, wait for acceptance above 0.9198 or a failed sweep back into range.
--------------------
Market Summary
EUR/USD — 1.1518 — Post-cut downside
- Market consensus: Dollar strength dominates after payrolls, while expiries can slow immediate EUR/USD follow-through.
- Recommendation: Respect downside only if 1.1500 fails after the cut. Reclaiming 1.1577 cancels shorts.
GBP/USD — 1.3330 — Sell rebounds
- Market consensus: Cable is heavy after the false break, though GBP short risk tempers low-chasing.
- Recommendation: Sell failed rebounds below 1.3384, but avoid chasing directly into 1.3318 liquidity.
USD/JPY — 160.22 — Options preferred
- Market consensus: Dollar-yen is bid above 160, but expiries and intervention risk block clean spot chasing.
- Recommendation: Prefer optionality around 160.00/25, with post-cut topside valid only while 160.00 holds.
USD/CAD — 1.3951 — No fresh chase
- Market consensus: Broad USD strength outweighs firmer oil, while Canadian jobs keep BoC patience intact.
- Recommendation: Avoid chasing into 1.3970. Prefer pullback support above 1.3920 or accepted breakout.
AUD/USD — 0.7050 — Bearish
- Market consensus: Aussie pressure reflects USD strength, risk aversion and reduced but still relevant long exposure.
- Recommendation: Stay defensive below 0.7072/87, with 0.7031 then 0.7000 the downside tests.
EUR/GBP — 0.8641 — Range trading
- Market consensus: Policy risks are building, but the cross remains trapped inside a tight range.
- Recommendation: Use range discipline. Fade strength below 0.8676 unless the break holds.
AUD/NZD — 1.2151 — No fresh chase
- Market consensus: Retail shorts keep squeeze risk alive, while leveraged the stale futures-positioning backdrop needs confirmation in the next update.
- Recommendation: Do not chase near 1.2165/67. A hold below 1.2134 shifts risk lower.
EUR/CHF — 0.9190 — Trap watch
- Market consensus: CHF policy debate remains live, but spot is testing a local stop-sweep zone.
- Recommendation: Avoid chasing CHF weakness. Trade only accepted 0.9198 break or failed sweep.
--------------------
Futures / Spot FX Context
Although the market review above is based primarily on spot FX analysis, listed FX futures may provide a relevant and transparent way for traders to express or hedge views on the same underlying currency themes. Futures prices may differ from spot prices due to factors such as interest rate differentials, contract expiry, liquidity, and basis, so traders should always refer to the appropriate futures contract and real-time market data before making any decision.
CME Group FX futures offer a centrally cleared, regulated marketplace where counterparty credit risk is mitigated through CME Clearing. They also provide transparent order-book pricing and execution rules, including a first-on-price, first-to-fill framework, which can support fairer access to liquidity across market participants. These features may make futures suitable vehicles for traders who want exposure to major FX themes within a standardized, exchange-traded framework.
When charting futures, the data provided could be delayed. Traders working with the ticker symbols discussed in this idea may prefer to use CME Group real-time data plan on TradingView: tradingview.com/cme/ .
This consideration is particularly important for shorter-term traders, whereas it may be less critical for those focused on longer-term trading strategies.
General Disclaimer:
The trade ideas presented herein are solely for illustrative purposes forming a part of a case study intended to demonstrate key principles in risk management within the context of the specific market scenarios discussed. These ideas are not to be interpreted as investment recommendations or financial advice. They do not endorse or promote any specific trading strategies, financial products, or services. The information provided is based on data believed to be reliable; however, its accuracy or completeness cannot be guaranteed. Trading in financial markets involves risks, including the potential loss of principal. Each individual should conduct their own research and consult with professional financial advisors before making any investment decisions. The author or publisher of this content bears no responsibility for any actions taken based on the information provided or for any resultant financial or other losses.
Aussie breakout meets crowded shorts7 May 2026, 9:05 AM London, UK
The session is being driven by a cleaner pro-risk impulse from U. S. -Iran peace hopes, but the FX read is not a simple dollar-down story. EUR/USD and AUD/USD have reclaimed key areas, with short-covering and low volatility adding upside asymmetry, while Friday U. S. payrolls remain the next macro gate. Sterling is firmer above 1.36, although today’s UK local elections keep political premium live into the close. USD/JPY remains the most distorted major, caught between repeated downside bear traps and renewed Japanese intervention threats. USD/CAD stays range-bound as CAD resilience offsets a tactical USD recovery argument. In crosses, EUR/GBP and EUR/CHF remain policy-sensitive, while NZD/USD and AUD/NZD show selective secondary opportunities rather than a broad basket trade.
--------------------
EUR/USD — Spot: 1.1766
Technical Analysis
- Several breaches of the daily Ichimoku cloud top have still failed to produce a confirmed close above it, while narrowing Bollinger bands flag stored range energy.
- 1.1808, the 20-day upper Bollinger, is the first overhead test before 1.1851 pivot resistance. The 1.1717 10-day MA and 1.1709 100-day MA form nearby support.
- The flat 200-day MA near 1.1680 has supported closes since the April break, keeping range-break risk two-sided but no longer cleanly bearish.
Sell-side Research
- JP Morgan sees an uninteresting near-term setup before Friday’s U.S. payrolls, noting decent demand below 1.17 but little reason for a large move without news.
- SEB says technical momentum is approaching a long signal, with neutral positioning, favourable one-month seasonality and negative broad USD momentum pointing to 2-3 week upside risk.
- Danske expects a solid U.S. payroll print, but still sees later Fed-cut risk and relative rates as supportive for the pair over coming months.
Market Chatter
- Peace-deal optimism keeps the euro well clear of the 1.1650 inflection zone, although the rally remains sensitive to whether a concrete deal emerges.
- One-month implied volatility has fallen back near pre-conflict lows, and dealers say outright option demand remains low, though latest spot gains may draw EUR call buyers.
- Traders have unwound the second-largest euro long on record, leaving less positioning resistance if the move above 1.18 gains acceptance.
Strategy
The prior downside story has been rejected after spot reclaimed 1.1747. The better asymmetry is cautious upside, but Friday payrolls are a conviction gate. Follow strength only if 1.1808 accepts, while a return below 1.1710 would turn the reclaim into another false break.
--------------------
GBP/USD — Spot: 1.3623
Technical Analysis
- Cable’s former cloud-top resistance has turned into support on a closing basis, keeping the technical stance constructive while spot holds above the low 1.35s.
- 1.3658, the May 1 daily high, is the immediate clean resistance before the 1.3700 Fibonacci level. The 1.3514 cloud top and 1.3477 100-day MA are support.
- The pair has struggled to sustain gains above 1.36, so acceptance beyond 1.3658 is needed to turn short-covering into a larger breakout.
Sell-side Research
- Bank of America keeps a tactical bullish USD bias for May and expresses part of that view through short GBP/USD spot exposure.
- Goldman Sachs says UK local elections keep focus on political and fiscal premium, with limited event volatility priced and better value in sterling shorts through GBP/USD or GBP/AUD lower.
Market Chatter
- Voting is underway in today’s UK local elections, with polls closing at 2100 GMT and results due Friday to Saturday.
- Options markets show muted volatility expectations around the elections, and a poor ruling-party performance is described as already in the price.
- Sterling short exposure leaves squeeze risk if the pair exceeds 1.3716, with forced buying potentially bringing the 1.3867 2026 peak back into view.
Strategy
The reclaim of 1.36 makes fresh shorts less attractive, but election risk argues against chasing cable before the political result path clears. The underpriced move is a squeeze above 1.3658 toward 1.3716. Failure back below 1.3600 would restore range discipline.
--------------------
USD/JPY — Spot: 156.28
Technical Analysis
- Repeated failures to close below the daily cloud base and the 155.50 Fibonacci retracement keep bear-trap risk alive despite the intervention shadow.
- 156.00 has held as nearby support, with 155.50 the deeper Fibonacci floor. The 156.55/157.00 area caps first, while 157.93 remains the rejected recovery high.
- A daily close back above the upper technical band would revive recovery risk, but another accepted break below 155.50 would invalidate the bear-trap setup.
Sell-side Research
- Credit Agricole says IMF rules leave Japan scope for only two more intervention phases before November, but low liquidity could still make official action effective.
- Goldman Sachs argues intervention alone is unlikely to dictate USD/JPY levels if it pushes against macro fundamentals, although tactics remain critical.
Market Chatter
- Japanese officials continue to threaten intervention, with traders nervous after several sudden yen surges over the past week.
- A large two-week 152.00 USD put and JPY call option was reported on USD 500 million, underscoring demand for downside protection.
- The pair’s Wednesday fall from the 157.90 area to 155.00 is still shaping liquidity behaviour, even though spot has since stabilised above 156.00.
Strategy
The market is between a bear trap and an intervention threat, which makes spot chasing unattractive. The underpriced path may be a squeeze of premature yen bulls, but official-pressure risk caps conviction. Prefer defined-risk options until 157.00 or 155.50 accepts cleanly.
--------------------
USD/CAD — Spot: 1.3628
Technical Analysis
- The underlying bear trend from late March remains intact, but repeated long lower candle shadows show demand is still emerging on dips.
- The May 5 high at 1.3630 has been retested, with the 200-week MA at 1.3678 the cleaner overhead resistance. Support sits at the 1.3579 session low and 1.3540 lower Bollinger.
- Recent extremes around 1.3550 and 1.3630 continue to define the tactical range until one side gains acceptance.
Sell-side Research
- Bank of America maintains a bullish USD view for May and expresses part of that view through long USD/CAD exposure in options.
- Danske expects Friday’s U.S. payrolls to bring more macro-driven USD tailwinds if labour-market balance tightens or wage pressure recovers.
Market Chatter
- CAD has been relatively strong near the 1.3550 trend low, but a sharp fall in crude oil limited additional Canadian dollar gains.
- Risk appetite improved on Middle East peace progress, while USD/CAD avoided the larger volatility seen in other majors.
- Rate pricing showed a slight drop in Bank of Canada hike odds, with July still priced around 40% and December implying roughly 45bp of tightening.
Strategy
The pair is still a range trade, not a clean USD recovery. BofA’s USD view is useful, but CAD resilience near 1.3550 is real. Fade strength while 1.3678 holds, and press downside only if 1.3579 gives way with acceptance.
--------------------
AUD/USD — Spot: 0.7262
Technical Analysis
- The Aussie has finally broken its recent range, with fourteen-day momentum and daily RSI confirming the price pick-up.
- 0.7282, the January 2022 daily high, is the key resistance before the 0.7314 30-week upper Bollinger. The 0.7182 hourly cloud top and 0.7152 21-day MA define support.
- Buying dips remains favoured while the range break holds, but the close above the 0.7280/85 resistance zone is still the important confirmation.
Sell-side Research
- NAB expects the RBA to raise interest rates again in June, keeping the local policy backdrop supportive after this week’s hike.
- JP Morgan likes buying AUD/NZD on dips, citing AUD-supportive hedging, repatriation and investment flows after the RBA decision.
Market Chatter
- Risk appetite remains buoyant on hopes for a formal U.S.-Iran peace deal, although reports still say key issues are unresolved.
- Stop-loss buying is flagged above 0.7283, making the 0.7280/85 area the immediate squeeze trigger.
- Retail traders remain heavily short, which reinforces near-term squeeze risk if spot accepts above resistance rather than fading there.
Strategy
The easy breakout story is now visible, so paying up into 0.7280/85 is the risk. Still, short pressure and stop flow keep upside asymmetry alive. Stay constructive above 0.7230, with call spreads cleaner than outright spot near resistance.
--------------------
EUR/GBP — Spot: 0.8637
Technical Analysis
- The cross is correcting higher within the April bear trend, but fourteen-day momentum remains negative and is struggling to confirm price gains.
- 0.8650 is the minimum Fibonacci correction and 0.8668 is the 38.2% retracement cap. Support sits at the 0.8628 May 6 low and 0.8615 lower Bollinger.
- Lower ATR warns the market has become quieter, which can precede a range break or a reversal of the April trend.
Sell-side Research
- Goldman Sachs sees tactical EUR/GBP upside optionality as attractive into today’s UK local elections, with limited volatility premium priced for the day itself.
- The same bank still prefers sterling shorts in crosses that combine UK-specific risk with global terms-of-trade pressure.
Market Chatter
- Today’s UK local elections keep political and fiscal premium in focus for sterling, even though a poor result is widely expected.
- Muted options pricing around the vote leaves room for a sharper move if the result challenges the assumption that disappointment is already priced.
Strategy
The cross is no longer a clean bearish continuation trade while 0.8615/28 holds. The underpriced risk is election-led upside if sterling shorts rebuild too late. Use modest upside optionality above 0.8650, but cut the idea if 0.8615 accepts lower.
--------------------
Other Pairs
Technical Analysis
- NZD/USD has broken above 0.5930 after multiple failed attempts, shifting focus to breakout acceptance before the 0.6090/95 resistance zone.
- EUR/CHF remains below 0.92 after April’s break, with 0.9177 nearby resistance and 0.9146 the recent six-week low.
Sell-side Research
- JP Morgan likes buying AUD/NZD on dips, arguing AUD is supported by hedging, repatriation and investment flows despite some post-RBA profit-taking.
- Goldman Sachs says macro fundamentals should ultimately win over FX management, keeping downward pressure on EUR/CHF even if SNB willingness to intervene has increased.
Market Chatter
- NZD/USD rose sharply from Wednesday’s low as U.S.-Iran peace hopes hit Brent crude and supported risk-sensitive currencies.
- Swiss CPI doubled to 0.6% y/y in April, while the SNB is expected to keep its policy rate at zero at its 18 June meeting.
- Futures positioning shows leveraged CHF shorts are at a one-year extreme, which raises liquidation risk if EUR/CHF extends lower.
Strategy
Secondary pairs split into selective trades rather than one broad risk basket. NZD/USD needs acceptance above 0.5930, AUD/NZD is a dip-buying candidate only if the pullback stabilises, and EUR/CHF remains the cleaner slow-burn downside theme while 0.92 caps.
--------------------
Market Summary
EUR/USD — 1.1766 — Constructive
- Market consensus: Peace hopes and lighter positioning support upside, but payrolls and 1.1808 cap conviction.
- Recommendation: Follow strength only above 1.1808, keep downside risk defined near 1.1710.
GBP/USD — 1.3623 — Cautious bullish
- Market consensus: Sterling shorts and risk appetite support cable, while election risk limits clean chasing.
- Recommendation: Stay constructive above 1.3600, but require 1.3658/1.3716 for squeeze confirmation.
USD/JPY — 156.28 — Options preferred
- Market consensus: Bear traps support rebound risk, but intervention threats and downside hedges distort spot.
- Recommendation: Use defined-risk options, wait for 157.00 or 155.50 acceptance.
USD/CAD — 1.3628 — Range trading
- Market consensus: USD-positive bank views offset CAD resilience and lower oil pressure.
- Recommendation: Fade strength below 1.3678, press downside only below 1.3579.
AUD/USD — 0.7262 — Constructive
- Market consensus: Risk rally, breakout structure and short retail pressure support a squeeze into resistance.
- Recommendation: Stay constructive above 0.7230, prefer call spreads near 0.7280/85.
EUR/GBP — 0.8637 — Options preferred
- Market consensus: Upside optionality is attractive, but negative momentum keeps confirmation important.
- Recommendation: Use modest upside exposure above 0.8650, abandon if 0.8615 accepts lower.
OTHERS
- Market consensus: NZD/USD tests breakout acceptance, AUD/NZD favours dips, and EUR/CHF stays heavy.
- Recommendation: Use confirmation on secondary pairs rather than chasing the first risk-on impulse.
--------------------
Futures / Spot FX Context
Although the market review above is based primarily on spot FX analysis, listed FX futures may provide a relevant and transparent way for traders to express or hedge views on the same underlying currency themes. Futures prices may differ from spot prices due to factors such as interest rate differentials, contract expiry, liquidity, and basis, so traders should always refer to the appropriate futures contract and real-time market data before making any decision.
CME Group FX futures offer a centrally cleared, regulated marketplace where counterparty credit risk is mitigated through CME Clearing. They also provide transparent order-book pricing and execution rules, including a first-on-price, first-to-fill framework, which can support fairer access to liquidity across market participants. These features may make futures suitable vehicles for traders who want exposure to major FX themes within a standardized, exchange-traded framework.
When charting futures, the data provided could be delayed. Traders working with the ticker symbols discussed in this idea may prefer to use CME Group real-time data plan on TradingView: tradingview.com/cme/ .
This consideration is particularly important for shorter-term traders, whereas it may be less critical for those focused on longer-term trading strategies.
General Disclaimer:
The trade ideas presented herein are solely for illustrative purposes forming a part of a case study intended to demonstrate key principles in risk management within the context of the specific market scenarios discussed. These ideas are not to be interpreted as investment recommendations or financial advice. They do not endorse or promote any specific trading strategies, financial products, or services. The information provided is based on data believed to be reliable; however, its accuracy or completeness cannot be guaranteed. Trading in financial markets involves risks, including the potential loss of principal. Each individual should conduct their own research and consult with professional financial advisors before making any investment decisions. The author or publisher of this content bears no responsibility for any actions taken based on the information provided or for any resultant financial or other losses.
AUDUSD ShortThat pink line sitting around 0.6567 is a clear sell-side liquidity pool where institutional stop losses have been engineered and resting below that level you have a massive amount of buy stops that smart money will look to raid as a liquidity grab. The price action from October through January shows a classic displacement off that institutional level followed by a fair value gap expansion to the upside which confirms that this is a key order block origin point. Looking forward that arrow suggests smart money is eyeing a return to that liquidity void to sweep the equal lows and tap into the breaker block before any potential reversal back into the premium range.
AUD Supply-Demand Short SignalAUD Short Idea
Technical:
- price reacting off of weekly levels of supply, price failed to create new high and removed key level of support structure.,
Sentiment/Fundamentals:
- With price does support a stronger AUD and with RBA raising interest rates, the last 5x times over the last 10x years the COT reports have reached between 90-110k longs, they have taken profits. This is why I would no longer be looking for longs, but instead targeting shorts.
Options:
1) Valid 4hr supply zone short setup
2) Wait for price to pullback into 4hr supply and wait for LTF confirmation.
Aussie Bull Run: Why AUD Futures Are the 2026 Trade to WatchThe March 2026 Australian dollar (A6H26) futures have emerged as a premier opportunity for currency traders. As of late December 2025, prices have surged to new contract highs, supported by a perfect storm of technical and fundamental catalysts. For the modern trader, the "Aussie" is no longer just a proxy for copper; it is a sophisticated bet on global technology and fiscal shifts.
Technical Mastery and MACD Momentum
The daily bar chart for A6H26 reveals a textbook bullish trend. Prices recently breached key resistance, establishing a solid floor for further appreciation. Technical analysts point to the Moving Average Convergence Divergence (MACD) , which remains in a strong posture. The MACD line sits comfortably above the signal line, with both trending higher.
The path of least resistance is clearly upward. A sustained move above the. 6729 contract high activates a buy signal for many institutional desks. Traders are now eyeing a primary price objective of 6950 . To manage risk, professional stops are typically placed just below support 6625 , ensuring a disciplined approach to this high-conviction setup.
Macroeconomics: The Fed’s Dovish Pivot
A primary driver for the Australian dollar's strength is the diverging path of global central banks. The U.S. Federal Reserve has transitioned toward a more accommodative stance to support labor markets. Lower U.S. interest rates naturally weigh on the Greenback, making high-yielding currencies like the AUD more attractive to international carry traders.
Conversely, the Reserve Bank of Australia (RBA) maintains a hawkish bias. Persistent domestic inflation and a resilient job market have forced Australian policymakers to keep rates elevated. This widening interest rate differential acts as a powerful magnet for global capital, fueling the "long Aussie" trade into 2026.
Geostrategy: Powering the AI Revolution
Australia’s geostrategy has shifted from traditional mining to securing the "Green and Digital" transition. The nation is a critical supplier of lithium, copper, and rare earths , the literal building blocks of AI data centers and renewable energy. As global demand for computing power explodes, Australia’s trade balance benefits from a structural "AI premium."
Furthermore, the Australian government is aggressively implementing blockchain-based supply chain tech . These innovations reduce friction at the border and enhance the security of resource exports. By leading in "High-Tech Mining," Australia ensures its currency remains a vital asset in the global technological race.
Professional Note: Success in AUD futures requires monitoring both the RBA’s tone and China’s industrial demand. While the technicals suggest a move to .6950, stay alert for any sudden shifts in global risk appetite that could spark short-term volatility.
How I Spot Trading Opportunity – Part IILast week, we discussed how to spot trading opportunities using multiple asset classes. I also created multiple tabs for each asset class, such as currencies, commodities, and indices. Within each asset class, there are multiple products.
The whole idea is this: if you already have a trading methodology that is working well for you in a particular asset, say gold or silver, and you have been trading it for a long time, why not apply the same trading methodology across other markets?
It is not too difficult to pick up trading ideas fairly quickly from the market at any point in time. And I am going to share with you how I do that.
Micro E-mini Nasdaq Futures & Options
Ticker: MNQ
Minimum fluctuation:
0.25 index points = $0.50
Disclaimer:
• What presented here is not a recommendation, please consult your licensed broker.
• Our mission is to create lateral thinking skills for every investor and trader, knowing when to take a calculated risk with market uncertainty and a bolder risk when opportunity arises.
CME Real-time Market Data help identify trading set-ups in real-time and express my market views. If you have futures in your trading portfolio, you can check out on CME Group data plans available that suit your trading needs www.tradingview.com
The Aussie on the brink: annual highs under siegeFollowing the bullish impulse initiated at the end of November, the Aussie is now challenging its annual highs. With the latest monetary policy decisions largely digested and implied volatility declining, the market is refocusing on microstructure and flows.
Fundamental Analysis
The RBA’s latest hold, the third in a row, confirmed a “hawkish hold” bias that continues to support the Australian dollar. The central bank acknowledges that inflation is proving broader than initially expected and remains alert to second-round risks, keeping real rate expectations elevated for Australia. The RBA Rate Tracker, which measures the implied probability of a rate change, is also starting to price in a moderate chance of a hike in 2026.
On the US side, while the official message remains cautious, the market has mainly noted the inability of US yields to re-establish a sustained upward trend. This is compounded by a well-established seasonal factor, as December has historically been a period of USD underperformance, driven by hedging flows and profit repatriation.
The broader global backdrop is also supportive for the AUD given its strong correlation with commodities, with copper and gold trading at historically high levels.
Technical Analysis
From a technical standpoint, the daily chart of 6AH6 shows a clear structure of higher lows and higher highs since the November trough. Prices are trading above key moving averages, notably the 55-day average, which is acting as dynamic support. The current consolidation is taking place above former value areas, a typical feature of a market accepting higher prices rather than one in distribution.
Volume analysis provides additional insight. Upward phases have been accompanied by rising volumes, while recent pullbacks have occurred on more moderate volume. This suggests an absence of aggressive selling pressure. The visible volume profile on the chart shows a high concentration of trading activity around 0.6550–0.6600, corresponding to a former equilibrium now located below the market. Since the bullish recovery, price has moved into a low-volume area above, indicating that the market is exploring levels with limited historical trading.
The current zone around 0.6650–0.6670 appears more like a pause than a definitive resistance. As long as price remains above the core of the volume profile, probabilities favor continuation or, at a minimum, a high-level consolidation.
Sentiment Analysis
Retail sentiment on spot AUD/USD is particularly skewed, with retail traders heavily net short. Some platforms even show ratios exceeding 80% or 90% short positions. This configuration is typical of market phases where retail participants attempt to anticipate a top based on psychological levels or visible resistance, without waiting for a confirmed reversal signal.
From a contrarian perspective, this positioning represents potential fuel for further upside. It indicates that the market is not overloaded with fragile speculative longs, but instead crowded with sellers who may be forced to cover if key levels are broken.
On the institutional side, no major desks appear to be arguing for an immediate, structural bearish reversal in AUD/USD.
Options Analysis
In the options space, calls are more in demand and more expensive, confirming a dominant short-term bullish bias and a market that is primarily expecting extension.
The options heatmap also shows large clusters of call options at the 0.6700 and 0.6750 strikes. In the event of an approach to or break above these levels, call sellers could find themselves short gamma and forced to hedge via futures buying, thereby amplifying the bullish move.
Trade Idea (6AH6)
With a lighter news calendar and market liquidity gradually declining, there is limited likelihood of sufficient catalysts to reverse the trend before year-end. In this context, a directional bullish strategy remains the most coherent, at least over the next two weeks.
Entry zone: on pullbacks toward 0.6620–0.6630
Stop loss: below the 55-day average, currently around 0.6540
Primary target: 0.6750
Extended target: 0.6850 in the event of an options-driven squeeze
Final Thoughts
Even though the AUD has shown some hesitation over the past few sessions, signals continue to converge toward an intact bullish potential. Fundamentals are supportive, technical analysis points to acceptance of higher prices, retail sentiment is heavily contrarian, and options positioning highlights the risk of a squeeze above well-identified levels.
In this type of environment, the market’s ability to force weak hands out should not be underestimated, particularly during periods of lower liquidity. As long as the structure remains intact, a bullish extension beyond the annual highs remains the most coherent scenario into year-end, ahead of a likely consolidation phase in early 2026.
---
When charting futures, the data provided could be delayed. Traders working with the ticker symbols discussed in this idea may prefer to use CME Group real-time data plan on TradingView: tradingview.com/cme/ .
This consideration is particularly important for shorter-term traders, whereas it may be less critical for those focused on longer-term trading strategies.
General Disclaimer:
The trade ideas presented herein are solely for illustrative purposes forming a part of a case study intended to demonstrate key principles in risk management within the context of the specific market scenarios discussed. These ideas are not to be interpreted as investment recommendations or financial advice. They do not endorse or promote any specific trading strategies, financial products, or services. The information provided is based on data believed to be reliable; however, its accuracy or completeness cannot be guaranteed. Trading in financial markets involves risks, including the potential loss of principal. Each individual should conduct their own research and consult with professional financial advisors before making any investment decisions. The author or publisher of this content bears no responsibility for any actions taken based on the information provided or for any resultant financial or other losses.
AUD Buy & Sell Levels (Statistical Based)📌 AUD ER Levels for Monday
Worth noting: a Straddle has been placed right at the second tier of key support/resistance levels.
Not massive — ~$200K in premium — but straddles on AUD are rare.
This one deserves attention.
When a straddle aligns with ER boundaries, as it does now, those edges become high-probability reaction zones — ideal for limit entries and stop-loss placement.
📌 Bottom line:
If the Aud soars or crashes next week — and with a packed news calendar ahead, volatility is likely —
we’ll know exactly where to place our limits…
and hide our stops.
Are you using ER? Or still guessing support/resistance?
P.S. Transparency first. No hype. Just real results.
Bulls Cornered at Historic Oversold Zone - Spring Loads📊 To see my confluences and/or linework, step 1: grab chart, step 2: unhide Group 1 in object tree, step 3: hide and unhide specific confluences. 🎨
🎯 6A1!: Bulls Cornered at Historic Oversold Zone - Spring Loads
The Market Participant Battle:
Bears have systematically trapped bulls into a proven demand zone (Point 2 at 0.65880), creating a powerful compression pattern that's about to snap. The numbered reference points on the chart show how Point 3 closed above Point 1, making Point 2 a battlefield where proven buyers are congregating. At Point 4, we're returning to this exact zone where institutional buyers previously defended aggressively. This is a classic case where oversold bears have overplayed their hand, and smart money is quietly accumulating for a violent reversal.
Confluences:
Confluence 1: Proven Buyer Zone & Anchored VWAP Deviation
The chart shows a powerful setup where price has returned to a proven buyer zone at 0.65880 (Point 2). What's particularly compelling is the anchored VWAP from Point 1, where price has pulled back to the 2nd deviation before bouncing above the 1st deviation. This is textbook mean reversion behavior indicating bears are exhausted and buyers are stepping in with conviction.
Confluence 2: Fixed Range Volume Profile POC Magnet
The Fixed Range Volume Profile from Points 0→3 reveals the Point of Control (POC) sits exactly where Point 4 is testing. This is institutional positioning at its finest - the highest volume traded area acts as a massive magnet pulling price back for accumulation. Smart money doesn't ignore these levels.
Confluence 3: Footprint Chart Bullish Imbalances
The footprint chart reveals stacked bullish imbalances with positive delta on large red bars - a clear sign absorption is occurring. On Friday the 19th at 3pm, we see positive delta on a massive red bar with price closing above a bullish imbalance. Bears tried to push through but were absorbed by aggressive buyers.
Confluence 4: Second-Degree Bullish Divergence
This is where it gets interesting - we have a double-layered bullish divergence. Price made a lower low at Point 4, but both RSI and MFI made higher lows. Additionally, we see candle-level bullish divergence forming. Both indicators are oversold at Point 4, creating a powder keg setup.
Confluence 5: OBV Breakout & Bollinger Band Squeeze
On-Balance Volume (OBV) has broken two down-sloped trendlines, indicating incoming buyers despite price weakness. Monthly VWAP shows price crossed under and is now back above, while price has been touching the lower Bollinger Band repeatedly - a self-similar pattern to previous major reversals.
Web Research Findings:
- Technical Analysis: Multiple analysts noting AUD/USD holding above crucial 0.6600 support despite weak employment data
- Recent News/Earnings: RBA surprisingly held rates at 3.85%, defying market expectations for cuts
- Analyst Sentiment: COT data shows fastest short covering in 4.5 years - institutional repositioning underway
- Data Releases & Economic Calendar: Fed cut rates by 25bp to 4.00-4.25% range on September 17, weakening USD
- Interest Rate Impact: Rate differential narrowing as Fed cuts while RBA holds - bullish for AUD
Layman's Summary:
Think of this like a rubber band stretched to its limit. The Australian Dollar has been beaten down so severely that even bad news can't push it lower. When everyone's betting one way (shorts), and the fundamentals start shifting (Fed cutting, RBA holding), you get explosive reversals. The smart money is quietly switching sides while retail remains bearish.
Machine Derived Information:
- Image 1: Trend channel setup showing Points 1-3 progression - Significance: Clear bullish channel break and retest pattern - AGREES ✔
- Image 2: Bollinger Bands with R/R overlay showing Gap Zones - Significance: 4.99 risk/reward ratio potential with clear zones - AGREES ✔
- Image 3: OBV/RSI/MFI indicator panel - Significance: Triple bullish divergence with OBV trendline breaks - AGREES ✔
- Image 4: Object tree revealing hidden confluences structure - Significance: Professional multi-layer analysis with VWAP and Volume Profile - AGREES ✔
- Image 5: Fixed Range Volume Profile visualization - Significance: POC sitting exactly at current test level confirming support - AGREES ✔
Actionable Machine Summary:
All charts unanimously confirm the bullish reversal setup. The combination of technical structure (channel support at proven buyer zone), volume analysis (POC magnetic effect drawing price), momentum divergences (RSI/MFI/OBV all signaling reversal), and footprint absorption patterns creates an A+ institutional accumulation setup. Entry at 0.66080 with stop at 0.65410 targeting 0.67045 provides exceptional 4.99:1 risk/reward with clear invalidation levels.
Conclusion:
Trade Prediction: SUCCESS ✅
Confidence: High
This setup represents a textbook case of market participants getting trapped at extremes. Bears have pushed too far into a proven demand zone, COT data shows record short covering beginning, and technical indicators are screaming oversold with multiple divergences. The risk/reward of 4.99:1 with clear invalidation makes this a must-take opportunity. When institutions flip from record shorts to covering, the momentum shift can be violent. Take the trade with confidence.
AUD: Revisit Key Supply Zone, Potential Short Setup.The AUD Futures 6A1! has revisited a key supply zone established earlier this month, presenting a potential opportunity for another short trade setup. According to the latest COT report, non-commercial traders have increased their short positions, indicating a bearish sentiment. However, it's crucial to keep an eye on the DXY, as recent price movements over the past two days suggest a possible shift in its trend. Given that August often brings uncertainty and lack of clear direction, this environment requires careful monitoring. Consider this analysis as one of several factors in your trading decision-making process.
✅ Please share your thoughts about 6A1! in the comments section below and HIT LIKE if you appreciate my analysis. Don't forget to FOLLOW ME; you will help us a lot with this small contribution.
a return to dominant sellers origin presents a =BUYers world1->3 : number 3 closes below ( alibet slightly) number 1 ,
this makes number 2 a solid major high, as it has proven itself
to have more selling power then the players from number 1
3->4 : we return to number 2 and assess the strength of the sellers
from number 2 , versus buyers from number 3
* what do I think will happen ?
* we have a bearish divergence on mfi , rsi and accum/dist
* we have overbought on rsi and mfi
* on a higher timeframe price has stopped going at an upward or sideways
angle and begun trending to a downturn angle which hints that market
control might be shifting
percise double bottom alongside mfi+rsi oversold points upside1 & 2 . the percision of the double bottom
makes me think a return to #3 makes sense ,
perhaps there are alot of buy orders that sellers are not
able to fill, and therefore theygot exhausted there.
2. we saw at #2 that increasing volitility still was not able to
lower it by even a tick....
3. it could be a fake pullback... but rather than being paranoid
i'll just go with basic common sense and say probably we going up
4. we have a 71% follow through rate for this series of chaos theory zones
for our lookback period, so I like those odds.
5. i'm going to wait for it to enter the zone above , as per theory it needs to complete the follow through first to zoen below...