 Short
ShortIn-depth trading ideas
Short
Last chance to short $OSE:NK2251!
OSE:NK2251! formed top 73000 at 23 June, move downward and formed wave 1 & 2. The key point to confirm downtrend is 66500. If drop below, the 1st target is 63000 (wave 3) and rebound to 66000(wave 4). Then the downtrend continues dropping to final target 59600 and form A.
Short
Nikkei Set To Bounce? Though Big Break Appears UncertainI make a simple, technical case for why I think the Nikkei could have a good start to the week, but correlations between its own stocks and the Nasdaq 100 paint a murkier picture.
MS
 Long
Long
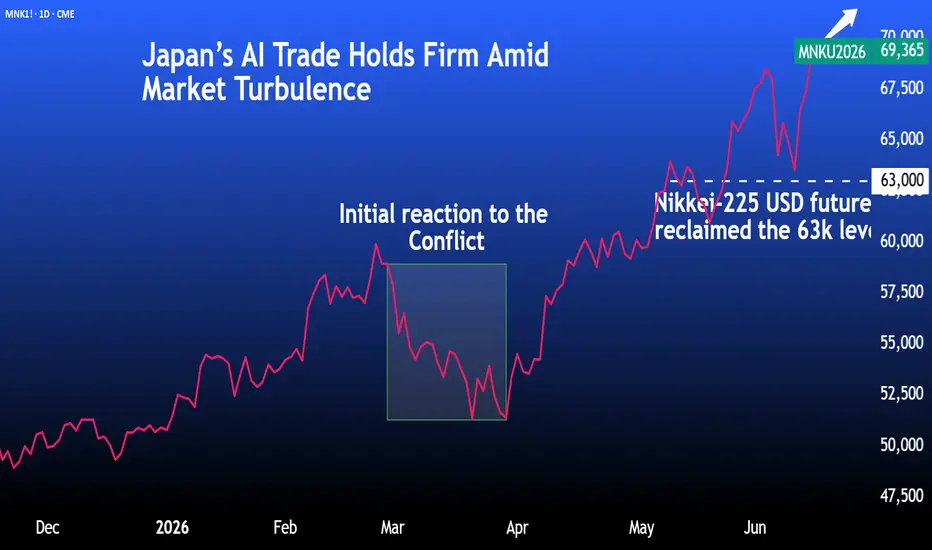
Japan’s AI Trade Holds Firm Amid Market TurbulenceThe recent pullback in Japanese equities comes at a pivotal juncture. After climbing to record highs on the back of AI-driven optimism and robust foreign inflows, the Nikkei-225 faced a period of geopolitical uncertainty and growing valuation concerns that prompted a bout of profit-taking. With geopolitical tensions having eased, improving risk appetite could once again support a recovery in Japan’s AI-trade.
How AI Optimism Powered the Nikkei’s Remarkable Rise and Retreat
Japanese equities staged a strong post-Golden Week recovery in early May, buoyed by improving risk appetite and expectations of a potential easing in US-Iran tensions. However, the rally paused briefly in mid-May as rising oil prices and renewed geopolitical uncertainty encouraged profit-taking.
Technology stocks led a 13% surge that lifted the Nikkei-225 above 68,000 to a record high on 3/June, as investors sought exposure to Japan's central role in the AI supply chain.
This rally stumbled a day later when Broadcom's earnings triggered a global selloff in AI-linked stocks. Although demand remained strong, investors were left underwhelmed by the company's outlook, reviving concerns that valuations had become stretched. Combined with uncertainty surrounding the US-Iran ceasefire and rising Treasury yields, the Nikkei fell more than 5% from its early-June peak.
Even so, the broader AI investment theme remains intact. Global demand for AI infrastructure has yet to show meaningful signs of reversal, and Japanese companies remain deeply embedded in that growth story. Near-term volatility, elevated valuations and profit-taking could drive further downside in the weeks ahead. However, if AI spending continues to expand as expected, any correction may ultimately create the foundation for an even stronger rebound in the tech-heavy Nikkei-225.
Not All Boats Rose With the Tide
The Nikkei’s surge to record highs may have looked like a broad-based market rally, but beneath the surface, leadership was surprisingly narrow. A handful of AI-linked stocks and financial names did much of the heavy lifting, masking a far more uneven picture across the wider market.
Source: TradingView
Technology and semiconductor companies dominated performance as investors poured into businesses tied to the global AI buildout. Two major beneficiaries were Kioxia Holdings and Murata Manufacturing.
Kioxia supplies the flash memory and solid-state drives (SSDs) that store and process the vast amounts of data used by AI data centres, while Murata provides the capacitors and power-management components that enable increasingly powerful AI servers. As hyperscalers accelerate spending on AI infrastructure, both companies continue to benefit from rising demand across the supply chain.
Financials were another standout, supported by growing expectations that the Bank of Japan would raise interest rates. For banks, a higher rate environment generally translates into stronger lending margins and improved earnings prospects.
Source: Reuters poll for May and June
Outside these pockets of strength, however, many industrial, consumer and cyclical sectors failed to keep pace, highlighting just how concentrated the Nikkei’s rally had become.
Overseas Buyers Hit the Brakes After an Eight-Week Buying Spree
Every major rally needs buyers, and in Japan's case, foreign investors played that role. As the Nikkei pushed deeper into record territory, overseas funds continued to pour money into the market, contributing ¥1.85 trillion of net inflows during May alone. Their steady demand provided an important tailwind for equities during one of the index's strongest runs of the year.
Source: Japan Exchange Group
But as the market approached new highs, some investors began asking a simple question: how much of the good news was already priced in? In the week ended 29/May, overseas investors sold a net ¥395 billion of Japanese equities, bringing their eight-week buying streak to an end. The cautious tone persisted into early June, with foreign investors recording a further net outflow of roughly ¥81 billion in the first week of the month.
While these outflows were modest relative to the scale of earlier inflows, they pointed to a shift in behaviour. Rather than adding aggressively to positions at record highs, investors appeared increasingly focused on protecting profits as valuations stretched and market expectations became harder to exceed. For a market that had relied heavily on overseas buying, two consecutive weeks of net foreign selling served as an early sign that the rally was entering a more challenging phase.
Historical Trade Setup
The current pullback echoes the market turbulence that followed the onset of the Middle East conflict in late February 2026. In both cases, a strong AI-driven market was interrupted by a geopolitical shock that temporarily shifted investors' attention away from growth opportunities and towards risk management.
History suggests that geopolitical shocks rarely derail a structural bull market on their own. More often, they create periods of consolidation as investors reassess risks and reduce exposure. Following the conflict announcement, Japanese equities initially came under pressure as investors weighed the implications for global growth and trade. Yet as those concerns eased, capital flowed back into AI-linked technology stocks, helping the Nikkei-225 reclaim the 63,000 level.
For instance, a trader who went long on the front-month Micro Nikkei (USD) futures on 31/Mar/2026 and exited on 08/May/2026 would have realised a gross mark-to-market gain of USD 6,335.
Market participants can gain exposure through CME Micro Nikkei (USD) futures, which are one-tenth the size of the standard contract. The smaller contract offers greater flexibility in position sizing and requires less capital, making it easier to participate in moves in the Nikkei while managing risk.
With the BoJ meeting approaching, the USD-denominated futures offer a way to gain exposure to Japanese equities while reducing direct exposure to potential yen volatility and policy-driven currency swings.
Long CME Micro Nikkei (USD) Futures
Entry = USD 51,115
Exit = USD 63,785
PnL: 0.50 x (63,785 - 51,115) = USD 6,335
This content is sponsored.
MARKET DATA
CME Real-time Market Data helps identify trading setups and more effectively express market views. If you have futures in your trading portfolio, you can check out on CME Group data plans available that suit your trading needs at tradingview.com/cme .
DISCLAIMER
This case study is for educational purposes only and does not constitute investment recommendations or advice. Nor are they used to promote any specific products, or services.
Trading or investment ideas cited here are for illustration only, as an integral part of a case study to demonstrate the fundamental concepts in risk management or trading under the market scenarios being discussed.
MLong
Buyers to Support Nikkei Futures (NKD) Pullback, Eyeing 72870Nikkei Futures (NKD) continues to demonstrate remarkable strength as it extends into new all‑time highs, reinforcing the bullish sequence that began from the March 23, 2026 low. This upward momentum favors additional gains in the near term. From the March 23 low, wave 1 concluded at 63,880, followed by a corrective pullback in wave 2 that ended at 59,352. The internal subdivision of wave 2 unfolded as a zigzag, a common corrective structure, before the Index resumed higher. The decisive break above the wave 1 peak confirmed that wave 3 had begun, signaling continuation of the impulsive advance.
From wave 2, the initial leg wave (i) ended at 62,075, while the subsequent pullback in wave (ii) found support at 61,040. The rally extended further, with wave (iii) reaching 65,695, before a modest dip in wave (iv) concluded at 64,650. The final leg, wave (v), advanced to 66,520, completing wave ((i)) of a higher degree. At present, a corrective phase in wave ((ii)) is unfolding, designed to retrace the cycle from the May 20, 2026 low. This correction is expected to provide a healthy consolidation before the broader rally resumes.
In the near term, as long as the pivotal support at 59,352 remains intact, the pullback should ultimately find support within the typical 3, 7, or 11 swing sequence. Consequently, the broader outlook continues to favor further upside once the current consolidation completes, maintaining the bullish trajectory established since March.

Nikkei Futures (NKD) Approaches End of Cycle from March 2026 LowThe short‑term Elliott Wave view in Nikkei Futures (NKD) shows the cycle from the March 30, 2026 low unfolding as an impulse. This sequence is now approaching completion. From that low, wave ((i)) advanced to 61,000, followed by a corrective decline in wave ((ii)) that ended at 58,651. The Index then resumed higher in wave ((iii)), which subdivided into a smaller impulsive structure.
From the end of wave ((ii)), wave (i) advanced to 60,025, while wave (ii) corrected to 59,150. The Index rallied in wave (iii) toward 63,400, before a dip in wave (iv) concluded at 62,020. The final leg, wave (v), reached 63,850, completing wave ((iii)) at a higher degree. A subsequent pullback unfolded in wave ((iv)) as a zigzag. Down from wave ((iii)), wave (a) ended at 62,390, wave (b) advanced to 63,285, and wave (c) declined to 61,805. This completed wave ((iv)) at a higher degree.
Near term, as long as price remains above 58,651, the Index retains scope to extend higher and complete wave ((v)). That move would also finalize the cycle from the March 30 low. Once this sequence concludes, a larger degree pullback should correct the entire cycle. Such a correction will serve as consolidation, balancing prior gains and preparing the structure for the next bullish advance.

How to Tell the Market is in Euphoria?How to Tell the Market is in Euphoria stage?
Sir John Templeton once said:
“Bull markets are born on pessimism, grow on skepticism, mature on optimism, and die on euphoria.”
We will case study on the Japanese stock index how to identify a euphoria run-up.
Before 28 Feb crisis, we saw a run-up. Within this run-up, we saw 2 distinct euphoria characteristics:
i) Regular overnight gaps and
ii) Huge net change at its opening
Micro Nikkei Futures
Ticker: MNI
Minimum fluctuation:
5.00 index points = ¥250
Disclaimer:
• What presented here is not a recommendation, please consult your licensed broker.
• Our mission is to create lateral thinking skills for every investor and trader, knowing when to take a calculated risk with market uncertainty and a bolder risk when opportunity arises.
CME Real-time Market Data help identify trading set-ups in real-time and express my market views. If you have futures in your trading portfolio, you can check out on CME Group data plans available that suit your trading needs www.tradingview.com
Short
'Takaichi Trade' Powering Nikkei’s Next Upside MoveJapanese equities roared back in February, with the Nikkei climbing nearly 10% as markets rallied behind Takaichi’s pro-growth agenda and a weaker yen.
Yet beneath the optimism sits a key vulnerability: Japan’s heavy reliance on imported energy means any disruption in Middle Eastern supply routes could quickly turn a weaker yen into an inflationary shock.
February’s ~10% Nikkei Surge: Markets Embrace the ‘Takaichi Trade’
In February, the Nikkei 225 Index posted a gain of 9.9%, with much of the momentum building early in the month after Sanae Takaichi’s snap election victory. Markets quickly leaned into the so-called “Takaichi trade” which includes purchasing Japanese equities, and selling the yen and government debt.
On 8/Feb, Japanese Prime Minister Sanae Takaichi’s coalition secured a historic landslide victory in the snap election, giving her government a strong mandate and opening the door for the increased fiscal spending she had promised.
The following week began on a softer note as AI-related concerns and a weaker-than-expected Q4 2025 GDP print (0.2% annualised vs 1.6% estimated) weighed on sentiment. However, strong January export growth of 16.8% YoY helped lift equities, reversing earlier losses.
Late in the month, the Nikkei 225 broke above the 59,000 mark after Takaichi expressed reservations about further Bank of Japan (BoJ) rate hikes. The resulting yen weakness offered a tailwind for Japan’s export-driven economy.
Early March, however, brought a sudden pause to that momentum. Rising geopolitical tensions unsettled risk sentiment and prompted a pullback in equities.
Takaichi’s Growth Bet: Fiscal Stimulus, BOJ Doves, and a Nikkei Eyeing 60k
Takaichi’s election victory delivered an immediate boost to Japanese equities, as investors warmed to her pro-growth agenda and the $135 billion fiscal push first outlined in November. Her coalition’s landslide win in the snap election secured a commanding majority in the lower house, strengthening her ability to follow through on spending pledges, including temporary tax relief on food.
Policy signals have also leaned supportive. Takaichi’s nomination of two reflationist academics to the BoJ board suggests a preference for maintaining accommodative conditions and avoiding a premature tightening cycle, echoing elements of the Abe-era playbook.
Against this backdrop, foreign investors have turned decisively positive with net inflows reaching roughly ¥2.57 trillion in the weeks that followed. The scale and consistency of these inflows point to renewed global confidence in Japan’s policy direction.
Source: Japan Exchange Group
Looking ahead, March could prove pivotal. Shunto wage negotiations, with pay rises expected near 5%, may provide a domestic demand floor, while clarity on the stimulus focused on AI, semiconductors, and defence could propel the Nikkei decisively toward the 60,000 mark.
A key vulnerability in the current policy mix lies in its fiscal implications. Expanded stimulus would likely require higher government borrowing, adding pressure to Japan’s already elevated public debt levels.
Source: International Monetary Fund
A second concern is the currency channel. The more aggressively the government spends to ease cost-of-living pressures, the greater the risk of further yen weakness. While a softer yen supports exporters in the short term, it also raises the cost of imports: particularly energy and food, which Japan relies on heavily. Over time, this import-driven inflation could erode household purchasing power and begin to weigh on the broader equity narrative.
The Energy Risk Behind Japan’s Ongoing Rally
Japan’s heavy reliance on imported energy makes the currency channel discussed above even more consequential. Roughly 95% of its oil imports come from the Middle East, with about 70% passing through the Strait of Hormuz, a route now effectively disrupted by the escalating regional tensions in the Middle East.
LNG exposure is smaller but still notable, with around 11% of imports sourced from Qatar, Oman, and the UAE. Japanese utilities have increased LNG stockpiles to 2.19Mt, equivalent to about 12 days of consumption.
According to Kpler, if Hormuz flows alone were disrupted, Japan’s LNG reserves could theoretically cover around 44 weeks of demand given the limited volumes passing through the strait. However, if all LNG imports were halted, the country would have only about three weeks of supply, highlighting the fragility of Japan’s energy security.
In this context, escalating U.S.-Iran tensions introduce a meaningful macro risk: any sustained disruption could lift energy prices sharply, and with a weaker yen amplifying import costs, inflation pressures could build quickly and challenge the durability of Japan’s equity rally.
Nikkei Rides the Yen Slide, but the BoJ’s March Meeting Holds the Key
The Yen-Nikkei dynamic that was observed in mid to late February remains the key tactical driver for the market. As the yen continued to weaken into the end of the month, Nikkei futures quickly pushed higher.
The move gained further traction after Takaichi’s nomination of two dovish candidates to the BoJ, sending the yen another 1% lower. A softer currency tends to lift Japan’s export heavyweights as overseas revenues translate into stronger earnings in yen terms.
A Reuters poll conducted between February 10-18 showed broad consensus among 76 economists that the BoJ will likely keep rates unchanged at its March meeting. Among the 44 who specified the timing of the next hike, June was the most widely expected window, followed by July (34%) and April (20%).
The BoJ has nonetheless signalled readiness to begin tightening. At this stage, the pace of rate hikes may matter more than the starting point. Whether policymakers move gradually or opt for a more assertive path will be a key factor shaping market expectations in the months ahead.
That said, rising import costs could keep inflation elevated and complicate the BoJ’s policy calculus. If imported price pressures begin feeding through more visibly, the room to stay patient on rate hikes may narrow.
Historical Trade Setup
A similar pattern played out in early October 2025, when markets began reacting to the prospect of larger fiscal spending after fiscal dove Sanae Takaichi emerged as leader of the ruling party and Japan’s next prime minister. The reaction was swift and familiar: Japanese equities rallied while the yen weakened, as investors priced in a more accommodative policy mix and a reduced likelihood of near-term rate hikes from the BoJ.
In such an environment, USD-denominated Nikkei futures offered a cleaner way to express the trade. By removing direct yen exposure, investors could capture the equity upside without the potential drag from currency depreciation, making the position a purer play on the Nikkei itself.
For instance, a trader who went long MNKZ2025 on 6/Oct/2025 and exited on 4/Nov/2025 would have realised a gross mark-to-market gain of USD 3,297.50.
Market participants can implement similar positioning through CME Micro Nikkei (USD) futures, which are one-tenth the size of the standard contract. The smaller contract size allows for more granular positioning and a lower capital outlay while maintaining exposure to movements in the Nikkei
Long CME Micro Nikkei (USD) Futures (MNKZ2025)
Entry = USD 46,155
Exit = USD 52,750
PnL: 0.50 x (52,750 – 46,155) = USD 3,297.50
This content is sponsored.
MARKET DATA
CME Real-time Market Data helps identify trading setups and more effectively express market views. If you have futures in your trading portfolio, you can check out on CME Group data plans available that suit your trading needs at tradingview.com/cme .
DISCLAIMER
This case study is for educational purposes only and does not constitute investment recommendations or advice. Nor are they used to promote any specific products, or services.
Trading or investment ideas cited here are for illustration only, as an integral part of a case study to demonstrate the fundamental concepts in risk management or trading under the market scenarios being discussed.
MLong

Nikkei UpsideNikkei -- Breakout after consolidation.......
Strong Bullish Breakout........
Targets mentioned.
FIrst Entry Now.
Second Entry -- after price crosses 52560
Stop Loss -- 50010.
Targets are Fibonacci Ratios as shown on Chart.....
All across the globe are wars. Market dynamics may change drastically at any time.
So please exercise caution and believe in Stop loss...
Long
Nikkei 225 Wave Analysis – 19 December 2025
- Nikkei 225 reversed from support area
- Likely to rise to resistance level 51150.00
Nikkei 225 index recently reversed from the support area between the pivotal support level 48500.00 (which has been reversing the price from November) and the lower daily Bollinger Band.
The support level 48500.00 was strengthened by the 50% Fibonacci correction level of the previous sharp upward impulse from September.
Given the clear daily uptrend, Nikkei 225 index can be expected to rise to the next resistance level 51150.00 (which stopped earlier waves B and 1).
Long
Dovish Agenda & AI Boom Propel Nikkei to Record HighsJapan’s Nikkei-225 surged past 51,000, reflecting renewed confidence in the nation’s growth outlook. The rally has strengthened under the new PM, Sanae Takaichi, whose pro-market reforms and fiscal agenda have revived optimism reminiscent of Abenomics.
Takaichi’s Dovish Ambitions Set the Stage for Japan’s Next Growth Phase
Optimism over pro-spending policymaker Sanae Takaichi’s incoming government has lifted sentiment across Japanese markets.
Japan’s new PM is preparing an economic stimulus expected to surpass last year’s ¥13.9 trillion (USD 92 billion) package, aimed at easing inflationary pressures on households while channelling investment into high-growth industries and national security.
Her “responsible proactive fiscal policy” mirrors Abenomics, restoring confidence in continuity and state-led growth. Yet, it offers little hope of changing Japan’s renowned legacy of short-lived prime ministers.
Despite winning the LDP leadership, her minority government relies on support from the Japan Innovation Party. Still, history suggests that when a dovish leader takes office, the Nikkei-225 often rallies, even amid political uncertainty. We previously explored this trend in detail.
Foreign Investors Flock to Japan Amid AI Boom
After modest outflows in September, October marked a sharp turnaround for Japan, with foreign investors returning as net buyers.
Source: Japan Exchange Group
Beyond confidence in Takaichi’s policies, the rally is driven by optimism that the global AI investment boom still has room to grow, boosting demand for Japan’s tech-heavy stocks.
Meanwhile, concerns over high U.S. valuations & policy uncertainty are prompting investors to rotate capital from the West towards Japan.
Moreover, according to Bloomberg, only 43 of Nikkei 225 components advanced on 29/Oct, the fewest ever for a gain above 1.7%.
The rally was driven by strong gains in the Electronic Technology and Communications sectors, where AI-related optimism remains the dominant force. Advantest Corp, a chip-testing equipment supplier, surged a record 22% after hiking its annual profit outlook on booming semiconductor demand, while SoftBank Group continues to anchor market momentum.
The outsized contribution from a handful of tech and conglomerate names underscores the rally’s narrow breadth. If global AI enthusiasm cools or profit-taking sets in, Japan’s market could face a short-term correction, exposing the fragility behind its headline strength.
BoJ’s Softer Stance Fuels Yen Slide, Aids Nikkei's Outlook
The BoJ’s dovish turn in October sent the yen lower as traders dialed back expectations of near-term tightening. Under newly elected Prime Minister Takaichi, a supporter of loose monetary policy, the BoJ opted for patience, softening its earlier hawkish tone.
Governor Ueda signaled flexibility for a possible hike later this year but stressed the need to gauge wage and growth trends first. With the yen and Nikkei-225 moving inversely, this renewed dovishness could keep the yen weak and bolster the Nikkei-225.
Navigating Nikkei with CME Nikkei-225 Futures
This year, we have seen a sharp response to political signals, particularly when leadership changes hint at a more accommodative or growth-oriented policy stance.
The most recent example came in September 2025, when Prime Minister Shigeru Ishiba announced his resignation on 07/Sep. The move sparked optimism that his successor would adopt a more expansionary economic agenda.
Consequently, the Nikkei-225 surged past the key 44,000 mark for the first time on 09/Sep. Investors bullish on Japanese equities could gain from holding a long position in CME’s Micro Nikkei (JPY) futures to express this view.
A long CME Micro Nikkei (JPY) futures position opened at 42,505 on 26/Aug and closed a week later at 44,170 on 09/Sep would have generated a gain of (44,170 – 42,505) × 50 = ¥83,250 (~USD $565).
However, Japanese markets are quick to react to political uncertainty. After a record rally on 09/Oct, the Nikkei-225 tumbled the next day when the Komeito Party announced its exit from the ruling coalition with the LDP. The move raised doubts about Takaichi’s confirmation as prime minister and, by extension, the durability of the “Takaichi trade.”
A long CME Micro Nikkei (JPY) futures position opened at 48,660 on 09/Oct & closed at 46,990 on 14/Oct would have booked a loss of (46,990 - 48,660) × 50 = ¥83,500 (~USD 550).
Equity Index Futures enable investors to harvest gains from expected index moves. It also helps astute investors and risk managers to build protection against falling markets.
This content is sponsored.
MARKET DATA
CME Real-time Market Data helps identify trading set-ups and express market views better. If you have futures in your trading portfolio, you can check out on CME Group data plans available that suit your trading needs tradingview.com/cme .
DISCLAIMER
This case study is for educational purposes only and does not constitute investment recommendations or advice. Nor are they used to promote any specific products, or services.
Trading or investment ideas cited here are for illustration only, as an integral part of a case study to demonstrate the fundamental concepts in risk management or trading under the market scenarios being discussed. Please read the FULL DISCLAIMER the link to which is provided in our profile description.
MLong

Nikkei Futures Reach Historic Highs, Extending Bullish RallyThe short-term Elliott Wave analysis for Nikkei Futures (NKD) indicates a robust bullish trend, with the Index recently achieving a new all-time high. The rally to 49,030 marked the completion of wave ((3)), followed by a pullback to 45,344, which concluded wave ((4)). The internal structure of wave ((4)) developed as a zigzag Elliott Wave pattern. From the peak of wave ((3)), wave (A) declined to 47,410, followed by a wave (B) rally to 47,985. The Index then extended lower in wave (C), reaching 45,344, finalizing wave ((4)) in the larger degree.
The Index has since resumed its upward trajectory in wave ((5)). From the wave ((4)) low, wave 1 advanced to 48,030, with a subsequent wave 2 pullback concluding at 46,600. The Index then surged in wave 3 to 48,390, followed by a wave 4 dip to 47,720. The final leg, wave 5, reached 48,650, completing wave (1). A corrective wave (2) followed, ending at 47,145 in a zigzag structure. The Index has now resumed its ascent within wave (3). In the near term, as long as the pivot low at 45,344 holds, expect pullbacks to attract buyers in 3, 7, or 11 swings, supporting further upside in the Nikkei Futures.

Why does Nikkei falls this big (even bigger than HSI), plan B?The Nikkei 225 fell harder than almost everyone on Friday — even more than the HSI, S&P 500, Dow, Nasdaq, and yes, gold held up better. The reason? POTUS’ new tariff warning on China hit Japan’s export-heavy market right where it hurts.
When global trade looks shaky, Japan’s big names — autos, chips, and industrials — feel it first. A stronger yen didn’t help either, cutting into exporter profits.
The index broke below support near 47,800, and the next key zone sits around 45,200. It’s still in a long uptrend, but the pullback shows momentum cooling fast.
So, what’s plan B? Pretty simple — weaker yen, calmer headlines, and maybe a bit of good news from the U.S. Until then, the Nikkei might need to catch its breath.

Navigating Nikkei amid Euphoria and Fears Central banks can and do sway markets. The Nikkei-225, propelled by central bank actions in the US & Japan soared to all time high before pulling back sharply on Friday.
However, momentum snapped when BoJ unveiled its plan to offload risk assets off its balance sheet. This has cast doubt on the rally’s durability.
Nikkei Rockets Past 45,000 on Tech Surge and Fed Rate-Cut
Japan’s Nikkei-225 closed above the 45,000 mark on Thursday (18/Sep), powered by rally in tech stocks & wave of optimism after the US Fed’s 25-basis-point rate cut .
By last Friday (19/Sep), the index was scaling new record highs as investors looked ahead to the BoJ’s policy decision. Rates were anticipated to stay unchanged at around 0.5%. Market optimism was also lifted by data showing core inflation slowed to 2.7% in August, its lowest since November 2024 and the third straight month of easing.
Nikkei Edging Lower when BoJ Begins Gradual Unwinding of Stimulus
The BoJ held rates steady at around 0.5%, with seven of nine policymakers in favor. It also unveiled plans to shed riskier assets from its balance sheet.
The central bank will begin offloading its ETF holdings at about 330 billion yen a year, while gradually trimming its J-REIT holdings by around 5 billion yen annually, pacing the sales to avoid jolting markets. The Nikkei 225 gave up early gains and closed in the red on this news.
Foreign Investors Start Pulling Out of Japanese Equities
Foreign investors are retreating from Japanese equities, taking profits following record rally. Softer trade data has raised doubts about Japan’s export-driven recovery. At the same time, worries over global growth and potential recession are weighing on sentiment, prompting overseas investors to lock in gains.
Source: ( Japan Exchange Group )
Technical Indicators Hint at Potential Pullback
Prices hold above the short-term MA, but momentum is clearly fading. The MACD remains above the signal line, yet the shrinking green histogram signals weakening bullishness.
Meanwhile, the RSI retreating from 73.81 to 64.51 shows buying pressure is easing, suggesting the Nikkei-225 may be entering a consolidation or pullback phase.
Bollinger Bands suggest the same. The uptrend remains intact, and buyers are still pushing prices higher, but the rally appears overextended, making the market susceptible to a short-term pullback.
Prices traded between 0% and 38.2% Fibonacci retracement levels. In the near term, absent material news flow, Micro Nikkei-225 futures are expected to trade between JPY 44,424 (serving as support) & JPY 45,700 (serving as resistance).
Hypothetical Trade Setup
In the short term, the Nikkei-225 faces pressure from potential foreign selling as global growth concerns persist. Japan’s safe-haven appeal appears fragile, heightening the risk of a near-term pullback.
Set against this backdrop, managers can manage their portfolio risk using the CME yen-denominated Micro Nikkei Futures contract to protect from drawdowns and to hedge against weakening USD versus the Yen.
• Entry: 44,950
• Target: 43,250
• Stop Loss: 46,000
• Potential Gains: JPY 85,000 ((44,950-43,250) x 50 yen/contract)
• Potential Losses: JPY 52,500 ((44,950-46,000) x 50 yen/contract)
• Reward-to-Risk: 1.6x
MARKET DATA
CME Real-time Market Data helps identify trading set-ups and express market views better. If you have futures in your trading portfolio, you can check out on CME Group data plans available that suit your trading needs tradingview.com/cme .
DISCLAIMER
This case study is for educational purposes only and does not constitute investment recommendations or advice. Nor are they used to promote any specific products, or services.
Trading or investment ideas cited here are for illustration only, as an integral part of a case study to demonstrate the fundamental concepts in risk management or trading under the market scenarios being discussed. Please read the FULL DISCLAIMER the link to which is provided in our profile description.
MShort

Elliott Wave Update: Nikkei (NKD) Advances in Fifth WaveThe short-term Elliott Wave analysis for Nikkei Futures (NKD) indicates that the pullback to 41,708 on September 2, 2025, marked the completion of wave ((4)). The Index has since resumed its upward trajectory in wave ((5)), structured as a five-wave impulse. From the wave ((4)) low, wave ((i)) concluded at 42,260, followed by a dip in wave ((ii)) to 41,890. The subsequent wave ((iii)) advanced to 43,245, with a pullback in wave ((iv)) ending at 42,595. The final leg, wave ((v)), peaked at 44,190, completing wave 1 in a higher degree. A corrective wave 2 followed, bottoming out at 43,080.
The Index has now embarked on wave 3, exhibiting another impulsive five-wave structure in a lesser degree. From the wave 2 low, wave ((i)) reached 44,925, and a pullback in wave ((ii)) concluded at 44,440. The Index then surged in wave ((iii)) to 45,810. A corrective wave ((iv)) is anticipated to retrace the cycle from the September 18, 2025, low, unfolding in a 3, 7, or 11 swing pattern before resuming higher. As long as the pivot at 41,708 holds, any near-term pullback should find support in a 3, 7, or 11 swing, setting the stage for further upside.

double top++ in potential downtrend formation 1->3 : number 2 are solid major sellers
in this local scope , after number 3
closes below number 1
3->4 : return to solid major sellers
next ?
* hidden bear divergence
* obv downtrend maintained and trendline touch
at number 4
* entry has poc above
*1st standard deviation on major high
MShort

MNK1 Shakeout Complete at 42,650 =BUY the Smart Money Move**Market Structure Assessment:** 📈
• Points 1→3: Established higher high formation ✓
• Confirmation: Point 2 now validated as institutional support 🏛️
• Seller capitulation from Point 1 has been definitively absorbed 💪
**Price Action 3→4:** 📉
• Natural retracement to value area identified ✓
• Confluence of profit-taking and new short positions 🤝
• Orderly pullback to Point 2 support zone - textbook execution 📚
**The Spring Mechanism at Point 4:** 🎯
• Liquidity sweep below Point 2 - surgical precision ⚡
• Stop-loss cascade harvested by institutional algorithms 🖥️
• Immediate recovery = Wyckoff Spring confirmed ✅
**Probability Matrix:** 🎲
• Support integrity: MAINTAINED (wick only, no close below) ✔️
• Chaos Theory projection: 57% continuation probability 📊
• Risk/Reward ratio: ACCEPTABLE for final position 💰
**Technical Confluence:** 🔬
• Hidden bullish divergence triple confirmation (RSI/MFI/A-D) ✅
• High-volume absorption node at spring point 📊
• Wyckoff accumulation Phase C validated ⭐
**Risk Acknowledgment:** ⚠️
• Point of Control resistance overhead - monitored 👁️
• Position sizing: MAXIMUM ALLOWABLE 💯
• Stop-loss: ABSOLUTE at spring low 🛑
This is the trade. This is the moment. Fortune favors the prepared. 🎖️
**EXECUTING LONG POSITION. NO SECOND CHANCES.** 🚀
*Risk management is paramount. Trade responsibly.* 📋
MLong

NIKKEI FUTURES: Liquidity Hunt → Rally → Major Correction SetupSharing my current outlook on Nikkei futures with a simple but effective read. 📈
**🎯 My Expectation:**
I'm anticipating a classic liquidity grab below recent lows, followed by another leg higher. After this move, we might see a more significant corrective pullback. 📉
**📍 Target Zone:**
A move up to around 44,500 would provide an ideal setup. This level would create what looks like the second touch of a potential double top pattern - that's where I'm planning to take profits. 🎯
**🧠 Market Structure Logic:**
This type of move is textbook market behavior: sweep the weak hands out with a liquidity grab below support, then drive price higher to collect stops above resistance. Simple, but effective. 🔄
**⚠️ What I'm Watching:**
- Clean break below recent lows (liquidity hunt)
- Quick reversal and momentum shift upward
- Approach to the 44,500 area for potential double top formation
**📊 Risk Consideration:**
If we don't see the expected liquidity grab first, or if price breaks structure in an unexpected way, I'll reassess the setup. The beauty of having a plan is knowing when it's not working. 🛑
---
**Trading is simple.** You don't need multiple indicators or dozens of lines on your chart. A clean and simple chart often works best — it keeps your decisions consistent and reduces uncertainty. Sure, it might not look flashy, and my analysis may seem a bit "plain" compared to others… but that's how I like it. If you find this analysis useful, feel free to follow me for more updates.
---
*Disclaimer: This post is for general informational and educational purposes only. It does not constitute financial advice, investment recommendation, or a service targeting specific investors, and should not be considered illegal or restricted information in any jurisdiction.*
Long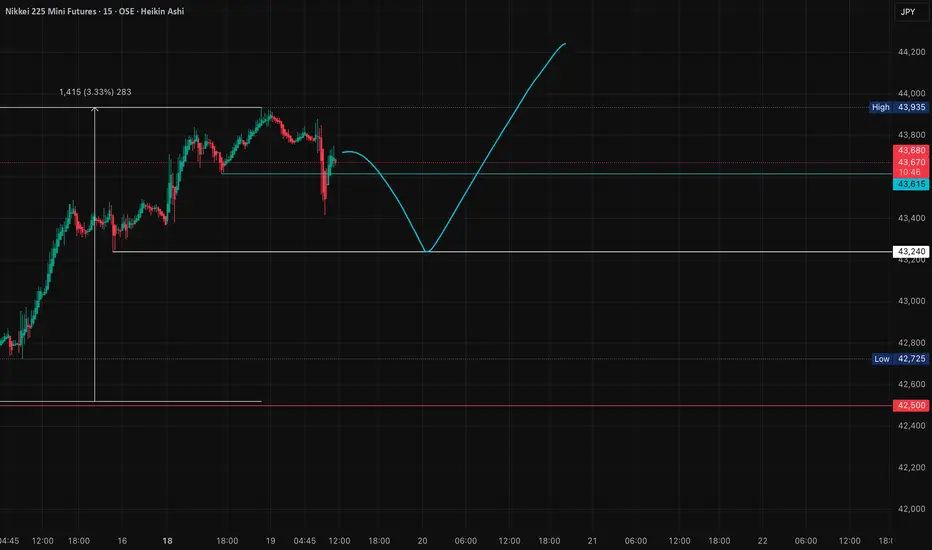
Export Strength Fuels Japan’s Growth,But Tariff Risks Loom AheadJapan’s economy defied expectations in Q2 2025. Exports roared back as a key driver, powered by a new U.S. trade deal and a weaker yen, sending the Nikkei higher. However, with tariffs and a cooling investment outlook on the horizon, the question is whether this upside has staying power.
Nikkei Rallies on Growth Surprise, Though BoJ Warns Boost May Fade
On 15/Aug, preliminary data showed that Japan’s economy expanded by 0.3% in Q2 2025, outpacing forecasts of 0.1% and building on the upwardly revised growth from the previous quarter.
Chart 1: Exports Drive Japan’s Q2 GDP Surprise, Economy Outpaces 0.1% Forecast
Source: Trading Economics (as of 18 Aug 2025)
The upside surprise was driven primarily by stronger exports, which contributed 0.3 percentage points to GDP after dragging growth by 0.8% in Q1.
Japan’s GDP growth beat expectations, offering a welcome surprise after a difficult second quarter marked by trade uncertainty. A breakthrough came on July 23, when Japan finalized a trade agreement with Washington that imposed a uniform 15% tariff on exports, including autos.
While the tariff reprieve on autos is significant, it is not the sole driver of recent momentum. The yen’s weakness has also supported Japanese exporters, as overseas earnings translate into higher profits when converted back into local currency.
Chart 2: Nikkei Soars While Yen Stumbles Against the Dollar since 2024
The key question is whether the Nikkei’s latest rally has the strength to continue, or if near-term headwinds could slow it down.
Exports to the US saw a temporary boost from front-loading ahead of higher U.S. tariffs, followed by a pullback.
Chart 3: Tariff Fears Spark Export Rush Followed by Retreat
Source: Ministry of Finance (as of 18 Aug 2025)
Industrial output is set to dip near term from factory shutdowns and mounting pressure from weaker overseas demand.
Chart 4: Factory Shutdowns and Sluggish Demand Cloud June Output Rise
Source: Trading Economics (as of 18 Aug 2025)
Household spending is set to remain strained, as higher food prices and weaker bonuses from lower corporate profits are likely to weigh on consumption through the second half of the fiscal year.
Chart 5: Rising Food Costs and Weak Bonuses Squeeze Household Spending
Source: Trading Economics (as of 18 Aug 2025)
The BoJ has cautioned that the drag from tariffs is likely to weigh on corporate earnings. That backdrop argues for a more measured outlook. Adding to this, Marcel Theliant of Capital Economics noted that while GDP growth recently surprised on the upside, he sees momentum cooling ahead as investment eases and exports edge lower.
Technical Indicators
Chart 6: MACD Strengthens, But RSI Flashes Overbought Warning
Prices remain firmly supported above short-term MA, with bullish momentum strengthening as shown by MACD. However, the relative strength index signals overbought conditions, suggesting that while the uptrend is intact, the market may be vulnerable to a near-term pullback.
Chart 7: Bollinger Bands Hint at Rally Pause Despite Buyer Momentum
Bollinger Bands suggest the same. While the uptrend is intact and buyers are clearly driving prices higher, the rally may be overextended, leaving the market vulnerable to a near-term pullback or sideways consolidation.
Hypothetical Trade Setup
Chart 8: Hypothetical short position in CME Micro Nikkei 225 (Yen) futures expiring in September
Japan’s safe-haven status looks fragile, raising the risk of a pullback in the Nikkei 225. These factors support taking a short position in CME Micro Nikkei 225 (JPY) futures.
In this scenario, the yen-denominated Micro Nikkei Futures contract may boost USD-denominated returns, given the anticipated strengthening of the yen.
The investor should manage downside risk by placing a stop-loss. Based on Chart 8, one option is to set it just above 45,085, a potential resistance level, which would represent a maximum hypothetical loss of JPY 71,000 ((43,665 – 45,085) × 50 yen/contract). Investors with a lower risk tolerance may choose a closer stop-loss.
Hypothetical Short Position:
Entry: 43,665
Target: 41,540
Stop Loss: 45,085
Potential Gains: JPY 106,250 ((43,665-41,540) x 50 yen/contract)
Potential Losses: JPY 71,000 ((43,665-45,085) x 50 yen/contract)
Reward-to-Risk: 1.5x
MARKET DATA
CME Real-time Market Data helps identify trading set-ups and express market views better. If you have futures in your trading portfolio, you can check out on CME Group data plans available that suit your trading needs tradingview.com/cme .
DISCLAIMER
This case study is for educational purposes only and does not constitute investment recommendations or advice. Nor are they used to promote any specific products, or services.
Trading or investment ideas cited here are for illustration only, as an integral part of a case study to demonstrate the fundamental concepts in risk management or trading under the market scenarios being discussed. Please read the FULL DISCLAIMER the link to which is provided in our profile description.
MShort
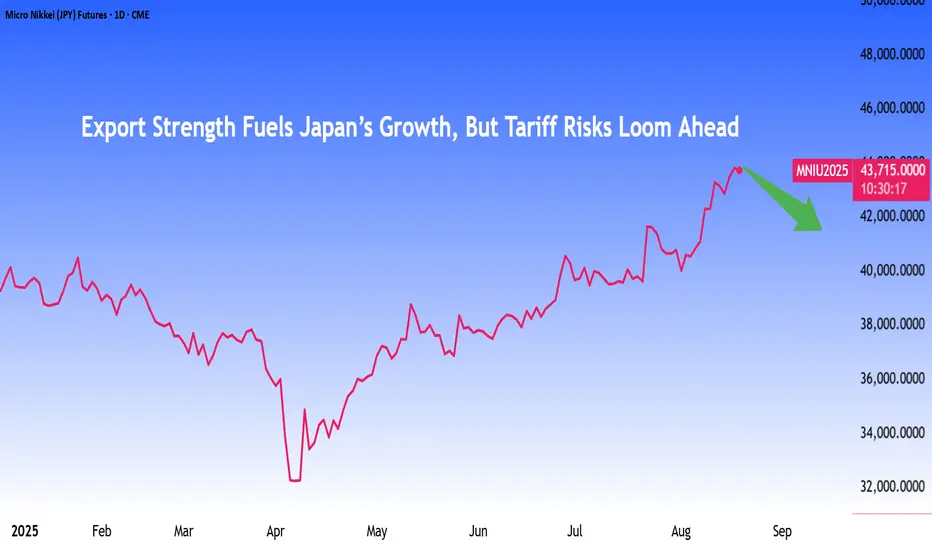
Nikkei Futures Try for ATHsWith US President Trump finalizing an agreement with Japan by imposing a 15% tariff on US businesses for Japanese products, Japanese stocks are flying due to the new found competitive advantage they have
Long Long
Long
Bond Market Uncertainty Weighs on NikkeiBy Pranay Yadav, Portfolio Analyst, Mint Finance
Rising bond yields and an unexpected economic slowdown in Japan pose new risks to the Nikkei 225, following its recovery from the tariff-driven decline.
Warning lights are flashing. Downside risk potential is present. Nikkei 225 is trading near its one-year average where it has previously shown a tendency to revert.
What could help an investor hedge the uncertainty in the Nikkei 225?
IMPACT OF RISING JGB YIELDS ON NIKKEI 225
Japan’s bond market witnessed renewed turmoil this spring, with a feeble 20-year auction pushing long-term yields to record highs. The 30-year JGB yield has hit an all-time high.
Chart 1: JGB yields soar, fueled by tightening expectations and inflation pressures.
Source: TradingView as of 23 May 2025
Rising yields pose potential risks for the Nikkei 225. Higher yields pressure the earnings-yield gap, eroding equity risk premium. In layman terms, when bond yields go up, investors will opt for the safety of higher bond returns instead of paying for equity risk premium.
Additionally, higher yields tighten financial conditions, raise borrowing costs and squeeze corporate profits, potentially weighing down on Nikkei 225.
Chart 2: 52-week correlation between JGB yields & Nikkei 225 has turned negative
Source: TradingView as of 30 May 2025
As bond prices tank to decade lows and the yield curve steepens significantly, markets are increasingly vulnerable to disruption from carry trade unwinding.
Chart 3: BoJ policy shift shocked the market last August, driving sharp adverse moves.
Source: TradingView as of 30 May 2025
Historically, volatility in the bond market has often spilled into equities. Past 30Y JGB spikes tended to be succeeded by sharp Nikkei 225 drops. Will history repeat itself?
Chart 4: Historically, JGB volatility spikes have triggered equity volatility.
Source: TradingView as of 30 May 2025
Monetary policy uncertainty & fragile global trade have pushed JGB into turmoil. The GDP contraction in Q1 is an additional factor which will potentially force a shift in BoJ’s policy path. Slowing growth weighs down on the equities through weaker domestic demand.
BoJ’s situation could get complicated due to slowing GDP and rising inflation which may push Japan towards stagflation.
Chart 5: Japan’s economy shrank in Q1 amid disruptive tariff impact.
NIKKEI TRADING AT LONG-TERM MEAN
The Nikkei 225 is trading at its long-term average and over the past year the index has shown strong mean reversion around this level, speaking volume about the need for understanding the market dynamics, economic conditions, and the specific characteristics of the Nikkei 225.
Chart 6: Mean reversion in Nikkei 225 over the past year
Source: TradingView as of 30 May 2025
While past trading levels suggest more upside for a short positioning, a sharp decline may occur if a major risk event unfolds.
Chart 7: Nikkei 225 technical indicators signal contrasting views.
Source: TradingView as of 29 May 2025
A bearish MA crossover is imminent which could suggest near term downside. Although, MACD signals that the recent bearish trend may be fading.
CONCLUSION AND CASE STUDIES
Risk signals are flashing with spiking JGB yields and slipping GDP. As Nikkei 225 trades near its long-term average, risks of mean reversion mount.
Chart 8: Hypothetical short position in CME Micro Nikkei-225 (Yen) futures expiring in September
Source: TradingView as of 6 June 2025
If an investor believes that these risks could materialize and that the Nikkei 225 could decline, they may consider shorting the CME Micro Nikkei 225 (Yen) futures. In this case, the yen-denominated Micro Nikkei Futures contract could further enhance the profit in USD due to the anticipated strengthening of the yen.
The investor should manage downside risk by placing a stop-loss. Based on Chart 8, one option is to set it just above the Jan high of 40,330, a potential resistance level, which would represent a maximum hypothetical loss of JPY 130,000 ((37,730 – 40,330) × 50 yen/contract). Investors with a lower risk tolerance may choose a closer stop-loss.
If the Nikkei 225 pulls back to around 32,250, a support level observed in mid-April, this hypothetical short position could yield JPY 274,000 ((37,730 – 32,250) × 50 yen/contract). However, market movements are unpredictable, and there is no guarantee that the index will reach this level before the futures contract expires.
Hypothetical Short Position:
Entry: 37,730
If Nikkei 225 Falls: 32,250
Stop Loss: 40,330
Potential Gains (JPY): JPY 274,000 ((37,730-32,250) x 50 yen/contract)
Potential Losses (JPY): JPY 130,000 ((37,730-40,330) x 50 yen/contract)
Conversely, investors who remain optimistic that risks highlighted above will not materialize in the near-term, may consider taking a long position in the Nikkei 225 as demonstrated in chart 9.
Chart 9: Hypothetical long position in CME Micro Nikkei-225 (Yen) futures expiring in September
Source: TradingView as of 06 June 2025
The investor could consider placing a stop-loss at the support level of 36,280, which was tested in March, based on Chart 9. This would represent a maximum hypothetical loss of JPY 72,500 ((36,280 – 37,730) × 50 yen/contract).
Assuming Nikkei 225 rises to 40,330, the previous high set in February, the hypothetical long position could yield JPY 130,000 ((40,330 – 37,730) × 50 yen/contract).
Hypothetical Long Position:
Entry: 37,730
If Nikkei 225 Rises: 40,330
Stop Loss: 36,280
Potential Gains (JPY): JPY 130,000 ((40,330-37,730) x 50 yen/contract)
Potential Losses (JPY): JPY 72,500 ((36,280-37,730) x 50 yen/contract)
Directional views on the Nikkei 225 come with inevitable uncertainty. Investors can opt for spread positions to reduce it.
A spread comprising a long position in the Nikkei 225 and a short position in the S&P 500 allows investors to maintain a bullish view on the Nikkei 225 while stay hedged against a potential drawdown through the short S&P 500 position.
We covered the hypothetical spread trade in detail in a previous paper . In brief, this spread trade helps the traders seize opportunities in the relative outperformance of Japan equities due to capital flows to Japan while remain insulated in case of a drawdown.
Foreign funds have been net buyers of Japanese stocks for seven weeks in a row as of May 2025.
Chart 10: Net weekly foreign investment in Japan stocks continues to ramp up
Chart 11: Hypothetical spread between CME Nikkei-225 (USD) and CME E-mini S&P 500 expiring in September
Source: TradingView as of 6 June 2025
Investors can deploy CME Micro E-mini S&P 500 futures alongside CME Micro Nikkei 225 (USD) futures to express this view. Alternatively, the standard E-mini S&P 500 and Nikkei 225 (USD) contracts can also be deployed.
A position consisting of 3 x MNKU2025 ($56,595 = 3 x 0.50 x 37,730) in notional) and 2 x MESU2025 ($60,250 = 2 x 5 x 6,025) in notional) roughly balances notional on both legs, allowing for a purely relative outperformance-based trade.
In this hypothetical trade-setup, the Micro Nikkei 225 (USD) contract is used to maintain P&L on both legs in the same currency, simplifying spread execution.
Looking at Chart 11, the Nikkei 225/S&P 500 ratio previously reached a high of 6.800 last July before retracing. If an investor exits at that level, the potential gain could range from $4,760 to $4,860, as outlined below.
To manage risk, the investor could set a stop-loss at the bottom of the spread range which hit a low of 5.890 in early 2022. This would imply a potential loss between $3,364.5 and $3,810.
www.phillipnova.com.sg
For now, Sayonara!
Micro Nikkei 225 (USD) and Micro E-mini S&P 500 spread tracks the performance of the standard contract spread.
MShort

Japanese Yield Surged to Record High 3.2% - Nikkei OutlookAre Japanese markets still a buy after rising 170% since the pandemic, surpassing their roaring 1980s levels?
The reason why Japanese stocks have become some of the best-performing equities in Asia is largely due to the falling yen — a depreciation of around 60%. A weaker yen boosts Japan’s major exporters (like Toyota, Sony, and Panasonic), as their overseas earnings convert into higher yen profits.
But what’s the downside? - Inflation
Yes, they wanted inflation, below 2% yoy will be ideal, but not at this rate of growth at 3.5%.
Another key reason for the stock rally starting in 2020 was that, just like the U.S., the Bank of Japan (BOJ) unleashed massive monetary stimulus, flooding markets with liquidity during the pandemic.
Although the yen has fallen sharply, it seems to have stalled since 2024, that was when the BOJ started raising interest rates from –0.1% to the current +0.5%.
With inflation continuing to rise, the BOJ will likely maintain a hawkish stance on interest rates.
This could cause the yen to strengthen or push USD/JPY lower.
I am also observing a potential head and shoulders formation on the USD/JPY. And if the yen strengthens, this may cause the Japanese stocks to meet its road block.
Nikkei 225 performance since the post WWII to its roaring 80s, to its collapsed, and now rebounded.
Even though prices have breached the 80s level in 2023, it could represent a false breakout, as prices continue to fall back below that historic resistance the last 2 years.
My assessment: The Japanese stocks are still testing their 80s high — a major psychological level.
With money printing, the yen weakened; and a weaker currency fueled inflation.
With inflation, yields and interest rates rise, borrowing costs are increasing across the different tenures — and that’s not good news for stocks.
The 30-year yield is now at around 3% — a level surpassing the deflationary years and that’s something most Japanese would not have imagined just a few years ago.
With a raising interest rate and a stronger yen, let’s see how this will impact the Nikkei 225.
Since the BOJ began raising interest rates at the beginning of 2024, the market has literally stalled within a wide 10,000-point range.
And there is a key support level at 30,000, we can see it was a resistance in the past.
Currently, the BOJ is trying their best in managing the yen and inflation very carefully, to maintain financial system stability. Based on this sentiment, I believe the market will likely continue moving within this wide range — though it may gradually narrow over time.
Make sure to keep monitoring the direction of the Japanese yen, yields, and inflation.
If the yen strengthens too quickly, or if yields and inflation rise too sharply, it could push the market to break below this range and start trending downward.
And if it is all well, market will likely to continue its upward momentum.
Another key factor I am watching closely is tariffs.
The direction of the Japanese stock markets will also be influence by the tariff agreements ultimately with US, and as well as how quickly they can forge potential trading partnerships and alliances — just like other nations, they are racing against time.
Micro Nikkei Futures
Ticker: MNI
Minimum fluctuation:
5.00 index points = ¥250
Disclaimer:
• What presented here is not a recommendation, please consult your licensed broker.
• Our mission is to create lateral thinking skills for every investor and trader, knowing when to take a calculated risk with market uncertainty and a bolder risk when opportunity arises.
CME Real-time Market Data help identify trading set-ups in real-time and express my market views. If you have futures in your trading portfolio, you can check out on CME Group data plans available that suit your trading needs www.tradingview.com
Trading the Micro: www.cmegroup.com
www.cmegroup.com
