EUR/USD: Weekly Institutional Schematic | Bearish FrameworkEUR/USD Weekly Institutional Market Schematic
August 4, 2026
Overview
Every market tells a story before it offers an opportunity.
Rather than beginning with entries on the lower timeframes, I start by identifying the higher-timeframe narrative and then work downward until the execution framework becomes objective.
This top-down process helps separate market structure from emotion and provides a consistent framework for evaluating price as the week develops.
The chart below represents my current institutional roadmap for EUR/USD based on the information available at the time of publication.
Weekly Market Structure
The weekly chart continues to support a bearish structural framework.
Following the Break of Structure (BOS) that developed during the week of June 15, 2026, the market transitioned into an extended period of consolidation rather than immediately expanding lower. From a market-structure perspective, this type of behavior often reflects a phase where liquidity is accumulated before the next directional move.
During the week of July 26, price rallied aggressively into a premium pricing area defined by the Daily Gap. Rather than signaling a change in trend, that advance completed a move into higher-timeframe resistance before sellers regained control.
Since then, price has respected both the Daily Premium and the 4-Hour Rejection Gap, suggesting that institutions continue defending this region.
As long as price remains beneath this premium area, my working hypothesis continues to favor the bearish side of the market.
Weekly Objective
The first area I will monitor is the Daily Equilibrium, which currently represents the midpoint of the broader weekly range.
If sellers maintain control and price establishes acceptance below current structure, that equilibrium level becomes the highest-probability downside objective.
Should bearish momentum continue beyond equilibrium, the next area of interest becomes the Daily Discount Zone, where I'll evaluate whether buyers begin returning to the market.
These are not predictions.
They are objective reference areas where I expect order flow and participation may increase.
Daily Framework
The daily chart recently advanced into approximately 1.15780, completing a move into premium pricing before producing a meaningful rejection.
That rejection occurred inside an area that had already been identified on the higher timeframe as a potential supply region.
At present, the market remains beneath both the Daily Gap and the 4-Hour Rejection Gap, preserving the current bearish framework.
Should price establish sustained acceptance back above those premium levels, this analysis would no longer remain valid and the higher-timeframe narrative would need to be reassessed.
Four-Hour Structure
The four-hour chart has spent several sessions balancing within a relatively narrow range before rotating lower.
Consolidation is frequently interpreted as indecision.
However, from a market-structure perspective, it often represents a temporary balance between buyers and sellers before expansion resumes.
Rather than attempting to predict when that expansion will occur, my focus is on identifying which side of the range ultimately gains acceptance.
At present, the evidence continues to favor the bearish side of the market while price remains below premium pricing.
One-Hour Execution Framework
The one-hour chart provides the transition from higher-timeframe analysis to execution.
The primary level I will continue monitoring is the structural support near 1.15180.
A decisive move below that area, accompanied by continued bearish market structure, would strengthen the probability of continuation toward lower liquidity.
Until that confirmation occurs, patience remains part of the process.
The objective is not to anticipate movement.
The objective is to allow structure to confirm the narrative established by the higher timeframes.
Areas of Interest
Primary Objective
1.14845
This represents the next significant area of interest within the current bearish framework and aligns closely with the Daily Equilibrium shown on the chart.
Should price establish acceptance beneath that level, I will then begin evaluating whether continuation toward the Daily Discount Zone becomes the next logical objective.
Educational Perspective
Each timeframe has a different responsibility within my trading process.
Weekly: Establishes the institutional directional framework.
Daily: Identifies premium and discount pricing.
4-Hour: Reveals structural balance, accumulation, and distribution.
1-Hour: Confirms the execution roadmap.
Lower Timeframes: Refine execution only after the higher-timeframe narrative has already been established.
Separating analysis in this way helps reduce emotional decision-making and encourages consistency by keeping execution aligned with the broader market structure rather than reacting to individual candles.
Current Working Thesis
This publication reflects my current interpretation of EUR/USD market structure based on price action available at the time of writing.
Markets evolve.
If higher-timeframe structure changes, this analysis will change with it.
Successful trading is less about predicting every move and more about recognizing when probabilities begin to shift, then allowing price to either confirm—or invalidate—that thesis.
Adaptability is more valuable than certainty.
Direction. Location. Timing.
Discussion
Do you agree with the current bearish higher-timeframe framework, or do you see evidence that would invalidate this thesis?
I'm always interested in seeing how other traders interpret market structure and liquidity.
This publication is intended for educational discussion of market structure and price action. It reflects one analytical framework and should not be interpreted as financial or investment advice.
In-depth trading ideas
Euro FX Futures: Expiry Gravity Into US Core PCEThe post-Fed recovery in 6E is intact but unconfirmed, and today's reaction risk is concentrated in a narrow afternoon window. U.S. GDP and core PCE land at 1:30pm London, while a large spot option expiry sits directly on the market into the 3pm London cut. That sequence argues for trading the retracement rather than the first move.
Where the edge is
Option gravity can suppress and partly reclaim an initial data reaction. With a sizeable spot expiry still live at the current market into the New York cut, a knee-jerk move on core PCE can be pulled back toward the strike before the cut clears, which makes the first candle after the release a poor entry reference. The tradable structure is the pullback that follows, not the spike itself.
Evidence
Market talk points to a reported EUR2.4bn spot expiry at 1.1450/60 remaining in play into today's New York cut (10am ET/3pm London), with U.S. GDP and core PCE due at 1:30pm London. Research notes that the Fed's three hike dissents keep a September move alive if elevated energy costs feed core inflation. Spot has also held close to its June close through the oil rally since early July, showing resilience against a normally adverse terms-of-trade impulse.
Trade idea
Do not chase the initial core PCE reaction in 6E. The plan is a conditional long on a pullback into the 1.1408/1.1414 spot area, invalidated on a spot close below 1.1374, with 1.1489 and 1.1509 as objectives. The principal risk is a firm core PCE print that sustains dollar demand and carries spot through the invalidation without offering the pullback.
--------------------
When charting futures, the data provided could be delayed. Traders working with the ticker symbols discussed in this idea may prefer to use CME Group real-time data plan on TradingView: tradingview.com/cme/ .
This consideration is particularly important for shorter-term traders, whereas it may be less critical for those focused on longer-term trading strategies.
General Disclaimer:
The trade ideas presented herein are solely for illustrative purposes forming a part of a case study intended to demonstrate key principles in risk management within the context of the specific market scenarios discussed. These ideas are not to be interpreted as investment recommendations or financial advice. They do not endorse or promote any specific trading strategies, financial products, or services. The information provided is based on data believed to be reliable. However, its accuracy or completeness cannot be guaranteed. Trading in financial markets involves risks, including the potential loss of principal. Each individual should conduct their own research and consult with professional financial advisors before making any investment decisions. The author or publisher of this content bears no responsibility for any actions taken based on the information provided or for any resultant financial or other losses.
𝗘𝘂𝗿𝗼 𝗙𝘂𝘁𝘂𝗿𝗲𝘀 𝗪𝗲𝗲𝗸𝗹𝘆 𝗢𝘂𝘁𝗹𝗼𝗼𝗸𝗘𝘂𝗿𝗼 𝗙𝘂𝘁𝘂𝗿𝗲𝘀 𝗪𝗲𝗲𝗸𝗹𝘆 𝗢𝘂𝘁𝗹𝗼𝗼𝗸 | 𝗔𝘂𝗴𝘂𝘀𝘁 𝟭𝟬–𝟭𝟰, 𝟮𝟬𝟮𝟲
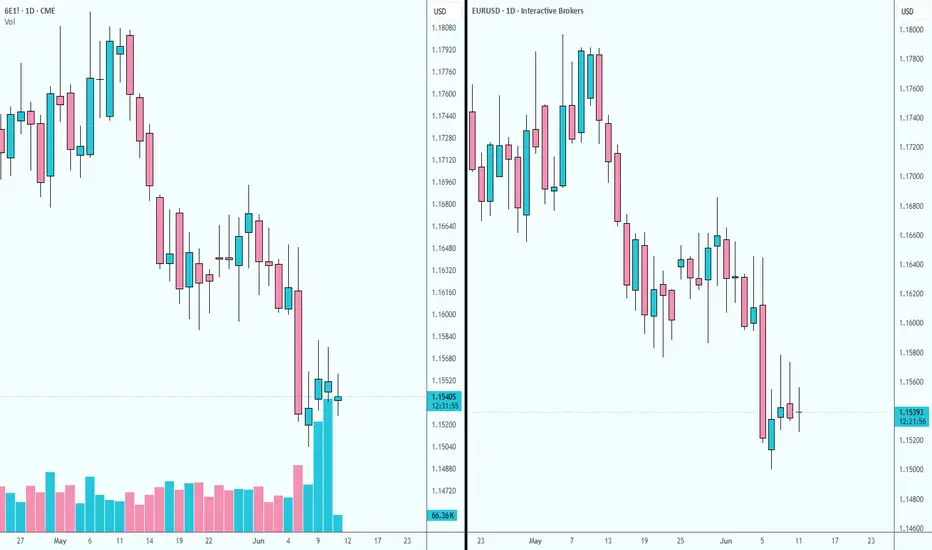
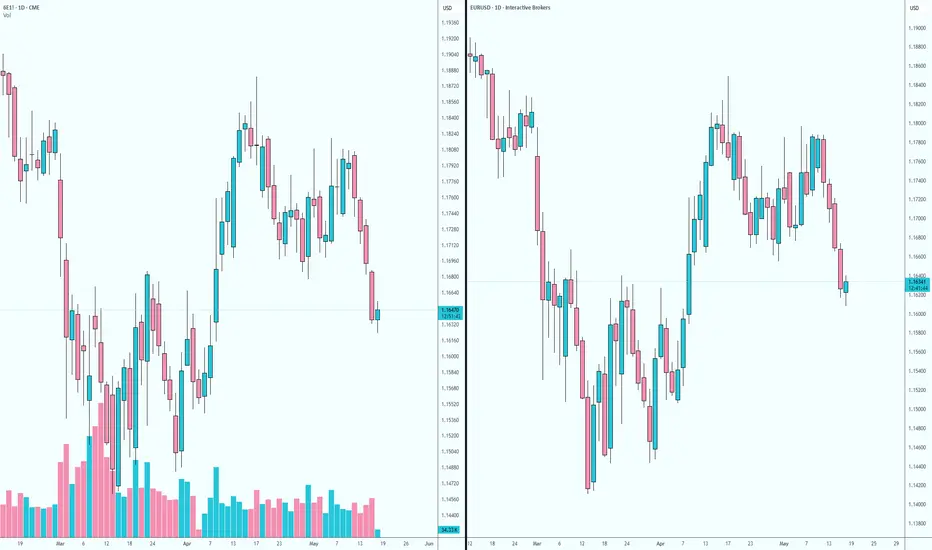
The **Euro Futures (6E1!)** can be viewed as a useful counterpart to the DXY. While they are not exact mirror images, they often show a strong inverse relationship.
The situation is therefore similar to the DXY — **but with one important difference.**
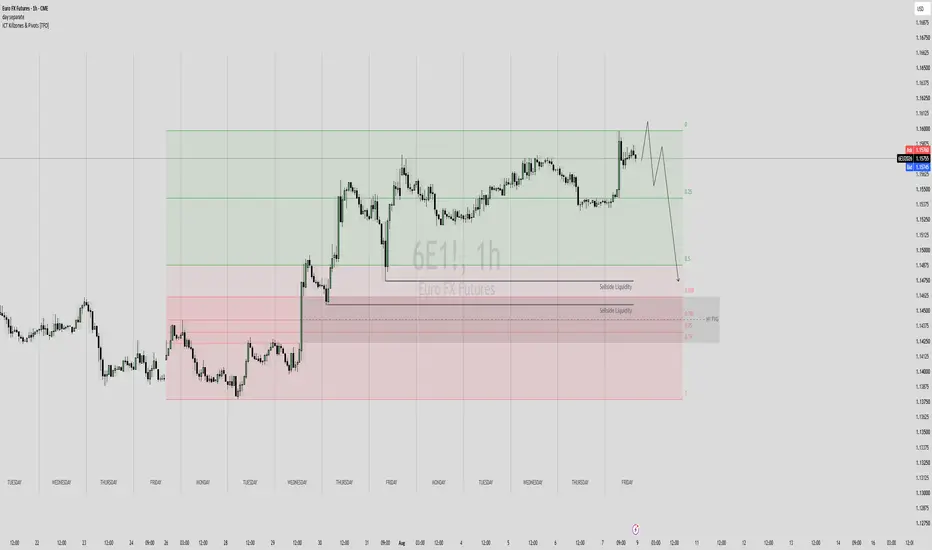
Looking at the last two weeks, the Euro Futures are currently trading in a **Premium area** of the recent range.
The NFP release pushed the USD lower on Friday, which logically supported the Euro and pushed **6E higher**.
But after this move, I am now looking at the liquidity below.
Below the **equilibrium of the current bullish trend**, we have **Sellside liquidity**.
The **OTE / sweet spot** also provides an area of interest where liquidity and an H1 FVG could potentially align.
This creates an interesting setup:
**Premium → liquidity above/below → potential retracement → confirmation**
My bias for next week is therefore:
𝗘𝘂𝗿𝗼 𝗙𝘂𝘁𝘂𝗿𝗲𝘀: **𝗕𝗲𝗮𝗿𝗶𝘀𝗵**
And consequently, my directional bias for **EUR/USD is also bearish**.
As always, the bias is only a framework.
I will wait for the market to take liquidity and then look for **market structure shift, displacement and a retracement entry**.
**𝗡𝗼 𝗿𝗮𝗶𝗱, 𝗻𝗼 𝘁𝗿𝗮𝗱𝗲.**
Euro Remains Bearish — But the Bigger Picture Is Changing
Near-term, the euro remains bearish as long as descending trendline resistance continues to hold. However, the longer-term technical picture is becoming increasingly interesting. Price has been compressing within a multi-month falling wedge, a pattern that has historically often resolved with an upside breakout. While no breakout has been confirmed, the coming weeks could prove pivotal as price approaches the apex of the pattern.
Euro FX Futures: Option Gravity Can Suppress the Morning Range6E may remain subdued into today's 10am New York cut. Market talk points to a sizeable spot expiry at 1.1400, with around €3.6bn discussed at the strike. Its proximity to EUR/USD increases the likelihood that option-related hedging keeps euro price action anchored and movement limited until 3pm London.
Where the edge is
The edge is timing rather than direction. Pre-cut extensions may struggle to develop while the strike remains influential, so paying for an early breakout offers limited value. The more meaningful volatility window should begin after the expiry influence clears.
Evidence
Realised volatility is compressed, while tomorrow's ECB decision leaves directional views divided rather than strong enough to overwhelm the potential pin during the European session.
Trade idea
Expect a restrained 6E range into 3pm London and avoid chasing brief pre-cut moves. Monitor relative euro performance against the broader Dollar move. If the Dollar moves sharply across G10 while EUR/USD remains anchored near the strike, the suppressed adjustment may catch up during the hours following the cut. Reassess direction from that relative-strength signal once the option gravity clears, and judge the move by post-cut acceptance rather than the first intraday probe. Keep exposure modest ahead of tomorrow's ECB decision.
--------------------
When charting futures, the data provided could be delayed. Traders working with the ticker symbols discussed in this idea may prefer to use CME Group real-time data plan on TradingView: tradingview.com/cme/ .
This consideration is particularly important for shorter-term traders, whereas it may be less critical for those focused on longer-term trading strategies.
General Disclaimer:
The trade ideas presented herein are solely for illustrative purposes forming a part of a case study intended to demonstrate key principles in risk management within the context of the specific market scenarios discussed. These ideas are not to be interpreted as investment recommendations or financial advice. They do not endorse or promote any specific trading strategies, financial products, or services. The information provided is based on data believed to be reliable. However, its accuracy or completeness cannot be guaranteed. Trading in financial markets involves risks, including the potential loss of principal. Each individual should conduct their own research and consult with professional financial advisors before making any investment decisions. The author or publisher of this content bears no responsibility for any actions taken based on the information provided or for any resultant financial or other losses.
Options Blueprint [int]: When Price Is Trapped, Think VolatilityMarkets do not always reward directional conviction. Sometimes, the highest-probability observation is simply that price appears compressed and a meaningful move could emerge in either direction. Rather than attempting to predict whether buyers or sellers will ultimately prevail, traders can instead prepare for volatility itself.
This case study explores how a Long Strangle options strategy may be combined with a classical chart pattern, implied volatility analysis, and predefined technical objectives. The goal is not to anticipate direction, but to create a structured framework that can potentially benefit from a significant price expansion while maintaining a defined maximum risk.
The examples discussed below are purely educational and intended to illustrate the concepts involved.
The Technical Picture: A Market Waiting for a Decision
The chart currently shows price trading inside a Rising Wedge, a chart pattern frequently associated with weakening bullish momentum. However, one important point is often overlooked: a bearish pattern does not become bearish until it actually breaks down.
At the time of writing, the breakout has not occurred.
Instead, price is positioned approximately in the middle of the wedge, leaving two plausible paths:
A downside breakout, consistent with the traditional interpretation of the pattern.
An upside breakout, which would invalidate the bearish expectation and potentially trigger buying pressure.
This uncertainty becomes even more interesting when viewed alongside nearby technical levels.
The nearest potential resistance area is located around 1.16160, while an important potential support area sits near 1.12885.
In other words:
Price is roughly centered inside the Rising Wedge.
Price is also positioned between two important technical reference levels.
Rather than providing directional clarity, this environment highlights uncertainty—precisely the type of condition that options strategies designed to capture movement often seek.
When Volatility Becomes More Important Than Direction
Many traders focus exclusively on where price may go.
Options traders often ask a different question:
How much could price move?
This distinction is important.
A Long Strangle does not require accurately forecasting whether the market moves higher or lower. Instead, it generally seeks a sufficiently large move in either direction before time decay materially erodes the option premiums.
This makes volatility—not direction—the primary consideration.
Looking Beyond the Chart: Implied Volatility
Chart patterns describe price.
Options introduce another important dimension: implied volatility.
Comparing the implied volatility curves of the September 4 expiration with those of the October 9 expiration reveals an interesting observation.
The October 9 expiration currently displays:
Lower implied volatility.
A flatter volatility skew across strikes.
Lower implied volatility generally corresponds to comparatively lower option premiums, all else being equal. While no option can be described as "cheap" in absolute terms, purchasing options when implied volatility is relatively lower may improve the overall characteristics of certain long-premium strategies.
For this case study, that observation makes the October 9 expiration particularly interesting.
Building the Long Strangle
This educational example considers the following position:
Long 1 × October 9 1.1500 Call
Long 1 × October 9 1.1400 Put
This creates a classic Long Strangle.
The strategy establishes exposure on both sides of the market while limiting maximum risk to the total premium paid.
Unlike directional option strategies, the objective is not to predict which direction the market chooses. Instead, the objective is to participate if price expands sufficiently in either direction.
The Critical Ingredient: Planning the Exit Before Expiration
Perhaps the most important concept in this article is not the Long Strangle itself.
It is the planned exit.
Many educational examples discuss option strategies assuming positions remain open until expiration.
That is not the intention here.
Instead, the October 9 expiration is selected primarily because implied volatility appears relatively lower than the nearer expiration.
The trade management plan assumes that if a breakout develops, the position would potentially be closed at predefined technical objectives rather than held until expiration.
Illustratively:
A bullish breakout could be evaluated near the potential UFO resistance around 1.16160.
A bearish breakout could be evaluated near the potential UFO support around 1.12885.
Exiting before expiration may materially alter the strategy's characteristics because option value is influenced by multiple factors beyond intrinsic value, including remaining time value and implied volatility.
This illustrates an important principle:
Sometimes the expiration is selected because of pricing, not because the trader intends to hold the position until expiration.
Why This Matters
Waiting until expiration would require price to travel sufficiently far beyond the strategy's breakeven levels.
By contrast, if the objective is to participate in an earlier expansion and close the position while options still retain meaningful time value, the required move may differ substantially.
This illustrates why trade management can be just as important as strategy selection.
Futures Contract Specifications
For readers interested in the underlying futures contracts, the following specifications apply.
Euro FX Futures (6E)
Contract size: 125,000 euros
Minimum price fluctuation (tick): 0.000050 per Euro increment = $6.25
Approximate margin requirement: ~$2,100
Micro EUR/USD Futures (M6E)
Contract size: 12,500 euros
Minimum price fluctuation (tick): 0.0001 per euro = $1.25
Approximate margin requirement: ~$210
Margin requirements are established by the exchange and may change without notice. Individual brokers may require higher margin levels than the exchange minimums.
Risk Management
Although a Long Strangle limits maximum loss to the premium paid, risk remains an essential consideration.
Among the primary risks are:
Time decay as expiration approaches.
Changes in implied volatility after the position is established.
Insufficient price movement.
Transaction costs and liquidity considerations.
Position sizing should always reflect the possibility that the entire premium paid could be lost.
Equally important, predefined exit criteria may help reduce emotional decision-making during periods of increased volatility.
Illustrative Forward-Looking Case Study
This educational example assumes a position is established while price remains inside the Rising Wedge.
Illustrative bullish scenario
Illustrative objective: Potential UFO resistance near 1.16160.
Illustrative exit: Evaluate closing the position as price approaches the resistance area.
Illustrative bearish scenario
Illustrative objective: Potential UFO support near 1.12885.
Illustrative exit: Evaluate closing the position as price approaches the support area.
A logical invalidation condition for either scenario would be the absence of sustained directional expansion following the breakout, as prolonged consolidation could increase the impact of time decay on the option premiums.
Because option prices evolve dynamically with changes in the underlying price, implied volatility, and remaining time to expiration, the eventual reward-to-risk outcome cannot be predetermined and should therefore be evaluated continuously throughout the life of the position.
Final Thoughts
One of the most valuable lessons in options trading is recognizing that uncertainty itself can create opportunity.
When price is compressed inside a chart pattern, positioned between meaningful technical reference levels, and accompanied by comparatively lower implied volatility, the focus naturally shifts away from predicting direction and toward preparing for expansion.
Whether the market ultimately breaks higher or lower is secondary to the broader principle.
Sometimes, the smartest question is not:
"Where is price going?"
Instead, it is:
"What happens if price finally decides to move?"
Data Consideration
When charting futures, the data provided could be delayed. Traders working with the ticker symbols discussed in this idea may prefer to use CME Group real-time data plan on TradingView: www.tradingview.com - This consideration is particularly important for shorter-term traders, whereas it may be less critical for those focused on longer-term trading strategies.
General Disclaimer
The trade ideas presented herein are solely for illustrative purposes forming a part of a case study intended to demonstrate key principles in risk management within the context of the specific market scenarios discussed. These ideas are not to be interpreted as investment recommendations or financial advice. They do not endorse or promote any specific trading strategies, financial products, or services. The information provided is based on data believed to be reliable; however, its accuracy or completeness cannot be guaranteed. Trading in financial markets involves risks, including the potential loss of principal. Each individual should conduct their own research and consult with professional financial advisors before making any investment decisions. The author or publisher of this content bears no responsibility for any actions taken based on the information provided or for any resultant financial or other losses.
Can Euro Futures Unlock Global Success?The world faces unprecedented volatility today. Investors and leaders must adapt quickly. Euro futures offer a powerful financial tool. They help professionals navigate shifting global markets. Let us explore their immense impact across diverse sectors.
Geopolitics and Geostrategy
Recent conflicts constantly redefine international relations. The Middle East crisis directly disrupts global energy markets. Hostilities in the Strait of Hormuz spike European inflation. Nations scramble to secure reliable energy supplies. Consequently, Euro futures reflect this intense geopolitical tension. Traders use them to price strategic risks. Geopolitics dictate currency strength more than ever before. European energy dependency drives these massive currency fluctuations.
Macroeconomics and Economics
Central banks drive major global currency movements. The European Central Bank recently hiked rates. They relentlessly fight inflation fueled by energy shocks. Meanwhile, the Federal Reserve faces slowing job growth. Chairman Kevin Warsh maintains a hawkish stance. Yet, weak employment data stalls further tightening. These diverging policies create immense Euro volatility. Investors leverage Euro futures to hedge these macroeconomic risks. Economic stability relies on precise currency forecasting.
Industry Trends and Business Models
Global supply chains face continuous market disruption. Businesses must rethink their foundational operating models. Extreme currency fluctuations destroy profit margins overnight. Savvy companies integrate Euro futures into their strategies. This integration protects revenue from sudden exchange rate shifts. Modern business models demand robust financial hedging. Flexibility now defines successful global industry trends. Firms that ignore currency risks will ultimately fail.
Management and Leadership
Effective leadership requires decisive and immediate risk management. Executives face immense pressure to protect corporate assets. They cannot leave currency exposure to chance. Top managers actively trade Euro futures. They lock in favorable rates to secure corporate budgets. This proactive stance defines modern financial leadership. Weak leaders ignore these vital financial instruments. Strong leaders use them to ensure long-term stability.
Company Culture and Innovation
A volatile Euro demands a resilient corporate culture. Teams must pivot quickly when market dynamics change. Agile companies foster relentless financial innovation. They train employees to understand global market forces. This awareness drives smarter operational decisions. A culture of vigilance protects the bottom line. Financial literacy sparks broader innovative thinking. Teams design better products when budgets remain secure.
Technology and Cybersecurity
Trading Euro futures relies on advanced technology. Algorithms execute massive trades in mere milliseconds. This high-speed environment attracts sophisticated cybercriminals. State-sponsored hackers target critical financial infrastructure. They exploit geopolitical chaos to steal valuable data. Financial institutions must deploy cutting-edge cybersecurity defenses. Strong encryption protects vital trading algorithms. Technology secures the very foundation of modern currency markets.
Pharmaceuticals and Science
The pharmaceutical industry operates on a massive global scale. European drug manufacturers heavily export to America. Currency fluctuations drastically impact their total revenues. Euro futures allow these giants to hedge profits. Stable revenues fund vital scientific research. Unpredictable exchange rates threaten long-term clinical trials. Hedging ensures life-saving science continues without interruption. Financial foresight directly supports global health initiatives.
High-Tech and Patent Analysis
High-tech firms constantly battle for global market share. R&D investments depend on stable currency values. A weak Euro makes European patents cheaper abroad. Companies strategically file patents based on these shifting costs. Euro futures help tech firms predict future expenses. They protect budgets allocated for intellectual property. Smart patent analysis requires accurate currency forecasting. Financial tools therefore drive technological dominance.
Conclusion
Euro futures represent more than mere financial instruments. They act as vital barometers for global stability. From geopolitics to life-saving pharmaceuticals, their impact expands everywhere. Astute professionals must understand these powerful tools. Mastery of currency markets ensures future global success.
Weekly Review (Jul 20–24): EUR & GoldWeekly review for July 20–24. Not signals, just how I read the tape with the Conflux Method: structure (Reaction Levels), order flow and options data.
Context: when the CPI came out I simply sat it out, because Bloomberg floated the idea that there would be a 0.4% drop in inflation for June, and that was too much, even if you assume there was no time lag from the effect of oil. In the end that's what we got, with the decline. The painted data gave the market no positive, the market didn't believe the CPI report or the nonfarm, and all the growth evaporated after the spurt. Without oil, judging by the report, inflation in the US is zero, and that's a fairy tale.
On the drivers, the only one that interests me next week is Friday. Everything else isn't interesting, even the ECB won't be touching the rate there. Let's see whether there'll be a TACO from Trump with Iran, and maybe we catch a trend on that, or else we stay put and stand until July 29.
CME:6EU2026 (EUR, main chart above)
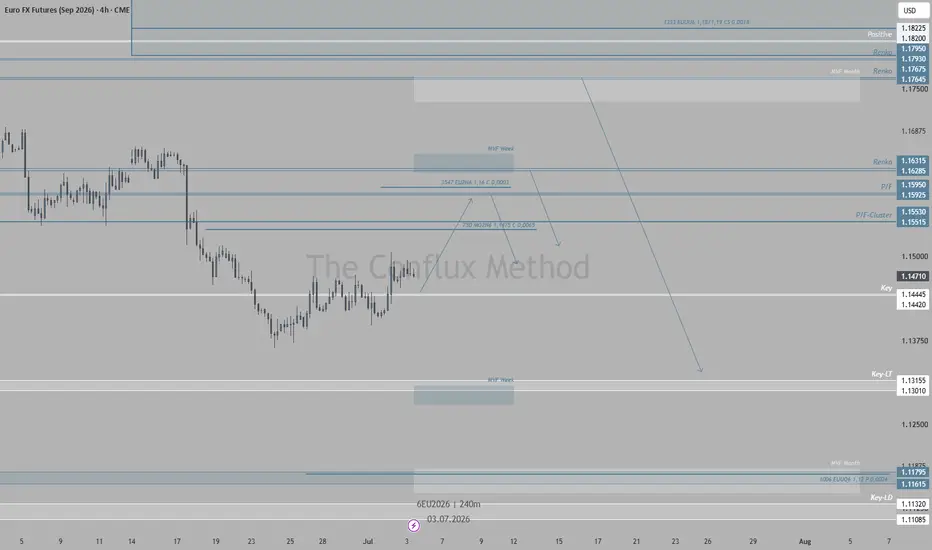
An absolutely identical straddle went in here, with the same breakeven as last week, and again on the boundary of the balance. Looking at these off-exchange trades, maybe they'll finally start pushing it up. And it's not only off-exchange, there's also an entry of 7560 puts at the central strike in synthetics, and we haven't seen that kind of volume in a long time, in July at that, and on the lower boundary of the balance. The feeling is they're just trading volatility and a shot, and where it goes they don't care, and they've thrown hedges everywhere so they can flip to either side easily. If they go up, there's the synthetic breakeven, the middle of the two openings here, and on an exit above it they earn until August 7, with a strangle a bit higher. If they go down, they'll close all the futures, and with a break of the lower boundary of the balance those same 7560 puts start earning all over again. In short, they're waiting for a move and will adapt to it, and then they'll let us join. Given how long we've been standing in this accumulation, the exit out of it is a move of 300 to 400 points without long stops. So I don't want to buy it back yet until 1.1553 is worked and possibly the break that follows, and I'll short only after a break of the 7560 puts to the downside.
COMEX:GCZ2026 (Gold)
A unique situation here: all the delta-hedge zones of the market maker and the funds (the Wednesday, the week and the contract) landed on Reaction Level zones, and that in itself is a call to action off these zones. If the buy-back off the visible ones continues, then through a pullback I'll be looking at an entry into a buy toward max pain before expiration, off these two zones. At the open, if they immediately push it down to 4047, I'll still try to buy it back, the stop is tiny for that kind of potential. So far the buy-back is fairly dumb, and the risk definitely shouldn't be raised above 1%.
Crypto BINANCE:BTCUSDT BINANCE:ETHUSDT BINANCE:SOLUSDT
I've started glancing at crypto, but for now it's only glancing, the coma there hasn't ended yet.
These are zones and scenarios I'm watching, not a call to trade. Let price come to your levels and let the reads converge first.
Educational only, not investment advice. Trading carries a high risk of capital loss. Past results don't guarantee future performance.
#ConfluxMethod #trading #futures #options #forex #gold #crypto #orderflow
Euro Recovery Tests Breakout ResistanceEuro futures are attempting to extend Monday’s recovery despite renewed geopolitical Dollar demand. Momentum is improving, but 6E still needs to establish acceptance above its current short-term resistance before the move becomes directional.
Market backdrop
Sell-side views remain divided. Danske sees downside risk from a relatively firmer Fed, while MUFG expects softer US yields and improving European rate spreads to support a measured euro recovery.
Implied volatility remains compressed and EUR puts retain a premium over calls. Leveraged-money euro shorts are elevated, but the broader futures-positioning picture does not show a sufficiently clear imbalance to make a squeeze the primary trade thesis.
Downside option barriers at 1.1325 and 1.1300 remain live on EUR/USD spot, although they are too distant to drive the immediate 6E setup.
Trade idea
6E is trading in a compressed-volatility setup, increasing the risk that a confirmed breakout develops into a faster directional move.
The tactical bias is conditionally bullish. A break followed by sustained acceptance above the contract’s short-term resistance would favour joining the upside move rather than waiting for a deeper pullback, as volatility expansion could accelerate the recovery.
A quick failure back inside the range would signal another false start and cancel the immediate long thesis.
--------------------
When charting futures, the data provided could be delayed. Traders working with the ticker symbols discussed in this idea may prefer to use CME Group real-time data plan on TradingView: tradingview.com/cme/ .
This consideration is particularly important for shorter-term traders, whereas it may be less critical for those focused on longer-term trading strategies.
General Disclaimer:
The trade ideas presented herein are solely for illustrative purposes forming a part of a case study intended to demonstrate key principles in risk management within the context of the specific market scenarios discussed. These ideas are not to be interpreted as investment recommendations or financial advice. They do not endorse or promote any specific trading strategies, financial products, or services. The information provided is based on data believed to be reliable; however, its accuracy or completeness cannot be guaranteed. Trading in financial markets involves risks, including the potential loss of principal. Each individual should conduct their own research and consult with professional financial advisors before making any investment decisions. The author or publisher of this content bears no responsibility for any actions taken based on the information provided or for any resultant financial or other losses.
Weekly Review (Jul 6-10): EUR, GBP, JPY & GoldWeekly review for July 6-10. Not signals, just how I read the tape with the Conflux Method: structure (Reaction Levels), order flow (cluster / delta) and options data (margin zones, balance, breakevens).
Context: last week we got another weak NFP with a downward revision, which sent risk assets flying against the dollar. Now it's clear why the euro was being pinned with puts and not allowed to slip lower. To me that reads as: someone is positioned for a move up, and when you sit on puts you're waiting for the futures to rise. On the FedWatch Tool, the hike odds that were priced in got trimmed hard after the NFP, down to around 45% from 75%. If CPI "comes down" too on the 14th, the debate shifts to whether they hold or cut in September.
CME:6EU2026 (main chart above)
1.1442 is the strongest support from the buyers. Monday-Tuesday the reaction there on the push down will be the thing to watch. Above it are the buy targets and the entry points into the sells. The most interesting work starts at 1.1586. At 1.1632 there's a long-standing Debt and a good zone to work. At the 1.16 strike they meet it with calls, so getting above it will be hard. The boundaries are marked out through August; through Friday I'll be working the 1.1628 zone. In July they could push higher, but before Jul 14–15 I don't expect any pops, more of a sluggish drift, so the week is a bit quieter than the last one. The NFP is already painted; what's left is a "soft" CPI print on the 14th and Warsh telling Congress the rate might be cut by year-end. On that, price could head toward 1.1765–1.1793 by September, and then Jackson Hole flips the script, with a hike back on the table for September as one option.
OANDA:GBPUSD
Weekly and monthly MVF: for Monday there's good support at 1.3250. If they press through it, 1.2915 comes into play by August, and from there you can work with more confidence. Sells not before 1.3582; taking that zone with the Cluster is only realistic on a "softer" US CPI. The Cluster confirms.
FX_IDC:JPYUSD CME:6JU2026
They might start painting some noise here, but I still lean higher, they won't let the Bank of Japan catch a breath that easily. The US Treasury hasn't joined the interventions yet and everyone's waiting on it. The lower MVF is the 166.50–167 band on spot, where the market maker and the funds get involved and where the BoJ and US Treasury would step in, but the odds of reaching it this week are still very low. If they drag it higher on the futures, I'll work with 0.006395, and I'll take the nearest ones by the market too. Catching the intervention is easier than fading a reversal against it.
COMEX:GCQ2026
For Monday morning I'm watching these zones, especially 4080, since some interesting speculative interest opened there. Into Friday's short-day close a Debt was left at 4126. Sells by the market I'll watch off 4265.5; on the MVF I'll work off 4468, and for now it's toward that first. The weak jobs data gave an impulse and blocked a clean push down to 3800 for a re-buy; Thursday there was a window to buy in. What I'll be working: 4080 for sure, plus an alert on those puts that were opened, taking them by the market; 4266 for sells for sure; 4127 is questionable and only on a reduced lot, I don't like the zone itself even with the levels and the Debt there.
These are zones and scenarios I'm watching, not a call to trade. Let price come to your levels and let the reads converge first.
Educational only, not investment advice. Trading carries a high risk of capital loss. Past results don't guarantee future performance.
#ConfluxMethod #trading #futures #options #forex #EURUSD #GBPUSD #USDJPY #gold #orderflow
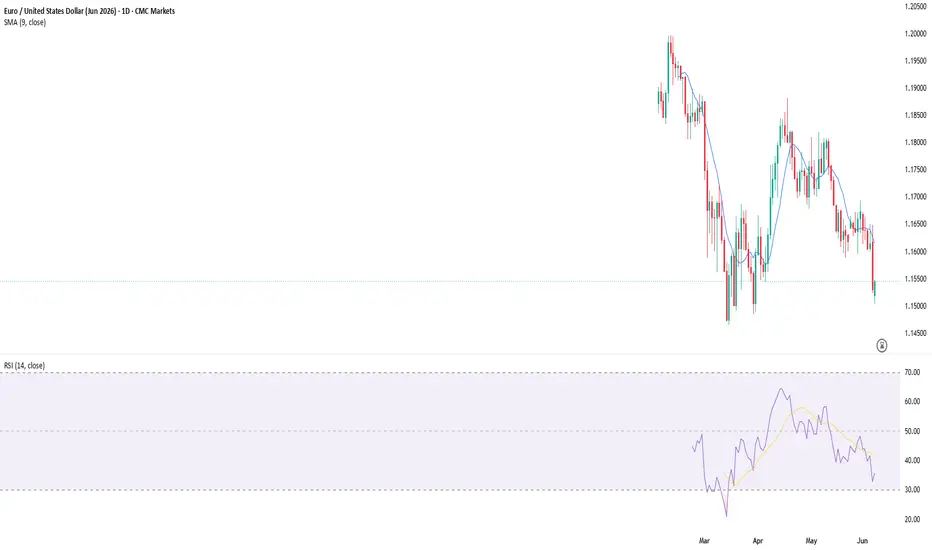
EUR/USD faces a critical test before US jobs reportThe EUR/USD finds itself in a precarious position one day ahead of the key June US jobs report on Thursday, 2 July. Currently, EUR/USD is trading around 1.14, which is a key level of support. Additionally, we have seen a key level of resistance emerge at the 10-day exponential moving average.
Meanwhile, support for the euro appears fairly limited at this point. In fact, the euro is trading below the 50- and 200-day moving averages, suggesting they are now more likely to act as resistance than support.
If the euro breaks below the 1.1400 level following what could be a strong US jobs report, it is likely to weaken towards 1.1280. Over time, that could even lead to a further decline towards the 1.1090 area.
It is worth noting that the euro may be forming a bullish divergence, with the RSI making a higher low as recently as 24 June, while the exchange rate has made a lower low since mid-March. That could be the first sign that the euro is forming a bottom. However, it does not necessarily mean that the euro’s decline is over.
At this point, broad-based dollar strength appears to be developing across markets, which could become a significant headwind for the euro going forward.
Written by Michael J. Kramer, founder of Mott Capital Management.
Disclaimer: CMC Markets is an execution-only service provider. The material (whether or not it states any opinions) is for general information purposes only and does not take into account your personal circumstances or objectives. Nothing in this material is (or should be considered to be) financial, investment or other advice on which reliance should be placed.
No opinion given in the material constitutes a recommendation by CMC Markets or the author that any particular investment, security, transaction, or investment strategy is suitable for any specific person. The material has not been prepared in accordance with legal requirements designed to promote the independence of investment research. Although we are not specifically prevented from dealing before providing this material, we do not seek to take advantage of the material prior to its dissemination.
EUR/USD: Post-PCE Bear Trap Watch25 June 2026, 10:07 AM London, UK
By late London morning, FX is moving toward the US PCE and GDP block with the Dollar rally mature rather than cleanly fresh. The core tactical question is whether 13:30 London data extends the Dollar impulse or delivers the stop-run failure that late buyers are vulnerable to. EUR/USD and AUD/USD are hovering above recently defended downside areas, while GBP/USD has reclaimed part of its break below 1.3160 without removing the broader sterling risk premium. USD/CAD is the clearest overbought Dollar expression, and USD/JPY remains the most asymmetric battlefield as 161.93/162.00 combines cycle highs, option-knockout defence, stop interest and intervention-sensitive headlines. EUR/GBP is the non-Dollar exception, still heavy near 0.8600/20, while NZD/USD remains a crowded local downside watch.
--------------------
EUR/USD — Spot: 1.1365
Technical Analysis
- The pair remains in a downtrend, but Wednesday's hammer candle and sub-30 RSI soften the immediate bearish read.
- The latest chart note flags 1.1385, the 24 June daily high, as nearby resistance, while 1.1336 Fibonacci support has survived on a closing basis. Deeper support is watched at the 1.1310 monthly average and 1.1291 weekly average.
- Momentum still favours sellers, yet failure to close below 1.1336 keeps consolidation or a tactical rebound in play.
Sell-side Research
- Societe Generale says the fall began when consensus EUR/USD forecasts were bullish and CFTC futures positioning was long, but expects the decline to slow without fresh data.
- Credit Agricole argues EUR/USD can stay offered even if risk sentiment improves, because the Fed rate repricing keeps the Dollar more attractive than the euro.
Market Chatter
- Market colour says post-Fed Dollar gains stalled around 1.1325, with EUR/USD unable to close below the 1.1336 retracement.
- EUR put-over-call premium has peaked from Wednesday's highs, while implied volatility has eased as spot losses stalled.
- Core US PCE at 13:30 London is the key event gate, with Final GDP released at the same time but likely secondary unless the surprise is large.
Strategy
The conditional opportunity is a post-PCE bear trap rather than fresh Dollar chasing. A downside flush that fails below 1.1336 and reclaims it would make EUR/USD rebound risk cleaner, while acceptance below 1.1310 cancels the squeeze setup.
--------------------
GBP/USD — Spot: 1.3190
Technical Analysis
- Sterling printed a new 2026 low at 1.3140, with RSI near 30 confirming both downside strength and developing oversold conditions.
- Recent technical commentary keeps 1.3209, the 24 June high, and 1.3242 pivot resistance in focus above spot. The 1.3140 2026 low and the 1.3125 November 2025 low are the first supports.
- The chart bias remains lower, but rebounds into resistance are more attractive than selling the floor after the first break.
Sell-side Research
- Morgan Stanley prefers short GBP/USD over short EUR/USD as the cleaner hedge for a further Dollar run, citing scope for additional GBP-negative risk premium.
- HSBC expects GBP/USD to drift lower over the next month as Fed hawkishness, fading sterling support and fiscal concerns build.
Market Chatter
- Cable holds below the former 1.32 support area after Wednesday's drop to the lowest level since November 2025.
- UK political risk remains active, with Chancellor succession talk splitting between continuity and fiscal-risk interpretations.
- US PCE is the immediate Dollar catalyst. A soft print would challenge the already visible bearish cable story.
Strategy
The market still prices sterling weakness, but the cleaner short is not a fresh sell near 1.3190. Prefer fading a post-data rebound that fails back below 1.3209, while strength through 1.3279 means the breakdown has lost tactical control.
--------------------
USD/JPY — Spot: 161.81
Technical Analysis
- USD/JPY remains just below the 161.93/161.96 highs, with Fibonacci projection work only activating if the 162 area clears.
- The latest technical note flags 161.93/96 as the cycle-high resistance band before the 162 handle. On dips, 161.54 has already been tested, while 161.27 and the 161.12 10-day average remain the next support references.
- Above 162, 162.88 and 163 become projection and psychological markers, but intervention risk makes acceptance more important than the first spike.
Sell-side Research
- MUFG says BoJ hike expectations have not yet triggered a stronger yen, even as pressure on Japan to support the currency has increased.
- JP Morgan expects the next BoJ hike in October, citing hawkish meeting opinions and rising concern about upside inflation risks.
- Credit Agricole says Japan still has substantial reserve capacity for intervention, while political constraints may affect how investors judge the risk.
Market Chatter
- Spot continues to hover below the 2024 peak and 162.00 option-knockout area, with offers and defensive sales reported ahead of the handle.
- Traders report large stops above 162.00, while a lack of official action could encourage another yen-selling attempt.
- JPY crosses trade heavy, suggesting intervention risk and yen-short reduction are already influencing broader yen exposure.
Strategy
The underpriced path is a stop-run fade, not buying the 162 break. If acceleration through 161.93 fires stops into the handle, the tactical short is cleaner than passive breakout chasing, while acceptance above 162.00 kills the fade.
--------------------
AUD/USD — Spot: 0.6903
Technical Analysis
- AUD/USD remains bear-biased after an 11-week low, although RSI below 30 warns that the decline may be overreaching.
- The chart discussion centres on 0.6924, the 24 June high, as nearby resistance. The 0.6882 lower Bollinger boundary and 0.6857 200-day average are the watched supports.
- Downside pressure still points toward the 200-day average, but the first flush into 0.6882/0.6857 is no longer a clean late-entry zone.
Sell-side Research
- Bank of America says AUD/USD is undervalued, with fair value around 0.71, and keeps a structural buyer-on-dips stance despite headwinds.
- Societe Generale says AUD may flush remaining long positions after the break below 0.70, but would look for improvement signs to buy AUD against the euro later.
Market Chatter
- AUD failed to respond positively to a stronger Australian jobs print, showing how dominant Dollar strength and commodity weakness remain.
- CFTC data showed the net AUD position flipped short for the first time since January in the week to 16 June.
- Stop-liquidity is clustered below 0.6880 and above 0.6923, making the next data reaction vulnerable to a false break.
Strategy
The underpriced path is a bear-trap rebound if PCE triggers a flush through 0.6882 that quickly returns above it. Below 0.6857, the trap has failed and the 200-day support story becomes the next reassessment point.
--------------------
USD/CAD — Spot: 1.4229
Technical Analysis
- USD/CAD keeps its strong May-June uptrend, but an RSI near 88 marks the most overbought reading since March 2020.
- The latest technical note flags 1.4248, the 2026 high, with the 1.4276 upper Bollinger boundary and 1.4292 Fibonacci level above. Support is watched around 1.4203 short-term structure and the 1.4167 weekly technical zone.
- The trend deserves respect, yet any turn from this overbought area could be significant.
Sell-side Research
- Credit Agricole says the Dollar remains the biggest long in its G10 positioning model and has continued to attract buying interest.
- MUFG argues it may be easier for the Fed to hike sooner rather than later, supporting the broader Dollar rates story.
Market Chatter
- Soft commodities and lower oil have added pressure on CAD, while Fed-BoC divergence keeps the pair bid.
- Retail traders remain heavily short USD/CAD, so an early fade before a stop-run is risky.
- The 13:30 PCE release is the session gate. A Dollar spike that fails above the highs would fit the exhaustion template.
Strategy
The underpriced path is a USD/CAD exhaustion reversal only after a stop-run above 1.4248 fails. Retail shorts make pre-fading dangerous, but a return below the high after PCE would shift the cleaner tactical expression lower toward 1.4203.
--------------------
EUR/GBP — Spot: 0.8617
Technical Analysis
- EUR/GBP remains under pressure after lower highs and the largest one-day drop since December 2025 confirmed a bearish structure.
- Recent analysis keeps 0.8633/0.8653 in focus as resistance from the prior daily high and the current 50-day average. The 0.8598 August 2025 low and 0.8556 weekly average are the key supports.
- Momentum is negative, but the 0.8600/20 floor needs acceptance below before downside can be pressed responsibly.
Sell-side Research
- Societe Generale expects the 0.86-0.87 range to hold in the very near term, leaving GBP/USD largely driven by EUR/USD.
Market Chatter
- Weak rebounds keep pressure on the familiar 0.8600/20 support zone, with spot still heavy below recent highs.
- GBP has found support from expectations of a smoother UK political transition, although Chancellor succession risk remains live.
- Stop-liquidity near 0.8600 and 0.8625 makes the cross vulnerable to a false break before direction clarifies.
Strategy
The better tactic is conditional downside, not selling the floor blindly. Follow EUR/GBP lower only if 0.8598 breaks, holds, and fails to reclaim, while a move back through 0.8625 signals the breakdown has become a trap.
--------------------
NZD/USD — Spot: 0.5647
Technical Analysis
- NZD/USD is close to a seventh consecutive decline after failing at the 55-day average on 15 June.
- Chart commentary points to 0.5580 as the next support, while resistance remains distant at 0.5990/95 and 0.6012.
- The current session is still narrow, so fresh downside needs post-data acceptance rather than late selling into a stretched run.
Sell-side Research
- Credit Agricole says NZD remains the largest short in its G10 positioning model, with mild selling interest last week driven mainly by IMM flows.
Market Chatter
- Retail exposure is still heavily long NZD/USD, leaving local downside stop-risk if 0.5623 gives way.
- Stop-liquidity is visible below 0.5623 and above 0.5688, making the PCE reaction the likely trigger for the next range break.
- RBNZ pricing remains supportive on paper, but spot weakness shows the market is not rewarding that narrative today.
Strategy
No clean spot edge before PCE. NZD/USD is already stretched lower and retail longs can add downside fuel, but the reward to 0.5580 is poor unless post-data acceptance below 0.5623 creates a fresh setup.
--------------------
Market Summary
EUR/USD — 1.1365 — Trap watch
- Market consensus: Dollar trend remains favoured, but EUR support and peaked put premium slow downside conviction.
- Recommendation: Fade only a failed post-PCE flush back above 1.1336. Below 1.1310 cancels it.
GBP/USD — 1.3190 — Sell rallies
- Market consensus: Sell-side views favour weaker sterling, with politics and Fed-BoE divergence still weighing.
- Recommendation: Prefer failed rebounds below 1.3209, not fresh shorts into the post-break floor.
USD/JPY — 161.81 — Trap watch
- Market consensus: Upside pressure persists, but 162.00 barriers, stops and intervention risk dominate the session.
- Recommendation: Fade stop-run acceleration into 161.93/162.00. Stand aside if the handle accepts above.
AUD/USD — 0.6903 — Rebound risk
- Market consensus: Commodities and Dollar strength weigh, although AUD is oversold and positioning has turned short.
- Recommendation: Respect a bear-trap rebound if 0.6882 flushes and reclaims. Below 0.6857 cancels it.
USD/CAD — 1.4229 — Trap watch
- Market consensus: Trend and macro still support USD/CAD, but overbought momentum is extreme.
- Recommendation: Do not pre-fade. Short only after a failed stop-run above 1.4248.
EUR/GBP — 0.8617 — Short below 0.8598
- Market consensus: The cross remains heavy, but sell-side range views warn against selling the floor blindly.
- Recommendation: Follow downside only after 0.8598 holds below. Above 0.8625 signals trap risk.
NZD/USD — 0.5647 — No clean spot bias
- Market consensus: NZD remains under pressure, with retail longs exposed and institutional models still short.
- Recommendation: Avoid pre-PCE chasing. Reassess only if 0.5623 accepts below after the release.
--------------------
Futures / Spot FX Context
Although the market review above is based primarily on spot FX analysis, listed FX futures may provide a relevant and transparent way for traders to express or hedge views on the same underlying currency themes. Futures prices may differ from spot prices due to factors such as interest rate differentials, contract expiry, liquidity, and basis, so traders should always refer to the appropriate futures contract and real-time market data before making any decision.
CME Group FX futures offer a centrally cleared, regulated marketplace where counterparty credit risk is mitigated through CME Clearing. They also provide transparent order-book pricing and execution rules, including a first-on-price, first-to-fill framework, which can support fairer access to liquidity across market participants. These features may make futures suitable vehicles for traders who want exposure to major FX themes within a standardized, exchange-traded framework.
When charting futures, the data provided could be delayed. Traders working with the ticker symbols discussed in this idea may prefer to use CME Group real-time data plan on TradingView: tradingview.com/cme/ .
This consideration is particularly important for shorter-term traders, whereas it may be less critical for those focused on longer-term trading strategies.
General Disclaimer:
The trade ideas presented herein are solely for illustrative purposes forming a part of a case study intended to demonstrate key principles in risk management within the context of the specific market scenarios discussed. These ideas are not to be interpreted as investment recommendations or financial advice. They do not endorse or promote any specific trading strategies, financial products, or services. The information provided is based on data believed to be reliable; however, its accuracy or completeness cannot be guaranteed. Trading in financial markets involves risks, including the potential loss of principal. Each individual should conduct their own research and consult with professional financial advisors before making any investment decisions. The author or publisher of this content bears no responsibility for any actions taken based on the information provided or for any resultant financial or other losses.
Euro Futures Continue LowerAs the Dollar has been climbing slowly over the last few weeks, the Euro has seen the opposite price action and has continued to trade lower today. Right now, the market is trading near a critical level that was the initial breakdown point from November of 2021, and acted as a “ceiling” in the market until about June of 2025 where it was finally able to break through. Now, that same level is being tested again on the downside and the RSI on a daily chart is nearing “oversold” levels. If the Dollar continues to rise in value this could send prices in the Euro lower, and traders will be looking at the economic data this week to see if there could be another catalyst that sends prices lower.
Outside of the Euro, the price action came in mixed across asset classes starting off the week. The S&P and Nasdaq saw marginal selling pressure while the Russell and Dow were able to trade higher, with the Russell trading to a new high price. Gold, Silver and Crude Oil continued to see selling pressure today as the general trend of lower prices continued with these markets. In terms of economic data, there is not much being released this week until Thursday, where we will see Core PCE and GDP, which could add volatility across the board with many markets trading near critical levels.
If you have futures in your trading portfolio, you can check out on CME Group data plans available that suit your trading needs tradingview.com/cme/
*CME Group futures are not suitable for all investors and involve the risk of loss. Copyright © 2023 CME Group Inc.
**All examples in this report are hypothetical interpretations of situations and are used for explanation purposes only. The views in this report reflect solely those of the author and not necessarily those of CME Group or its affiliated institutions. This report and the information herein should not be considered investment advice or the results of actual market experience.
EUR/USD: Massive 1.1500 Expiry Meets Post-Fed Dollar Strength18 June 2026, 11:13 AM London, UK
By late London morning, FX is trading around a clear post-Fed Dollar regime, but the next few hours are not a simple chase. EUR/USD has dropped into a huge live option battlefield around 1.1450 to 1.1500 before today's New York cut, which can slow or distort downside follow-through. GBP/USD has already fallen hard, yet the BoE decision is still ahead and can turn stretched sterling shorts into a two-way event trade. USD/JPY is pressing the 161.00 intervention-sensitive zone with option caps nearby, while USD/CAD confirms broad Dollar strength but looks technically overheated. AUD/USD and NZD/USD remain vulnerable as risk relief fails to offset hawkish Fed repricing. EUR/GBP is the cleanest sterling event gauge because low volatility leaves the cross exposed to a BoE range break.
--------------------
EUR/USD — Spot: 1.1462
Technical Analysis
- Losses have put the long-term range base back in sight, with the fall stretched but still backed by firm daily downside studies.
- Resistance sits at the 1.1546 10-day average and 1.1564 200-hour average. Support is 1.1448 pivot S1, then the 1.1409 2026 low.
- A recovery above 1.1546 would force a rethink, but while that area caps, the March low remains the bear reference.
Sell-side Research
- Credit Agricole remains bearish, although it lifted its Q3 target to 1.14 from 1.12 as lower energy prices reduce the most extreme downside risks.
- ING expects renewed Dollar demand through summer and sees EUR/USD vulnerable toward 1.13/14 in July as the Fed delays easing deeper into 2027.
Market Chatter
- Today's New York cut has reported EUR/USD expiries above EUR14bn at 1.1500/10, plus around EUR2.74bn at 1.1450 and smaller nearby strikes.
- The Fed removed its easing-bias language and projected a 2026 hike, driving a broad Dollar and US Treasury yield rally.
- The US-German 2-year spread has widened again, reinforcing the Dollar yield advantage and leaving EUR/USD longs vulnerable.
Strategy
Broad USD pressure is now the regime, but the huge 1.1500/10 expiry can slow a clean chase before the New York cut. The underpriced path is pin first, then downside release if spot stays below 1.1479 after the cut.
--------------------
GBP/USD — Spot: 1.3226
Technical Analysis
- Sterling has shifted sharply lower, with the move extending toward the year's low after Wednesday's heavy post-Fed close.
- Resistance is now the 1.3325 session high and 1.3361 10-day average. Support sits at the 1.3188 100-week average, then the 1.3160 2026 low.
- The speed of the decline is dragging daily studies toward oversold territory, which matters with BoE risk still ahead.
Sell-side Research
- Bank of America expects the BoE to vote 7-2 for a hold today, with two hike votes and a risk that the split moves to 6-3.
Market Chatter
- Cable dropped to a 10-week low after the hawkish Fed hold, with 1.3325 from 11 June now cited as resistance.
- The BoE decision is still ahead today, and the market is leaning toward an unchanged 3.75% policy rate.
- UK labour data were mixed, with a lower jobless rate but firmer wage growth, leaving the policy read less one-sided.
Strategy
Sterling downside has already paid into a 10-week low, with BoE risk still ahead today. The underpriced path is short-covering only if the decision lifts spot back above 1.3224/25, otherwise accepted weakness keeps 1.3188 in play.
--------------------
USD/JPY — Spot: 160.88
Technical Analysis
- The pair keeps grinding higher in a steady trend, with pent-up Dollar demand tempered by caution near the 161.00 area.
- Resistance is 160.93 pivot R1 and the 161.00 20-day upper Bollinger, then 161.55 weekly extension. Support is 160.38 10-day and 159.90 21-day averages.
- Momentum remains constructive, but the upper volatility boundary is close enough to make fresh topside chasing more fragile.
Sell-side Research
- SocGen frames 160.70/161.20 as the make-or-break zone and says a short-term pullback is likely unless that hurdle is cleared.
- MUFG argues the yen's failure to strengthen after the BoJ hike keeps pressure on Japan to intervene again, especially as leveraged funds increased short-yen exposure.
Market Chatter
- Market talk points to stops above 161.00, with large knockouts around 162.00 and 165.00 keeping official-pressure risk in focus.
- Reported expiries around 160.00/50 are Dollar supportive, while the 161.00/10 area is expected to help cap spot into today's cut.
- Importer demand at Tokyo fixes and equity-hedging yen sales continue, but official comments are limiting the upside chase.
Strategy
The USD trend is valid, but 161.00 is a policy-sensitive battlefield rather than clean breakout value. The underpriced path is a stop test that fails under option caps or official-pressure risk, while a held retest above 161.20 would void the fade.
--------------------
AUD/USD — Spot: 0.7006
Technical Analysis
- Back-to-back bearish closes have improved the short setup, although the early rebound briefly damped the bear bias.
- Resistance was rejected around the 0.7038 10-day average, with 0.7056/69 the next technical band. Support is 0.6995, then 0.6972 lower Bollinger and 0.6952 30-week average.
- Daily momentum remains negative, but a rising RSI warns against selling after the whole intraday range has already been spent.
Sell-side Research
- No relevant data at the moment.
Market Chatter
- The Aussie remains under pressure after the Fed put 2026 hikes back on the menu, despite improved risk appetite from the US-Iran memorandum.
- Several Fed policymakers now expect at least one hike by year-end 2026, which is capping rallies in high-beta FX.
- Clustered stops below 0.6975 may become the next liquidity pocket if 0.6995 gives way cleanly.
Strategy
The Dollar regime argues lower, but selling the session low after a full range move is poor value. The underpriced path is a failed rebound below 0.7038/42, then renewed downside toward 0.6995 and the stop pocket below.
--------------------
USD/CAD — Spot: 1.4130
Technical Analysis
- The pair has accelerated into a fresh 2026 high, but the technical note flags a massively overbought condition after Wednesday's sharp rally.
- Resistance is 1.4152 pivot R1 and 1.4166 weekly technical resistance, then 1.4204 pivot R2. Support is 1.4020 pivot S1 and 1.3993 10-day average.
- The rally is still intact, but acceleration into resistance raises correction risk if today's high fails to extend.
Sell-side Research
- No relevant data at the moment.
Market Chatter
- Retail traders remain heavily short USD/CAD, and the short share has risen, which keeps local squeeze risk active near the highs.
- CAD also faces a separate headwind from USMCA uncertainty into the 1 July deadline.
Strategy
The easy contrarian fade is tempting, but one-sided retail shorts and broad USD strength warn against fighting the squeeze blindly. Prefer pullback discipline above 1.4122, while failure below that level shifts the setup from squeeze to overdue correction.
--------------------
EUR/GBP — Spot: 0.8667
Technical Analysis
- The cross remains constructive but volatile, with Monday's rebound having damaged the recent bear run.
- Spot is pressing the 0.8665 cloud base and 0.8673 100-day average, while 0.8700 is the larger cap. Support sits near 0.8625, then the 0.8617 lower volatility band.
- A completed daily close above 0.8673 would matter more than another intraday probe before the BoE decision.
Sell-side Research
- Bank of America expects a BoE hold today with two hike votes, while noting the risk of a more hawkish 6-3 split.
Market Chatter
- EUR/GBP overnight implied volatility is only marginally higher into BoE risk, and broader implied volatility remains near multi-year lows.
- Option pricing suggests the BoE is not expected to break the broader 0.8600-0.8750 range by itself.
- Makerfield by-election risk is being priced through options expiring early next week rather than only today's BoE window.
Strategy
The cross has already paid part of the upside move into 0.8668/73, while low implied volatility says the market is relaxed before BoE. The cleaner expression is a short-dated strangle, not spot chasing, unless 0.8673 holds after the release.
--------------------
Other Pairs
Technical Analysis
- NZD/USD failed above the 0.5867 55-day average and now trades near the lower end of the 0.5752/0.5835 post-Fed range.
- JPY crosses are heavy, with EUR/JPY back into 184.36/95 support, GBP/JPY testing the 212.84/213.03 zone, and AUD/JPY inside its 111.73/113.21 rising support area.
Sell-side Research
- MUFG says yen weakness after the BoJ hike keeps pressure on Japan to intervene again, with leveraged funds having increased short-yen exposure.
Market Chatter
- NZD/USD received only temporary relief from a GDP beat, as the hawkish Fed reaction kept the kiwi in a Dollar-led rout.
- Heavy JPY crosses show the USD/JPY intervention regime is spilling into broader yen risk rather than staying pair-specific.
Strategy
Broad USD strength favours NZD/USD downside, but the cleaner secondary risk is yen-cross liquidation if USD/JPY rejects 161.00. Avoid chasing JPY crosses into support. Prefer failed rebounds or optionality while the official-pressure regime remains live.
--------------------
Market Summary
EUR/USD — 1.1462 — Post-cut downside
- Market consensus: Bearish EUR/USD after the hawkish Fed, with option gravity still active before the cut.
- Recommendation: Respect the 1.1500/10 pin first, then favour downside if 1.1479 stays capped.
GBP/USD — 1.3226 — Wait for event
- Market consensus: Cable is heavy after the Fed, but BoE risk can still force short-covering.
- Recommendation: Avoid chasing lows before BoE. Reassess around 1.3224/25 after the decision.
USD/JPY — 160.88 — Trap watch
- Market consensus: Dollar-yen remains bid, but 161.00 is capped by options and intervention pressure.
- Recommendation: Do not chase 161.00 blindly. Fade failure unless 161.20 retests and holds.
AUD/USD — 0.7006 — Sell rebounds
- Market consensus: Aussie remains vulnerable as hawkish Fed pricing offsets risk-relief headlines.
- Recommendation: Prefer failed rebounds below 0.7038/42 before pressing 0.6995 and lower stops.
USD/CAD — 1.4130 — No fresh chase
- Market consensus: USD/CAD squeeze pressure persists, but the rally is technically overbought near highs.
- Recommendation: Stay constructive above 1.4122, but a break below shifts focus to correction risk.
EUR/GBP — 0.8667 — Options preferred
- Market consensus: BoE risk is underpriced by low volatility, with the cross near range resistance.
- Recommendation: Use a short-dated strangle, or follow spot only after 0.8673 holds post-release.
OTHERS
- Market consensus: NZD stays pressured by the Dollar, while JPY crosses remain sensitive to intervention risk.
- Recommendation: Sell failed NZD rebounds and avoid chasing yen crosses into support without rejection.
--------------------
Futures / Spot FX Context
Although the market review above is based primarily on spot FX analysis, listed FX futures may provide a relevant and transparent way for traders to express or hedge views on the same underlying currency themes. Futures prices may differ from spot prices due to factors such as interest rate differentials, contract expiry, liquidity, and basis, so traders should always refer to the appropriate futures contract and real-time market data before making any decision.
CME Group FX futures offer a centrally cleared, regulated marketplace where counterparty credit risk is mitigated through CME Clearing. They also provide transparent order-book pricing and execution rules, including a first-on-price, first-to-fill framework, which can support fairer access to liquidity across market participants. These features may make futures suitable vehicles for traders who want exposure to major FX themes within a standardized, exchange-traded framework.
When charting futures, the data provided could be delayed. Traders working with the ticker symbols discussed in this idea may prefer to use CME Group real-time data plan on TradingView: tradingview.com/cme/ .
This consideration is particularly important for shorter-term traders, whereas it may be less critical for those focused on longer-term trading strategies.
General Disclaimer:
The trade ideas presented herein are solely for illustrative purposes forming a part of a case study intended to demonstrate key principles in risk management within the context of the specific market scenarios discussed. These ideas are not to be interpreted as investment recommendations or financial advice. They do not endorse or promote any specific trading strategies, financial products, or services. The information provided is based on data believed to be reliable; however, its accuracy or completeness cannot be guaranteed. Trading in financial markets involves risks, including the potential loss of principal. Each individual should conduct their own research and consult with professional financial advisors before making any investment decisions. The author or publisher of this content bears no responsibility for any actions taken based on the information provided or for any resultant financial or other losses.
6E Short — Short setup in $6EU26 if 1.1620 retests and fails, taHTF structure remains bearish after the early-June breakdown, and the bounce has retraced into the prior breakdown/supply area around 1.1620-1.1630. On the 1h chart, price rejected that zone multiple times and is starting to roll over, making a short on a retest of 1.1620 attractive. Stop goes above the 1h swing high/failed reclaim at 1.16335; target is the next meaningful support near the prior washout low around 1.1560.
📍 Entry: 1.16200
🛑 Stop: 1.16370
🎯 Target: 1.15600
⚖️ R:R: 3.53
EUR/USD ECB Hike Priced, Bear Trap Risk Still Alive11 June 2026, 9:05 AM London, UK
The session is built around a tight cluster of live event and flow risks rather than a clean one-way Dollar trend. EUR/USD and EUR/GBP face the ECB decision and press conference today, with markets already pricing the hike and options pointing to limited initial shock. US PPI then becomes the Dollar timing gate, especially for AUD/USD and NZD/USD where risk sentiment, Middle East escalation, and vulnerable positioning sit close to stop levels. USD/JPY is the sharpest microstructure story, pinned near 160.50 but still facing 160.72/161.00 gamma and intervention tension. GBP/USD and USD/CAD remain range-sensitive, while EUR/CHF is the cleaner cross squeeze where short retail exposure is still fighting the ECB/SNB rate differential story.
--------------------
EUR/USD — Spot: 1.1542
Technical Analysis
- The failed break around 1.1513/1.1528 keeps a bear-trap recovery alive, but spot is still capped below the June 9 high.
- 1.1578 and the 1.1594 10-day moving average are the nearest topside tests, while 1.1528 is tested support and 1.1500 is the pivot floor.
- Long upper wicks, falling monthly RSI, and bearish options skew warn that rallies still face supply.
Sell-side Research
- UniCredit says a 25bp ECB hike is priced and unlikely to give EUR/USD meaningful support, leaving the pair sluggish below 1.16.
- Bank of America prefers EUR/USD shorts through summer, citing US and eurozone growth divergence, Fed repricing risk, and Middle East uncertainty.
- SEB expects a preemptive 25bp ECB hike today, but no firm commitment beyond June.
Market Chatter
- The ECB decision is due today at 13:15 London, with the press conference at 13:45. Markets fully price a 25bp hike.
- Options show muted ECB reaction risk, with overnight implied volatility near 9.0 and a simple straddle break-even around 43 pips.
- Downside hedging dominates, with one-month risk reversals at their most bearish since April.
Strategy
Downside hedges are already visible, and the failed 1.1528 break makes fresh shorts poor value into ECB risk. The underpriced path is short-covering while 1.1528 holds, with 1.1578/1.1594 the zone to fade only if the event spike fails.
--------------------
GBP/USD — Spot: 1.3379
Technical Analysis
- Sterling needs to clear the 1.3409 technical zone and the 1.3420 200-day moving average to restore a constructive bias.
- Support sits at 1.3350/55 and 1.3300/10, while resistance is layered at 1.3420 and 1.3450/60.
- The broader 1.3300-1.3500 range remains the working map into upcoming risk events.
Sell-side Research
- Morgan Stanley expects UK monthly GDP to contract 0.2% on Friday, with balanced to mildly downside risks around the number.
Market Chatter
- Dip buyers underpinned the Asia fall, helping cable rebound from 1.33505 despite US-Iran escalation.
- US PPI today is the next Fed expectations gate, while UK GDP Friday and the BoE next week keep sterling event risk high.
- Safe-haven Dollar demand from renewed Middle East attacks pulled cable back below 1.34.
Strategy
Downside is visible, but the 1.3350 flush was reclaimed and late shorts now face squeeze risk before UK GDP. Prefer fading failed rebounds below 1.3409/1.3420, not chasing lower at spot. A hold above 1.3420 delays shorts.
--------------------
USD/JPY — Spot: 160.52
Technical Analysis
- The bull run remains intact, with the 10-day moving average supporting the move since mid-May and ranges still tight.
- 160.65 upper Bollinger and the 160.72 2026 high are clean resistance, while 160.24 and the 159.95 10-day moving average are support.
- Daily indicators are near overbought, raising profit-taking risk as 160.72 approaches.
Sell-side Research
- MUFG says a BoJ hike next week is almost fully priced and is unlikely by itself to reverse yen weakness.
Market Chatter
- Today's expiries are supportive, with USD 2.6bn at 160.00/25 and another USD 724m around 160.50/98.
- Barrier and gamma interest around 160.50-161.00 is suppressing volatility, but a 161.00 break could flip hedging into rally amplification.
- Intervention threat still caps enthusiasm, while Middle East tension and wide Japan-US rate differentials keep the pair bid.
Strategy
Do not chase 160.50. The underpriced path is a controlled topside sweep toward 160.72/161.00, then failure risk if intervention pressure returns. Acceptance means holding beyond 161.00 without quick rejection, otherwise use the rejection high as reference.
--------------------
AUD/USD — Spot: 0.6998
Technical Analysis
- Back-to-back closes below the daily cloud keep the bearish structure alive after the neckline break.
- 0.7056 cloud base and 0.7081/0.7090 moving averages are overhead, while 0.6987 and 0.6967 form the immediate support ladder.
- Below 0.7000 leaves limited support before 0.6834, while a recovery above 0.7056 would weaken the bearish break.
Sell-side Research
- No relevant data at the moment.
Market Chatter
- US PPI is due today at 13:30 London, with a hotter print likely to support the Dollar through Fed expectations.
- US-Iran escalation and softer RBA expectations keep sentiment sour, with futures pricing a near-certain RBA hold next Tuesday.
- Clustered stops near 0.6978 sit just below the 0.6987 session low, creating a nearby trigger zone.
Strategy
The bearish break is real, but the better value is not selling after the first 0.7000 flush. The underpriced path is long-liquidation only if PPI or risk-off drives acceptance below 0.6987/0.6978, with rebounds under 0.7056 preferred for fresh shorts.
--------------------
USD/CAD — Spot: 1.3964
Technical Analysis
- Price action is choppy above Tuesday's low, with the June 9 high at 1.3968 acting as the key near-term cap.
- 1.4000 is the next psychological resistance, while 1.3920, 1.3897 and the 1.3882 200-hour average are support references.
- The 21-day moving average has crossed above the 200-day average, but sticky trade argues against blind topside chase.
Sell-side Research
- Credit Agricole sees USD/CAD stabilising in the upper end of its 1.35/1.40 range into summer after rate differentials explained much of the rally.
Market Chatter
- Retail traders remain heavily short, with the short share rising, which keeps squeeze risk alive near 1.3970/1.4000.
- Stop-liquidity is clustered near 1.3970, just above current spot.
- Higher oil is a CAD-supportive counterweight, but the pair is still pressing the top of the recent range.
Strategy
The underpriced path remains an upside squeeze, not a clean CAD rebound, because retail shorts sit just above the 1.3970 liquidity pocket. Participate only if the pair holds above 1.3968/1.3970, otherwise the 1.35/1.40 range cap still matters.
--------------------
EUR/GBP — Spot: 0.8627
Technical Analysis
- The cross remains soft below major moving averages and below the cloud, but momentum is weak rather than oversold.
- 0.8644 and 0.8654 are first resistance, while 0.8612 2026 low and 0.8604 lower Bollinger are the downside decision levels.
- Today's brief dip toward the 0.8619 area has not produced downside acceptance.
Sell-side Research
- SEB expects the ECB to hike 25bp today but avoid pre-commitment beyond June.
- Morgan Stanley expects UK GDP to contract 0.2% m/m on Friday, with mildly downside risks.
Market Chatter
- ECB risk today and UK GDP tomorrow put both legs inside high-impact event windows.
- The cross has been eyeing two-week lows around 0.8620 after a narrow range.
Strategy
Lower-range continuation is visible, but the better asymmetry is still a bear trap into ECB risk while 0.8612/0.8604 remains unbroken. Prefer range discipline and squeeze risk above that floor, with bearish conviction only after a held retest from underneath.
--------------------
NZD/USD — Spot: 0.5789
Technical Analysis
- The kiwi is pressing the lower hourly Bollinger area after falling from 0.5832, which may slow immediate progress lower.
- Today's 0.5786-0.5808 range leaves spot near the low, with 0.5680 the next major downside marker and 0.5990/95 distant resistance.
- A break below 0.5680 would invigorate bears, but it is not the immediate session battlefield.
Sell-side Research
- No relevant data at the moment.
Market Chatter
- US-Iran escalation is weighing on pro-risk FX, while US PPI today is the next Dollar timing gate.
- Retail exposure is heavily long, increasing local liquidation risk if 0.5770 stop-liquidity gives way.
- Recent NZ trade has been pressured by the same risk-off tone hitting AUD, but spot is already close to today's low.
Strategy
The downside has already paid below 0.5800, but retail longs still make 0.5770 the pain point. The underpriced path is not a fresh short at market, it is continuation only if that stop pocket breaks and holds.
--------------------
EUR/CHF — Spot: 0.9228
Technical Analysis
- The cross printed 0.9229, its highest level since April 30, with 0.9240 the next visible prior high.
- ECB/SNB rate expectations support the rise, while today's 0.9211 low is the near-term pullback reference.
- Spot is near the top of the recent range, so upside needs acceptance rather than another high chase.
Sell-side Research
- SEB expects an ECB hike today, which keeps rate-differential focus alive but without a firm forward commitment.
- UniCredit warns that the ECB hike is priced, a reminder not to chase euro strength indiscriminately after the decision.
Market Chatter
- Retail traders remain heavily short EUR/CHF and short exposure rose, keeping squeeze risk alive near recent highs.
- The Swiss population cap referendum on Sunday is negative event risk for the franc.
Strategy
The squeeze has done work, but retail shorts mean the underpriced path is still pullback-supported upside while 0.9211 holds. Do not chase 0.9233/0.9240 blindly, use a dip hold as confirmation that shorts remain trapped.
--------------------
Market Summary
EUR/USD — 1.1542 — Trap watch
- Market consensus: ECB hike priced, downside hedges heavy, but the 1.1528 break has failed.
- Recommendation: Respect short-covering above 1.1528. Fade only a failed 1.1578/1.1594 event spike.
GBP/USD — 1.3379 — Trap watch
- Market consensus: Cable remains range-bound, with Dollar safe-haven demand offset by dip buying.
- Recommendation: Avoid chasing below 1.3350. Fade failed rebounds while 1.3409/1.3420 caps.
USD/JPY — 160.52 — No fresh chase
- Market consensus: The pair is bid, but gamma and intervention threat crowd the 160.72/161.00 zone.
- Recommendation: Let any 160.72/161.00 sweep prove acceptance. Fade rejection rather than chase 160.50.
AUD/USD — 0.6998 — Short below 0.6987
- Market consensus: Bearish structure is clear, with PPI and risk-off pressure near the 0.7000 battlefield.
- Recommendation: Prefer shorts only after 0.6987/0.6978 acceptance, or on failed rebounds below 0.7056.
USD/CAD — 1.3964 — Long above 1.3970
- Market consensus: Upper-range stability remains intact, with retail shorts vulnerable near 1.3970.
- Recommendation: Join only a held 1.3968/1.3970 break. Otherwise respect the 1.35/1.40 range cap.
EUR/GBP — 0.8627 — Range trading
- Market consensus: The cross is soft, but ECB and UK GDP risk make lower-range breaks suspect.
- Recommendation: Treat 0.8612/0.8604 dips as trap risk unless a break retests from underneath.
NZD/USD — 0.5789 — Short below 0.5770
- Market consensus: Risk-off pressure is heavy, but the pair is already near today's low.
- Recommendation: Do not sell at market. Follow only if 0.5770 stop-liquidity breaks and holds.
EUR/CHF — 0.9228 — Constructive
- Market consensus: ECB/SNB rate spread supports the cross, while retail shorts keep squeeze risk alive.
- Recommendation: Prefer pullback-supported upside above 0.9211. Avoid chasing 0.9233/0.9240 blindly.
--------------------
Futures / Spot FX Context
Although the market review above is based primarily on spot FX analysis, listed FX futures may provide a relevant and transparent way for traders to express or hedge views on the same underlying currency themes. Futures prices may differ from spot prices due to factors such as interest rate differentials, contract expiry, liquidity, and basis, so traders should always refer to the appropriate futures contract and real-time market data before making any decision.
CME Group FX futures offer a centrally cleared, regulated marketplace where counterparty credit risk is mitigated through CME Clearing. They also provide transparent order-book pricing and execution rules, including a first-on-price, first-to-fill framework, which can support fairer access to liquidity across market participants. These features may make futures suitable vehicles for traders who want exposure to major FX themes within a standardized, exchange-traded framework.
When charting futures, the data provided could be delayed. Traders working with the ticker symbols discussed in this idea may prefer to use CME Group real-time data plan on TradingView: tradingview.com/cme/ .
This consideration is particularly important for shorter-term traders, whereas it may be less critical for those focused on longer-term trading strategies.
General Disclaimer:
The trade ideas presented herein are solely for illustrative purposes forming a part of a case study intended to demonstrate key principles in risk management within the context of the specific market scenarios discussed. These ideas are not to be interpreted as investment recommendations or financial advice. They do not endorse or promote any specific trading strategies, financial products, or services. The information provided is based on data believed to be reliable; however, its accuracy or completeness cannot be guaranteed. Trading in financial markets involves risks, including the potential loss of principal. Each individual should conduct their own research and consult with professional financial advisors before making any investment decisions. The author or publisher of this content bears no responsibility for any actions taken based on the information provided or for any resultant financial or other losses.
The euro may weaken further versus the US dollarThe EUR/USD fell sharply after the stronger-than-expected U.S. jobs report on June 5. The move pushed the euro below a short-term support level at 1.159 and, more importantly, out of a consolidation phase that appeared to be forming a larger bear flag pattern. As of June 8, EUR/USD appears to be bouncing from a support region around 1.151, though whether that level can hold over the longer term remains to be seen.
EUR/USD is now trading below all its major moving averages, including the 10-day and 20-day exponential moving averages, as well as the 50-day and 200-day simple moving averages. Additionally, the shorter-term 10-day and 20-day moving averages are trending lower and are now acting as resistance. This suggests there is significant overhead resistance around 1.158.
A break below support at 1.151 could trigger a decline towards 1.14. It would also suggest that EUR/USD is extending lower from its bear flag pattern and could head even lower. A measured move based on the bear flag could indicate a move towards 1.14, which would take the pair back to levels last seen in mid-March.
Meanwhile, the Relative Strength Index (RSI) has trended lower since peaking in overbought territory above 70 in late January, suggesting that EUR/USD momentum has been fading. The RSI is currently around 36 and still trending lower, which some technical analysts interpret as a sign that bearish momentum remains present.
Written by Michael J. Kramer, founder of Mott Capital Management.
Disclaimer: CMC Markets is an execution-only service provider. The material (whether or not it states any opinions) is for general information purposes only and does not take into account your personal circumstances or objectives. Nothing in this material is (or should be considered to be) financial, investment or other advice on which reliance should be placed.
No opinion given in the material constitutes a recommendation by CMC Markets or the author that any particular investment, security, transaction, or investment strategy is suitable for any specific person. The material has not been prepared in accordance with legal requirements designed to promote the independence of investment research. Although we are not specifically prevented from dealing before providing this material, we do not seek to take advantage of the material prior to its dissemination.
E
Euro Futures Trade LowerThe Euro futures contract experienced a notable shift in momentum over the past month, transitioning from an early-May peak into a steady downward trend. Opening the month on a relatively firm footing near 1.1726, the contract found short-lived bullish support, rallying to a monthly high of 1.1792 by May 8th. This initial strength reflected a temporary weakening of the U.S. dollar, as macro traders initially weighed cooling economic indicators against a somewhat hesitant European Central Bank.
However, the tide turned sharply during the second week of May, establishing a dominant bearish channel that persisted into early June. By mid-month, the contract broke below the key 1.1700 psychological level, accelerating downward to find local support near the 1.1603 mark by May 23rd. Despite a brief, late-month consolidation that saw the Euro attempt to stabilize around 1.1650, sellers ultimately retained control. Driven by renewed macroeconomic strength in the U.S. and widening interest rate differentials, the contract closed out the rolling 30-day period under intense pressure, touching a fresh monthly low of 1.1599 in early June trading.
If you have futures in your trading portfolio, you can check out on CME Group data plans available that suit your trading needs tradingview.com/cme/
*CME Group futures are not suitable for all investors and involve the risk of loss. Copyright © 2023 CME Group Inc.
**All examples in this report are hypothetical interpretations of situations and are used for explanation purposes only. The views in this report reflect solely those of the author and not necessarily those of CME Group or its affiliated institutions. This report and the information herein should not be considered investment advice or the results of actual market experience.
EUR/USD Squeezed Between Dollar Rates and Option Support18 May 2026, 9:05 AM London, UK
The session is being driven by a cross-pair dollar impulse: higher US Treasury yields, renewed Fed hike discussion, firmer oil and risk aversion are pressing EUR/USD, GBP/USD and AUD/USD lower while keeping USD/CAD bid. Dollar-yen is the most tactical expression, with spot pulled toward a large 159.00 expiry today but still trading in a policy-sensitive zone where intervention risk can quickly turn a clean breakout into a trap. Sterling remains under separate pressure from UK political and fiscal worries, helping EUR/GBP hold its breakout. The Aussie and kiwi are softer as Chinese data disappoints and high-beta positioning looks vulnerable. The key question is not whether the USD story is visible, but whether positioning has paid enough of it yet.
--------------------
EUR/USD — Spot: 1.1632
Technical Analysis
- The euro remains in a five-session slide, with negative momentum and RSI confirming the defensive structure.
- 1.1676 capped the latest rebound near the prior session high, while 1.1605 weekly cloud-top support has been tested and 1.1584 is the cleaner daily cloud base below.
- A close below 1.1584 would reopen the early-April low area, with rallies needing acceptance above 1.1685 to slow the bearish pressure.
Sell-side Research
- SocGen sees room for near-term USD gains, arguing US 2-year yields have risen faster than peers and the dollar has not fully matched the rates move.
- Bank of America remains cautious on EUR/USD, citing strong US data and energy markets that already price a best-case scenario.
- Credit Agricole expects USD-positive FX flows as a fading liquidity glut, Treasury issuance and higher energy prices support dollar demand.
Market Chatter
- Rising oil is being treated as a euro headwind because the bloc is an importer, while the dollar benefits from the inflation and rate impulse.
- Today's New York cut has large interest around 1.1600 and 1.1640/65, giving hedging flows reasons to slow follow-through on both sides.
- Clustered stops below 1.1603 make a support sweep possible if the option floor fails to hold.
Strategy
The dollar move is cross-pair, but EUR/USD is close to option-supported lows. Prefer selling failed rebounds below 1.1640/65 rather than chasing a dip into 1.1600. A clean post-cut break below 1.1603 would make downside continuation less crowded.
--------------------
GBP/USD — Spot: 1.3355
Technical Analysis
- Sterling has shifted from pressure-building to confirmed downside after last week's fall, with negative momentum still intact.
- The 1.3483 100-DMA and 1.3499 30-DMA have flipped into overhead supply, while 1.3322/23 marked the key lower technical area that was probed.
- Recovery needs a move back through 1.3390/1.3400 before the breakdown looks less secure.
Sell-side Research
- Bank of America favours long USD exposure versus GBP, combining underpriced dollar upside with UK political risks.
- ANZ identifies GBP as a structural underperformer, citing fiscal uncertainty, energy-importer exposure and a persistent political-risk premium.
- Credit Agricole's USD-positive flow view adds a broader dollar-supportive overlay to sterling's domestic weakness.
Market Chatter
- Cable remains weighed by broad USD strength, risk aversion, UK political concerns and pressure in UK government bond markets.
- Support is being watched around 1.3285/90 and 1.3250, with resistance clustered around 1.3350/60 and 1.3390/1.3400.
- Retail exposure is tilted long, which can add downside pressure if rebounds keep failing below 1.3400.
Strategy
The sterling-negative story has already paid, but longs remain exposed if cable cannot reclaim 1.3390/1.3400. Prefer fading failed rebounds rather than selling the session low. A break under 1.3300 would signal renewed liquidation, not just USD strength.
--------------------
USD/JPY — Spot: 158.91
Technical Analysis
- The weekly chart is constructive after a hammer-style signal and a potential bullish engulfing pattern, but spot is testing a policy-sensitive zone.
- The 158.82/158.91 cloud-top area is the active trend filter, while 160.64/72 from the upper Bollinger band and April high is the next major topside zone.
- A daily close above the trend filter would improve the structure, but the 159.08 intraday rejection warns against assuming clean acceptance.
Sell-side Research
- RBC expects yen intervention to act as a lid on USD/JPY rather than a catalyst for sustained yen strength.
- Credit Agricole says further intervention may be the only way to cap the pair while US rates remain the stronger driver.
- Nomura flags the 158 area as likely to attract intervention caution if Middle East tensions keep the dollar supported.
- Bank of America says structural outflows and fiscal concerns remain sources of yen weakness.
Market Chatter
- Thin late-Tokyo trade pushed spot briefly above 159.00 before a pullback, showing both topside demand and official-risk caution.
- Today's New York cut has roughly $5.7bn around 159.00, with two-way gamma flows likely to keep spot magnetised before expiry.
- Japanese importer demand at the Tokyo fix and broad USD strength supported dips, while the market remains wary of renewed yen-supporting action.
Strategy
The 159.00 overshoot has already happened, so the edge is post-trigger assessment. Option gravity can still pin spot before the cut, but fresh longs need acceptance above 159.08. A quick return below 158.82 would turn the move into bull-trap risk.
--------------------
USD/CAD — Spot: 1.3746
Technical Analysis
- The pair is just off Friday's high and still threatens a ninth straight bullish session.
- Friday's 1.3767 high is the immediate overhead reference, ahead of 1.3813 from the 61.8% Fibonacci level and 200-DMA, while 1.3725 is the nearest technical floor.
- A weekly close above the moving-average area would strengthen the bullish structure, but 1.3813 is the level that really tests follow-through.
Sell-side Research
- Bank of America prefers long USD/CAD as part of its bullish near-term USD view, citing BoC and trade-policy risks.
- Credit Agricole expects USD-positive FX flows to gain importance as liquidity tightens and higher energy prices keep US rates supported.
Market Chatter
- Oil strength has not delivered the usual CAD support, with Fed hike expectations and US-Canada front-end convergence keeping the pair elevated.
- USMCA uncertainty and political friction are moving back into focus as an additional CAD headwind.
- Resistance is discussed around 1.3759/1.3767, with 1.3813 the next larger technical magnet if that zone gives way.
Strategy
The breakout has extended, but the pair is pressing into a well-flagged 1.3760/67 cap. Stay constructive only while 1.3725 holds. Chasing strength into resistance has poorer asymmetry than waiting for acceptance, or for a failed break to expose late dollar longs.
--------------------
AUD/USD — Spot: 0.7152
Technical Analysis
- The weekly bearish engulfing signal has been activated after the close below 0.7200, leaving supply in control.
- The rejected 0.7272/77 upper Bollinger and 2026 high zone is now distant resistance, while 0.7112 lower Bollinger support is the first clean downside level.
- A break below 0.7100 would reinforce bearish sentiment and expose 0.7077 Fibonacci support.
Sell-side Research
- ANZ expects AUD to remain a relative outperformer, helped by carry and energy-exporter status, even as JPY and GBP underperform.
- Bank of America's underpriced USD-upside view is a direct headwind for high-beta FX if strong US data and Fed hike risk persist.
- Credit Agricole's USD-positive flow argument also limits the case for chasing Aussie rebounds.
Market Chatter
- Chinese industrial output and retail sales missed expectations sharply, adding to pressure on the Aussie.
- Risk aversion, weaker Asian equities and higher US Treasury yields are supporting the dollar against high-beta currencies.
- Speculative AUD longs rose to their largest position since 2013, raising long-liquidation risk if 0.7100 breaks.
Strategy
The obvious AUD-supportive carry story conflicts with heavy ownership and poor China data. The underpriced path remains long liquidation if 0.7112/0.7100 fails. Until 0.7200 is reclaimed, rebounds look better for reducing longs than rebuilding exposure.
--------------------
EUR/GBP — Spot: 0.8710
Technical Analysis
- The cross has cleared key resistance, with widening Bollinger bands confirming a volatility breakout.
- 0.8744, the 31 March high, is the next clean resistance, while 0.8701/0.8695 is the breakout floor from the daily cloud area.
- Holding above 0.8700 keeps the higher range intact, but failure there would warn that the breakout is turning crowded.
Sell-side Research
- MUFG sees scope for EUR/GBP to spike through 0.9000 if UK political uncertainty persists and policy shifts left.
- Nomura raised conviction on long EUR/GBP, targeting 0.8950 by end-June as gilt weakness and political instability weigh on sterling.
- ANZ treats GBP as a structural underperformer due to fiscal uncertainty and energy-importer exposure.
- Bank of America says underpriced UK political risks argue against rushing to sell EUR versus GBP.
Market Chatter
- The cross remains bid as sterling-specific political stress offsets broader euro softness.
- Today's New York cut has option interest around 0.8700/10 and 0.8750/60, keeping the breakout zone tactically busy.
- Clustered stops above 0.8730 could fuel a topside sweep if spot regains today's high.
Strategy
The sterling-bearish story is well sponsored, but the breakout has not exhausted while 0.8700 holds. Prefer staying constructive on defended dips rather than chasing 0.8730. A fast loss of 0.8700 would signal late-long trap risk.
--------------------
Other Pairs
Technical Analysis
- NZD/USD briefly threatened its 0.5839 200-DMA area before recovering, leaving 0.5815 as the next downside support and 0.6090/95 as distant resistance.
- EUR/JPY remains range-bound around the 184.65 option area, while AUD/JPY is heavy after risk sentiment deteriorated.
Sell-side Research
- ANZ expects AUD to outperform while JPY and GBP remain structural underperformers, a relative-value backdrop that still matters for AUD/JPY and AUD/NZD.
- Bank of America says EUR screens overvalued versus NZD, although near-term dollar strength still dominates NZD/USD direction.
Market Chatter
- AUD/NZD remains a squeeze backdrop: retail exposure is heavily short, while futures positioning favours AUD over NZD at multi-year extremes.
- NZD/USD has clustered stops below 0.5820, making a downside sweep possible if the 200-DMA area gives way again.
- EUR/JPY has a large 184.65 expiry today, which can keep the cross contained before the New York cut.
Strategy
Secondary trades are about timing, not chasing. AUD/NZD still has squeeze fuel, but ownership signals argue for pullbacks over fresh highs. NZD/USD needs acceptance below 0.5820 for continuation, while EUR/JPY may remain pinned until option gravity fades.
--------------------
Market Summary
EUR/USD — 1.1632 — Sell rallies
- Market consensus: USD rates, oil pressure and option hedging keep the pair heavy near support.
- Recommendation: Sell failed rebounds below 1.1640/65, follow downside only after 1.1603 acceptance.
GBP/USD — 1.3355 — Bearish
- Market consensus: Sterling politics, fiscal stress and broad USD demand keep cable under pressure.
- Recommendation: Fade failed rebounds below 1.3400, watch 1.3300 for renewed liquidation.
USD/JPY — 158.91 — Options preferred
- Market consensus: 159.00 expiry magnet supports spot, but official-risk caution limits clean upside.
- Recommendation: Avoid chasing near 159.00, trade acceptance above 159.08 or rejection below 158.82.
USD/CAD — 1.3746 — Constructive
- Market consensus: Fed repricing and USD flows outweigh oil support for CAD near resistance.
- Recommendation: Stay constructive above 1.3725, avoid chasing unless 1.3767 accepts.
AUD/USD — 0.7152 — Defensive
- Market consensus: China disappointment, risk aversion and stretched speculative longs pressure the Aussie.
- Recommendation: Respect downside below 0.7200, liquidation risk rises if 0.7100 breaks.
EUR/GBP — 0.8710 — Constructive
- Market consensus: Banks and UK political stress support the breakout, with 0.8700 pivotal.
- Recommendation: Stay constructive on defended dips, reassess fast if 0.8700 fails.
OTHERS
- Market consensus: AUD/NZD squeeze risk, NZD fragility and EUR/JPY option pinning dominate secondary themes.
- Recommendation: Use pullbacks in AUD/NZD, require NZD/USD downside acceptance, reassess EUR/JPY after the cut.
--------------------
Futures / Spot FX Context
Although the market review above is based primarily on spot FX analysis, listed FX futures may provide a relevant and transparent way for traders to express or hedge views on the same underlying currency themes. Futures prices may differ from spot prices due to factors such as interest rate differentials, contract expiry, liquidity, and basis, so traders should always refer to the appropriate futures contract and real-time market data before making any decision.
CME Group FX futures offer a centrally cleared, regulated marketplace where counterparty credit risk is mitigated through CME Clearing. They also provide transparent order-book pricing and execution rules, including a first-on-price, first-to-fill framework, which can support fairer access to liquidity across market participants. These features may make futures suitable vehicles for traders who want exposure to major FX themes within a standardized, exchange-traded framework.
When charting futures, the data provided could be delayed. Traders working with the ticker symbols discussed in this idea may prefer to use CME Group real-time data plan on TradingView: tradingview.com/cme/ .
This consideration is particularly important for shorter-term traders, whereas it may be less critical for those focused on longer-term trading strategies.
General Disclaimer:
The trade ideas presented herein are solely for illustrative purposes forming a part of a case study intended to demonstrate key principles in risk management within the context of the specific market scenarios discussed. These ideas are not to be interpreted as investment recommendations or financial advice. They do not endorse or promote any specific trading strategies, financial products, or services. The information provided is based on data believed to be reliable; however, its accuracy or completeness cannot be guaranteed. Trading in financial markets involves risks, including the potential loss of principal. Each individual should conduct their own research and consult with professional financial advisors before making any investment decisions. The author or publisher of this content bears no responsibility for any actions taken based on the information provided or for any resultant financial or other losses.