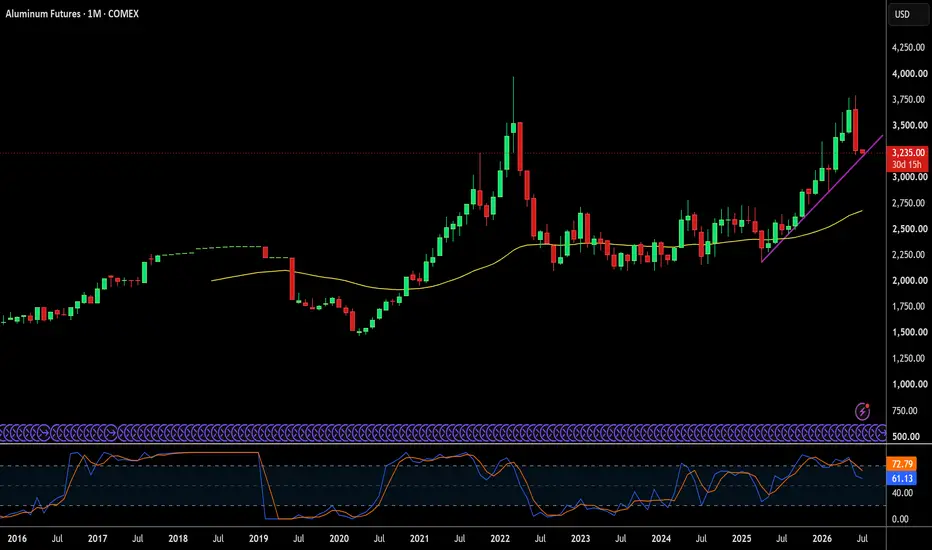
Aluminum's Worst Crash Since 2008: But Where's the Metal?Aluminum just posted its worst month since 2008, falling 16% in June and erasing the entire March through May rally in one move. The trigger was geopolitical: a fragile but real de-escalation between the US and Iran that raised the prospect of Persian Gulf shipments resuming, a region that supplies nearly a tenth of global output. Markets moved fast on that expectation, flipping the futures curve into contango and collapsing physical premiums even before a single additional tonne actually reached the market. That gap, between priced-in relief and delivered supply, is the central tension in aluminum right now.
The macro backdrop compounded the move. The Fed held rates steady in June, but its updated projections show a majority of officials now leaning toward a hike later this year, a sharp reversal from the cutting bias priced in just months earlier. That hawkish pivot pushed the dollar higher, which mechanically pressures dollar-denominated commodities and gave sellers another reason to exit long positions built during the spring supply scare. Rising output from China and Indonesia added a second layer of supply-side pressure, reinforcing the same directional trade.
What the price action obscures is that physical tightness has not actually resolved. LME warehouse stocks kept falling through late June, down roughly 38% since the start of the year, even as prices dropped. That divergence, futures pricing in a supply recovery that hasn't yet shown up in inventories, is a bet on where Gulf shipments and Chinese output are headed, not a reflection of today's balance sheet. If the Iran truce falters, as it briefly appeared to in late June, or if the ramp from Gulf producers proves slower than the curve now assumes, the market has room to reprice sharply back higher.
Beneath the volatility, the structural story is intact and arguably underappreciated. Copper's price, still roughly four times aluminum's, keeps pushing high-tech manufacturers toward aluminum in EV wiring and grid infrastructure, a substitution trend that doesn't reverse on a one-month price swing. For producers, the near-term challenge is margin discipline in a sluggish spot market where buyers won't commit to inventory at current prices. For investors, the real question isn't whether June's crash was overdone; it's whether the market is correctly pricing a supply recovery that, as of today, exists mostly on paper.
Aluminum MW US Premium 25MT Futures (Jan 2028)
No trades
No trades
In-depth trading ideas
MCX Aluminium Bulls Stay in Control Above 364MCX Aluminium Futures continues to maintain a strong bullish structure on the daily chart, with price consistently trading above both the 50 EMA and 100 EMA . The broader trend remains positive, while the recent higher highs and higher lows continue to support the ongoing impulsive wave structure.
The current advance appears to be developing within a larger wave sequence, with price now moving through the later stages of wave iii. Momentum remains constructive as long as Aluminium continues holding above the 364 support region, which now acts as the key level for maintaining bullish continuation.
The recent consolidation above the moving averages also suggests that buyers are still defending dips rather than allowing a deeper correction. This keeps the broader trend structure intact and supports the possibility of another impulsive leg higher.
If momentum continues building from the current structure, the next upside objectives come in around 420 and 440 region over the medium term.
We will update further information on MCX:ALUMINIUM1! soon.
ALUMINIUM - Quiet Strength Building and ready for a rocket Aluminum may not get the attention of Gold or Silver, but it remains one of the world’s most important industrial metals.
Demand from electric vehicles, renewable energy, aerospace and infrastructure continues growing, while technically the chart is starting to show bullish continuation signals.
The market appears to be transitioning from consolidation back into expansion.
🌍 Fundamentals
EV Demand
Electric vehicles require large amounts of Aluminum because it is lightweight and energy efficient. And have you seen the boost of BYD and Chinese Electric vehicles? Crazy.
Infrastructure Spending
Global infrastructure and construction projects continue supporting industrial metal demand.
Aerospace Industry
Aircraft manufacturing remains heavily dependent on Aluminum usage.
Green Energy Growth
Solar, wind and power grid expansion continue increasing long-term Aluminum demand.
Supply Constraints
Energy costs and production cuts in some regions continue tightening supply.
📈 Technicals
W Formation
Aluminum has formed a bullish “W” reversal structure.
Above the 20 & 200MA
Price remains above major moving averages, confirming bullish structure.
Breakout Attempt
The market is attempting to break out of its recent consolidation zone.
Higher Lows
Buyers continue stepping in earlier on pullbacks.
Target Projection
The measured move projects a potential upside target near:
🎯 $4,246
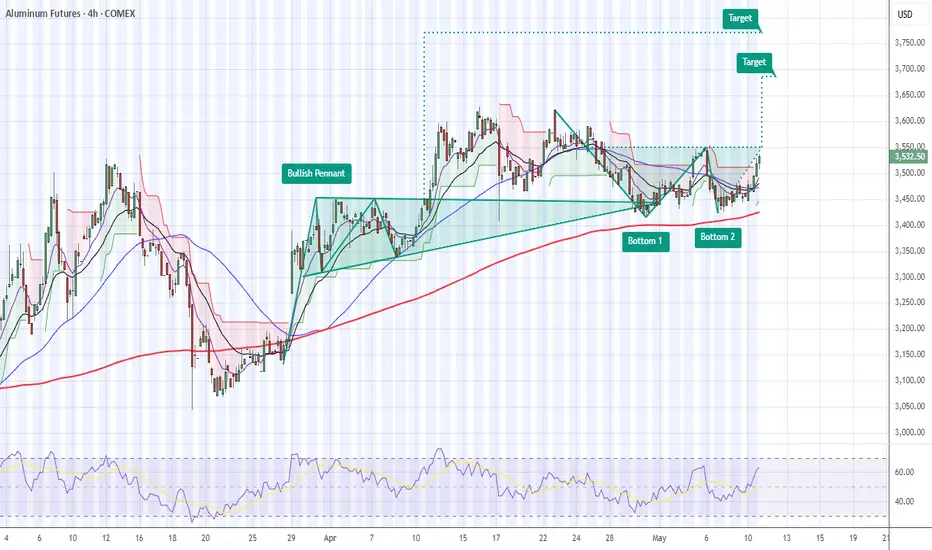
Aluminum Futures — Bullish SetupAluminum is gaining momentum as several bullish patterns line up.
We have a bullish pennant, a possible double bottom structure, and price action starting to break higher again.
Tgt: 3,685.
I like this setup for:
- Long futures
- Buying 3,550 calls
A close below 3,400 would invalidate the pattern.
Trade idea: bullish while price holds above the recent double bottom zone.
#Aluminum #Commodities #Futures #Options #TechnicalAnalysis #TradingView #RiskManagement
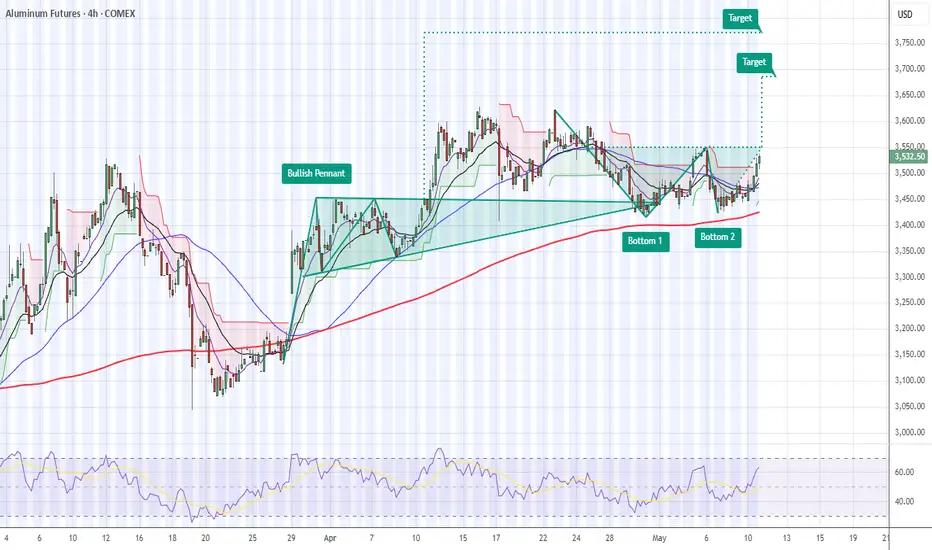
Aluminum Futures — Bullish SetupAluminum is gaining momentum as several bullish patterns line up.
We have a bullish pennant, a possible double bottom structure, and price action starting to break higher again.
Target: 3,685.
I like this setup for:
- Long futures
- Buying 3,550 calls
A close below 3,400 would invalidate the pattern.
Trade idea: bullish while price holds above the recent double bottom zone.
#Aluminum #Commodities #Futures #Options #TechnicalAnalysis #TradingView #RiskManagement
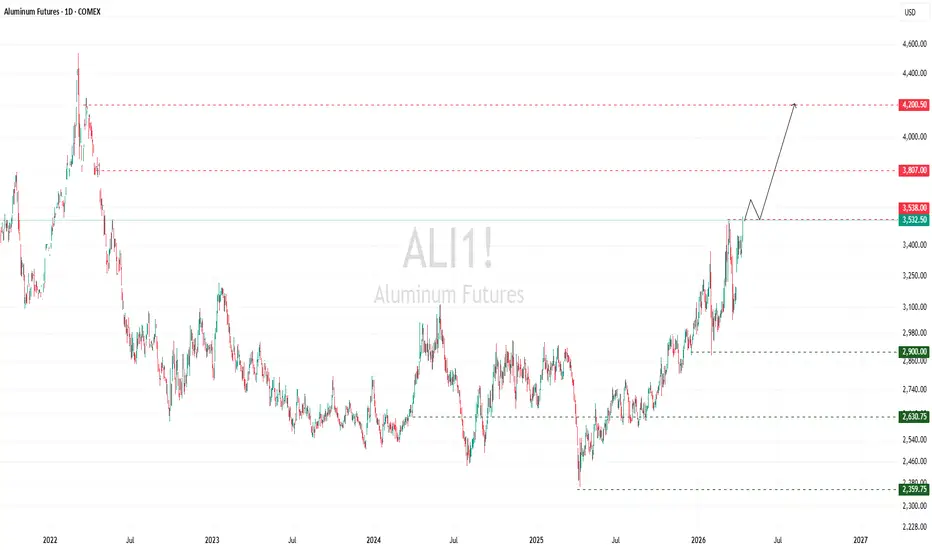
Aluminum broke the record past 3,417, establishing a Markup phasThe market completely escaped the long-term accumulation zone with a Breakout candlestick with extremely strong momentum, breaking all the nearest resistance structures. Markup trend is in absolute control; trading tendency to prioritize holding Buy positions and increasing the proportion at technical corrections.
2. Review previous session recommendations
The main Buy position in the accumulation zone of 3,100 - 3,200 has achieved maximum effectiveness when the price decisively broke through the psychological resistance level of 3,400. The Breakout and Structural Conversion Confirmation Scenario (ChoCh) has been completed, bringing all Buy orders into a state of explosive profits. Currently, the stop loss is recommended to be raised to 3,350 to preserve profits.
3. Overview of trends & price structure
Aluminum has officially ended the long accumulation phase and moved into a strong markup phase with expansion acceleration. The market structure recorded a change in nature (ChoCh) and continuously established structural breaking points (BOS) in an upward direction, showing that the Buyers were completely dominant. The fact that the price surpassed the old Equal Highs (EQH) zones and closed at the session's highest confirms that large cash flows have decisively entered the market, eliminating all hanging supply pressure. The chart's logic shows that the market is in a state of strong upward momentum, heading directly towards the long-term target area without encountering any significant short-term resistance.
4. Technical prices
Resistance: 3,800 – 4,000 – 4,212
Support: 3,417 – 3,199
5. Price Action & Volume Analysis
Price Action, Volume & Open Interest: The most recent day's candle was a bullish Marubozu candle with an exceptionally long body, closing at 3,538.50. Trading volume exploded, reaching 428 (a sharp increase compared to the average of previous sessions). Although the OI data does not show detailed numbers on the chart, based on the candle amplitude and high green Volume, the market is in the state: Price increases + High green volume + OI increases → New money flows into Long, the uptrend is confirmed and sustainable. This is a signal confirming the absolute strength of the Buy side, showing that new money flows are continuously pouring in. market to push prices up.
Market sentiment & Cash flow: Hedge funds (Non-Commercial) are showing extreme determination when executing aggressive buy orders, pushing prices past the "Weak Peak" areas. Excitement is taking over as the price structure escapes the prolonged turbulence zone. Commercial traders show signs of stopping defensive selling activities (Short Hedge) and are waiting for higher prices to re-establish their positions, creating a supply gap that helps prices easily sublimate.
Price & Wave Structure: A steep ascending peak–trough sequence confirms the formation of a powerful impulse wave. According to the SMC method, the price has completed the liquidity sweep of the old peak area and is moving in a push to the final target (TP) at 4,212. The current price position is completely above the newly established Demand zones around 3,417. This bullish structure will only be invalidated if the price turns sharply lower and breaks the support level of 3,199, a scenario with extremely low probability in the context of current momentum.
6. Next session's trading scenario
Action: Continue to hold the existing Buy position. Target: 3,800 – 4,000. Stop Loss: Raise Trailing Stop to 3,450. Basis: Marubozu candle momentum and new cash flow ensure continued upward momentum.
Scenario 2 (25%): The price appears a technical correction (Retest) to test the support zone 3,417.
Action: Open another Buy position or buy a new one at area 3,420. Target: 4,212. Stop loss: 3,350. Basic: Re-test the demand force at the structural breakdown zone (BOS) before continuing the upward wave.
7. Recommendations by audience
Manufacturer/importer (Buyer): Implement purchase cost determination (Long Hedge) drastically right at short-term fluctuations. With the current Markup structure, aluminum prices are likely to reach the 4,000 mark very quickly, waiting for cheaper prices can pose a big risk in input costs.
Trade/export (Seller): Absolutely do not establish short positions that block the trend. Patiently wait for the price to approach the target area of 4,212 and clear reversal signals appear on the large frame before considering re-establishing short hedging positions (Short Hedge).
Aluminium Outlook | Imbalance Fill Before Expansion?📊 Aluminium Outlook | Imbalance Fill Before Expansion?
CMP: 340
In this chart, Aluminium is currently trading inside a key supply/resistance zone (Golden Zone), showing signs of consolidation after a prior move.
📌 Key Observations:
• Price reacting from a structured resistance zone
• Gap Imbalance (FVG) present around 315
• Market forming a potential corrective structure
📊 Possible Scenarios:
🔶 Scenario 1 (Corrective Move First):
Price may continue to face resistance and move lower to fill the imbalance zone near 315 before initiating a fresh bullish move.
🔷 Scenario 2 (Direct Expansion):
If price sustains above the current zone, a breakout could lead to a strong upside expansion without a deep correction.
🧠 Technical Confluence:
• Imbalance (FVG) acting as magnet for price
• Resistance zone reaction
• Structure-based continuation setup
⚠️ Disclaimer:
This analysis is for educational purposes only and not financial advice. Always use proper risk management as market conditions can change.
👉 Wait for confirmation. React to price, not assumptions.
#Aluminium #PriceAction #FVG #MarketStructure #Commodities #NiftyKing
Aluminum is in a strong uptrend that's picking up speed.
#Aluminium PSE:ALI ➖ Aluminum is in a strong uptrend that's picking up speed.
• From the current price of $3,121.00 on Comex Aluminum Futures, there's solid potential for 25-30% upside.
• The main target is breaking the 2022 all-time high in the $3,900-$4,000 zone.
I already shared ideas on gold and platinum earlier, and now we've finally gotten to aluminum.
Gold:
Platinum:
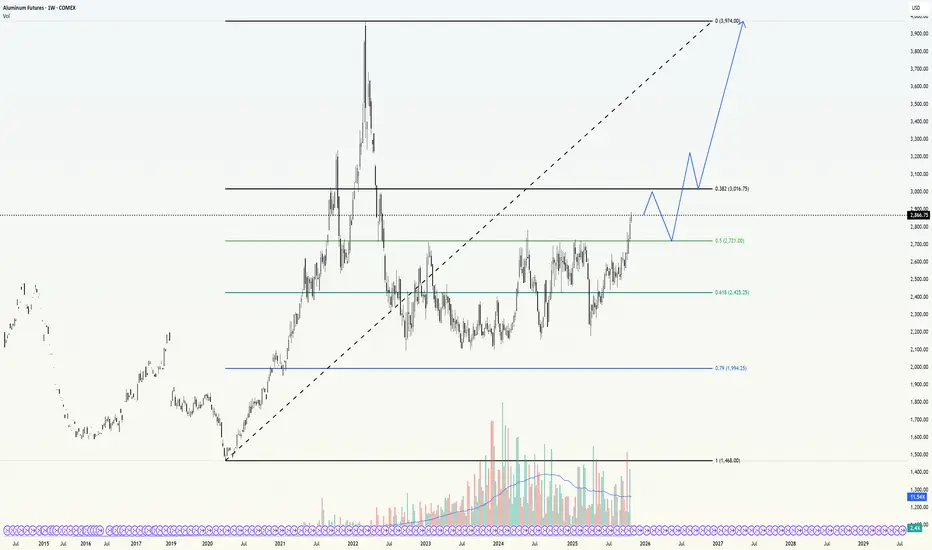
Long-Term Long ALI1 1W"Since the macro accumulation (1W) is confirmed by strong Higher Lows (HL) and the current structure has broken (BOS) the key resistance at the 0.5 Fib level, my bias is Long-Term Long.
I expect any pullbacks (e.g. to the "0.5 test") to be corrective.
Then the first logical target is to withdraw liquidity and test the 0.32 Fib zone (~3000). If this zone fails to hold, the next target will be the gap zone above, and ultimately the ATX test (3974)."
This is not investment advice!!! Keep your risks low!!! Happy trading!
Aluminium Futures
The overall trend appears to be transitioning from a downtrend into a new uptrend.
Current Price Position: The price is currently testing the upper Bollinger Band, which suggests increased volatility. If the price continues to close near or above this upper band, it could indicate strong bullish pressure. However, if the price gets rejected at the band, it could indicate a pullback.
Support Levels: The 20-day moving average (middle Bollinger Band), which is currently acting as support, lies around INR230.
Resistance Levels: The recent high near the upper Bollinger Band, around INR241, is acting as short-term resistance. A breakout above this could push prices towards higher levels.
The volume bars show higher buying interest during recent bullish candles, indicating that buyers are stepping in to support the upward movement.
Bullish Candles: Recent large bullish candlesticks suggest strong buying pressure. Look out for a close above the recent high (INR241.85) for further confirmation of the trend.
Short-Term Outlook: Aluminium Futures are showing bullish momentum in the short term. A break above the current resistance at INR241 could lead to further gains.
Potential Pullback: Watch for any rejection near the upper Bollinger Band for signs of a pullback, possibly towards INR230.
Long-Term Outlook: As long as the price remains above key support levels and moving averages, the medium- to long-term trend is bullish.
Can Aluminum Break Out? As geopolitical risks continue to cast a shadow over both equities and commodities, it is essential to recognize the crucial roles commodities play during times of conflict and the potential implications of any escalation on specific commodities.
Aluminum, valued for its malleability, corrosion resistance, and capacity to be intricately machined, finds application in the production of machinery and equipment parts, as well as in the aerospace and defense industries for aircraft components, missile structures, and military vehicles.
China holds the dual distinction of being the largest producer and consumer of aluminum, making China's trajectory a critical factor influencing the industrial metals market going forward.
With the Chinese industrial and manufacturing sector poised for a rebound, the expansion could potentially benefit industrial metals as a whole, such as copper and aluminum.
In terms of technical analysis, aluminum has recently exhibited the formation of an inverse head and shoulders pattern, with the left shoulder ranging from 2090 to 2115, the head at 2075-2078, and the right shoulder at 2165.
To see more buying activity, a decisive break and close above the significant resistance level of 2380-2450 is crucial. Conversely, if the market fails to break and close above this level, substantial support can be expected within the shoulder range of 2090 (left) to 2165 (right).
A break and close below these levels may lead to a test of the most recent lows (the inverse head) at 2075-2078.
Check out CME Group real-time data plans available on TradingView here: www.tradingview.com
Disclaimers:
CME Real-time Market Data help identify trading set-ups and express my market views. If you have futures in your trading portfolio, you can check out on CME Group data plans available that suit your trading needs www.tradingview.com
*Trade ideas cited above are for illustration only, as an integral part of a case study to demonstrate the fundamental concepts in risk management under the market scenarios being discussed. They shall not be construed as investment recommendations or advice. Nor are they used to promote any specific products, or services.
Futures trading involves substantial risk of loss and may not be suitable for all investors. Trading advice is based on information taken from trade and statistical services and other sources Blue Line Futures, LLC believes are reliable. We do not guarantee that such information is accurate or complete and it should not be relied upon as such. Trading advice reflects our good faith judgment at a specific time and is subject to change without notice. There is no guarantee that the advice we give will result in profitable trades. All trading decisions will be made by the account holder. Past performance is not necessarily indicative of future results.
Precious Metals Schematics: A look into the Macro with FibonacciI have Listed Silver, Copper, Platinum, Palladium, Aluminum, and Gold into one chart. These are 6 of the top Metals all in Heikin Ashi Candle form.
They all have their own complex Fibonacci Clusters within each one. It may look confusing at first. But understand that one set of lines are horizontal extensions and another set are angled extensions within each one.
Tailwinds build for Aluminium Paradoxically, aluminium was one of the worst performing base metals over the past month (22 May to 23 June 2023) despite the bauxite ore ban potentially tightening the market. In 2022, Indonesia produced some 21 million tonnes of bauxite, according to data from the US Geological Survey, making it the world’s fifth-largest producer. Almost 85 percent was exported overseas. According to data from the International Aluminium Institute, global production of primary aluminium registered a slight increase of 0.2% month-on-month in May 2023. The information portal Shanghai Metals Markets has reported that aluminium producers in the Yunnan region in China have been permitted since 17 June to ramp their operations up again after having been forced to scale them back since last autumn because electricity was rationed due to
drought. However, the ongoing heatwaves in many parts of China may drive production halts back again.
Aluminium futures inventory is 21% lower than 3 months ago, mainly as a result of Shanghai Futures Exchange inventory declining over that time window.
This material is prepared by WisdomTree and its affiliates and is not intended to be relied upon as a forecast, research or investment advice, and is not a recommendation, offer or solicitation to buy or sell any securities or to adopt any investment strategy. The opinions expressed are as of the date of production and may change as subsequent conditions vary. The information and opinions contained in this material are derived from proprietary and non-proprietary sources. As such, no warranty of accuracy or reliability is given and no responsibility arising in any other way for errors and omissions (including responsibility to any person by reason of negligence) is accepted by WisdomTree, nor any affiliate, nor any of their officers, employees or agents. Reliance upon information in this material is at the sole discretion of the reader. Past performance is not a reliable indicator of future performance.