The Power of RSI: Bullish and Bearish DivergencesGuys, on the chart, price moves down while RSI moves up.
That’s called a “bullish divergence” — price is falling but the indicator shows recovery.
It usually means the downtrend is losing strength.
On the other hand, if price moves up while RSI moves down, that’s a “bearish divergence.”
It means price is rising but momentum no longer supports the move.
Usually, it signals that the uptrend is weakening and a correction might be near.
Guys, as you can see on the chart, while the price
In-depth trading ideas
High Yields And A Strong USD Continue To Pressure GOLDIn this Weekly Market Forecast, we will analyze Gold for the week of Sep 28 - Oct 2nd.
Gold is currently facing a short-term bearish bias due to surging U.S. Treasury yields, a stronger U.S. dollar, and hawkish Federal Reserve rate expectations.
Markets are watching upcoming reports like JOLTS job openings, consumer confidence, ISM manufacturing PMI, and the September non-farm payrolls report for direction.
Enjoy!
May profits be upon you.
Leave any questions or comments in the comment section
Gold Futures: Deeper into the Target ZoneGold futures have recently moved deeper into our green Target Zone ($4,261–$4,046), approaching the 78.60% retracement. In our primary scenario, we expect a low within this price range. Subsequently, we anticipate rallies above the resistance at $4,917, where we project a significant corrective high within our red Target Zone ($4,988–$5,438). After that, prices should turn downwards again.
From Asia to London: Session Transitions TrainingGuys, in forex and gold markets there are three main sessions:
The Asian session often sets the initial bias of the day.
The London session increases volume and makes breakouts clearer.
The New York session usually brings the highest volatility.
During session transitions, price movements can accelerate.
Imagine you opened a trade right at the London session open.
At that moment, there’s usually a sharp move — it’s London announcing “I’m here.”
If you already have open positions
GOLD UPDATE: The Bears Dominate Monday Selloff!This is an update to the Sunday analysis posted yesterday, Sept 27th.
Gold prices faced an aggressive sell-off today because rising U.S. Treasury yields and a strengthening U.S. dollar significantly increased the opportunity cost of holding the non-yielding precious metal.
Enjoy!
May profits be upon you.
Leave any questions or comments in the comment section.
I appreciate any feedback from my viewers!
Like and/or subscribe if you want more accurate analysis.
Thank you so much!
Disclaimer:
I
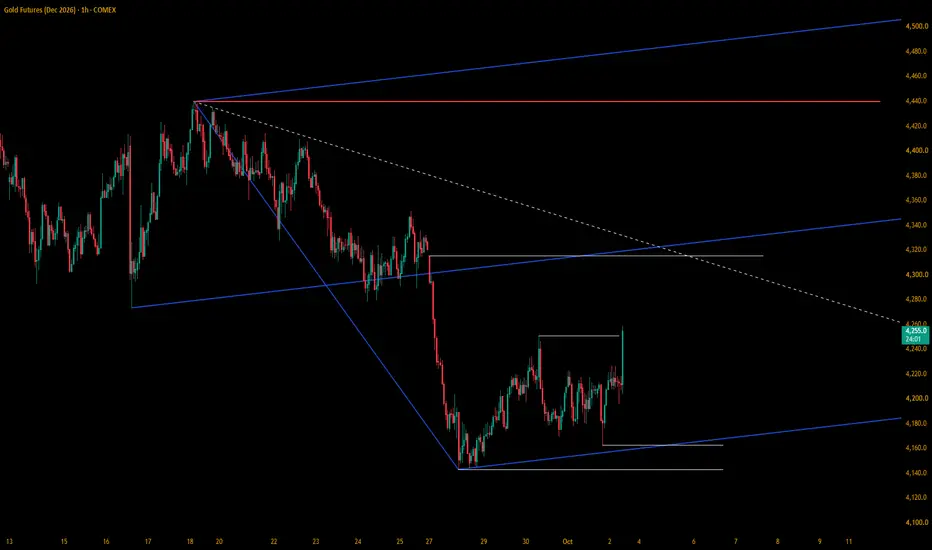
Gold (GC) Analysis, Key-Zones, Setup for Fri (Oct 2)Bias: The December gold contract settled Thursday at 4,202.3, up 15.6 points or 0.37 percent, after trading between 4,222.8 and 4,169.4, a 53.4 point daily range. The settle finished 61.6 percent of the way up from the low. Those extremes are the completed-session inputs behind the published pivot ladder, and they match the chart's daily bar. It was a third consecutive higher settle and the largest one-day gain since 09/25, while the range was 0.60 times the 14-day average daily range of 88.3 p
Gold ReversalTo me, the downside directional energy is exhausted and this market is ready to go up or for it to be viable to buy a pullback at support.
At the same time, I doubt it will reach the gap and drop back down.
At least now with this information I maintain a "bullish" outlook that "promises" to have chances of reaching the upper red line.
XAUUSD Gold Long TradePicked up 1 mini contract on gold with price pulling back into 1hr demand.
This is not the best level of demand but I'm going back on price pulling back into daily levels demand, also where banks added into longs previously, and also recent economic news regarding lower PCE, poor JOLTS job opening, and lower Consumer confidence numbers.
TP around the opposing level of 1hr/4hr/daily level of supply around $4,280.
If price happens to SL me out (which odds are it will because it's a 3:1 rewar
Gold (GC) Analysis, Key-Zones, Setup for Mon (Sep 28)Bias: December gold broke down at the Sunday reopen. The contract settled Friday at 4,321.2, up 0.54 percent, after a 4,351.6 to 4,289.2 session, opened Sunday at 4,315.0 and was quoted at 4,244.8, down 76.4 points or 1.77 percent, at 09:51 PM ET, after a low of 4,239.3. The 30-minute series captured at 10:01 PM ET shows the first four Sunday bars holding above Friday's 4,289.2 low, then the three bars from 08:00 PM to 09:30 PM ET breaking through that low, the 09/16 one-month low at 4,273.3, P
Gold (GC) Analysis, Key-Zones, Setup for Fri (Sep 25)Bias: December gold settled Thursday at 4,298.0, down 20.4 points or 0.47 percent, the fourth consecutive lower settle and the lowest since 08/04/26. The completed session ran 4,338.0 to 4,278.3, a 59.7 point band, and the settle finished at 33.0 percent of that range. Those extremes are the completed-session inputs behind the published pivot ladder rather than an independently read bar, and they reconcile with the provider's own published daily record. The bar made a lower high and a lower low
Gold- Aggressive Market Orders & The WickBull Icon 1: Aggressive Market Orders & The Wick
Structurally, this is a classic VSA "Stopping Volume" or "Demand Entering" candle.
The Mechanics: The long lower wick proves that as sellers pushed the price down, a massive cluster of aggressive market buy orders entered at the lows.
The Result: They aggressively consumed all available sell limits and forced the price to close significantly higher than its low, leaving behind that prominent wick. This represents true, proactive institut
Gold (GC) Analysis, Key-Zones, Setup for Thu (Sep 24)Bias: The December gold contract settled Wednesday at 4,318.4, down 58.0 points or 1.33 percent, the lowest settle since 08/06/26 and the third consecutive lower close. The completed session ran 4,407.5 to 4,310.7, a 96.8 point band, and the settle finished at 8.0 percent of that range, 7.7 points above the low. Those extremes are the completed-session inputs behind the published pivot ladder rather than an independently read bar, and they reconcile with the provider's own published daily recor
GOLD FUTURES ANALYSIS 9/25/26Gold has rebounded from support circa 4,275–4,295 to meet resistance at 4,330–4,340. The short-term bounce is credible, but the 1H and 4H charts still show lower highs. The main question is whether price can close above resistance on the 30 minute chart and then hold that area on a pullback. If, instead, it breaks briefly above resistance and returns below 4,320, the bounce may have trapped late buyers.
Market structure
The move from roughly 4,302 to 4,330 improved short-term momentum. Buyin
GoldGold prices eased to around $4,330 an ounce on Tuesday, extending losses from the previous session as hawkish comments from Federal Reserve officials reinforced expectations that US interest rates will remain higher for longer. The US central bank raised its policy rate by 25 basis points last week, marking its first such move in three years, while Chair Kevin Warsh signaled that further rate increases could
GOLD — STILL STUCK IN THE RANGENew day, same question:
Is Gold preparing to continue higher, or does it need to sweep the lows first?
Right now price is still stuck in consolidation around the monthly POC near 4384–4390.
We had an attempt toward the previous daily high during the pre-Asian session, but price stalled before reaching it.
That tells me buyers have not fully taken control yet.
But it also doesn't automatically mean sellers are in control.
For now, this is still a balanced market.
🔵 THE BULLISH SCENARIO
Ba
GoldGold prices edged lower toward $4,350 on Monday, pressured by a stronger US dollar and profit-taking after last week’s rally, while investors continued to monitor developments in the Middle East. Bullion reached its highest level in more than a week on Friday as falling oil prices eased concerns over prolonged inflationary pressures. Oil prices extended their decline at the start of the week as investors
Gold Holds Firm as US Dollar Momentum Starts to FadeGold has retraced for a fourth week, with a small bullish hammer respecting the 50-week EMA and weekly VOPC showing demand around 4300. It also suggests bears are losing steam, given bearish volatility is waning. Note the bullish engulfing candle on the daily around the 50-day EMA.
Prices are now consolidating around the upper half of last week’s range. The near-term bias is to seek dips within last week’s range while prices hold above last week’s low, with 4500 and 5600 being possible upside