How Far Is Far? From Price Distance to Standardized RSISuppose someone tells you:
The current price is 30% above its 200-day moving average.
The statement sounds informative because it gives both a reference point and a distance. But it still leaves out the part that matters most: is 30% a normal displacement for this market, or an extreme one?
Raw distance tells us where price is relative to an average, but not how large that displacement is relative to the normal movement of the series. To make the number comparable, distance needs a reference scale.
---
This idea begins with the familiar Bollinger Band framework, then uses RSI Chart Overlay to make the same measurement problem visible on price. From there, we can see why a bounded RSI scale needs a different coordinate system before different lookback lengths can be compared.
---
1. Giving distance a unit
One of the most familiar ways to give distance a scale is Bollinger Bands.
Let's start with a 20-bar moving average and bands two standard deviations above and below it. Instead of saying only that price is a certain number of dollars or percent away from the average, we can express the displacement in standard-deviation units:
z = (Price - Average) / Standard Deviation
Now the distance is dimensionless.
A reading of +1 means that price is one standard deviation above its average. A reading of +2 means two standard deviations above it.
On a conventional 20-bar chart, this feels natural because the center, the scale and the outer reference levels all behave in a familiar way.
That is why the z-score is such an attractive answer to the original question. It appears to turn raw distance into a common unit of extension.
I used this public Rolling Z-score script.
---
2. What happens at a very short lookback?
After going from 20 days to 5 days, the picture changes immediately. The standardized series remains crowded inside the ±2 reference lines, even though price is moving aggressively over the short window.
The supposedly common unit of extension is clearly behaving differently from the 20-bar example.
That is the important observation:
We changed the lookback, but the supposed common unit of extension stopped behaving in a visually comparable way.
A z-score still gives distance a unit, yet the result is not independent of the geometry created by the window used to calculate it.
---
3. The common workaround
A practical response is simply to avoid very short lookbacks. Many indicators impose a minimum input, and many traders naturally gravitate toward lengths where the familiar band structure looks more stable.
That can be perfectly reasonable as a usage rule, but it is still a workaround.
---
4. RSI makes the same problem more obvious
Price-based rolling z-scores already become awkward at short lookbacks. RSI sharpens the issue because its raw coordinate has hard bounds: it cannot move above 100 or below 0.
This is where RSI Chart Overlay becomes useful as an explanatory tool. In the AdaptiveRSI representation, RSI describes normalized price position relative to the Wilder moving average of the same length. The key relationship is simple: RSI 50 corresponds to price at Wilder EMA(n).
This lets us treat RSI not only as an oscillator pane, but as a coordinate system that can be translated back into price.
RSI Chart Overlay projects chosen RSI coordinates back onto the price chart. RSI 50 becomes the middle line. A selected RSI level above 50 becomes a price band above it, and a selected value below 50 becomes a corresponding band below it. We do not need the full RSI derivation here; we only need this mapping so that the geometry of the RSI scale can be seen directly on price.
---
5. Equal standardized steps do not occupy equal price space
Now take RSI(14), but instead of starting with familiar raw levels such as 70 and 30, start with equal positions on a standardized scale.
z = 0 → RSI 50.00
z = +1 → RSI 63.52
z = +2 → RSI 75.20
The negative side is symmetric around 50.
We can already see that the distance from 0 to +1 is larger than the distance from +1 to +2.
RSI Chart Overlay is not creating that compression. It is exposing it. The Overlay projects raw RSI coordinates onto price, and those raw RSI coordinates are already getting closer together as standardized position moves farther from the center.
The supporting formula is:
Price offset = (RSI - 50) / 50 × CC volatility × (n - 1)
Full overlay formulas: Projecting RSI Levels Directly onto Price
The formula matters only because it confirms what the chart already shows:
when the gaps between raw RSI coordinates shrink, their projected gaps on price shrink with them.
---
6. The same compression is visible on the 0–100 scale
The price chart is showing the same geometry that exists inside RSI itself. For RSI(14), the equal standardized steps map to:
z = 0 → RSI 50.00
z = +1 → RSI 63.52
z = +2 → RSI 75.20
z = +3 → RSI 84.08
The standardized increments are identical, but the raw RSI increments are not. The move from 50.00 to 63.52 uses 13.52 RSI points. The next move, from 63.52 to 75.20, uses 11.68 points. The move from 75.20 to 84.08 uses only 8.88.
This is the tail-compression problem in its simplest form. The closer RSI gets to 100, the less raw coordinate space remains for the next equal standardized move. The same happens toward 0. A bounded scale therefore gives progressively less visual resolution to increasingly extreme standardized positions.
---
7. RSI(2) makes the problem obvious
RSI(2) is the useful stress test because a very short RSI spends much more time near the boundaries. Use the same market and the same period in two aligned panes.
The difference is not that one pane contains more market information than the other. They represent the same underlying RSI observations. The difference is that the raw pane compresses increasingly extreme values into the last few RSI points before 0 or 100, while the standardized Logit RSI pane gives those tail observations additional room.
That distinction matters at very short lengths. A common workaround for awkward short-lookback behavior is simply to avoid very short n. Standardized Logit RSI is designed to remove the bounded-scale problem instead, so RSI(2) can remain on a usable standardized axis rather than being excluded by construction.
Logit RSI script:
---
8. Why raw RSI 70 is not universal
The bounded scale is only one part of the problem. Lookback length changes the meaning of a raw RSI value as well.
The same standardized position maps to very different raw RSI values at different lengths, and the same raw RSI value maps to very different standardized positions. RSI 70 is therefore a coordinate on the 0–100 scale, not a universal measure of extremity.
---
9. Two transformations, two jobs
The complete transformation from raw RSI to Logit RSI has two separate jobs:
Logit transform addresses the hard 0/100 bounds.
The theoretical scale then addresses lookback dependence.
That is all we need from the mathematics at this stage. Logit opens the bounded coordinate system. The length scaling puts different RSI lengths onto a common standardized axis.
RSI 0–100
→ Logit
→ unbounded coordinate
→ length scaling
→ standardized z
Different RSI lengths still represent different horizons and will not produce identical paths or signals. Standardization makes their positions comparable; it does not make the underlying series the same.
---
10. Define zones in standardized space first
Once RSI is expressed on a common standardized axis, reference regions can be defined in z-space first and then translated back to the raw RSI scale for the selected lookback length.
The current AdaptiveRSI framework uses:
|z| ≤ 0.66 → Body / consolidation
0.66 < |z| ≤ 1.00 → Support / resistance region
1.00 < |z| ≤ sqrt(3) → Trend region
sqrt(3) < |z| ≤ 2.14 → Overbought / oversold stretch
|z| > 2.14 → Tails
Full math: RSI Beyond 70/30: Position, Structure, and Adaptive Zones
This also makes it possible to compare different RSI lengths on the same standardized basis.
---
11. From fixed levels to a common measure of position
The practical consequence is that raw RSI levels should not be treated as universal units of extension. A reading such as RSI 70 tells us where the oscillator is on its 0–100 scale, but its standardized position depends strongly on lookback length.
The price projection makes the geometry visible. Equal steps in standardized space become progressively narrower when translated back to raw RSI and then projected onto price. Logit removes that bounded-scale compression, while the 2 / sqrt(n - 1) scaling provides a common length-aware coordinate system.
The main takeaway is that RSI can be treated as a standardized measure of position around its Wilder EMA equilibrium. The underlying information does not change. The coordinate system used to measure it does.
Related tools:
RSI Chart Overlay
Logit RSI
RSI Adaptive Zones
RSI Tutorials:
Projecting RSI Levels Directly onto Price
RSI Beyond 70/30: Position, Structure, and Adaptive Zones
© AdaptiveRSI
In-depth trading ideas
From Asia to London: Session Transitions TrainingGuys, in forex and gold markets there are three main sessions:
The Asian session often sets the initial bias of the day.
The London session increases volume and makes breakouts clearer.
The New York session usually brings the highest volatility.
During session transitions, price movements can accelerate.
Imagine you opened a trade right at the London session open.
At that moment, there’s usually a sharp move — it’s London announcing “I’m here.”
If you already have open positions, be careful not to get caught by the opposite move.
During the opening minutes, it’s best to observe carefully and wait for direction to settle.
That’s why knowing which session you’re trading in is crucial.
I provide these trainings completely free for you, my dear friends.
I sincerely thank all my friends who support me with their likes.📊🫡
Gold Shines: Safe-Haven Rebound Defies Aggressive Fed Rate HikesIn this Weekly Market Forecast, we will analyze Gold for the week of Sep 21 - 25th.
Gold is leaning bullish this week, demonstrating impressive resilience. Despite the Federal Reserve’s hawkish interest rate hike to a 3.75%–4.00% range, the precious metal successfully rebounded to finish last week strong at $4,414.50 per ounce.
Enjoy!
May profits be upon you.
Leave any questions or comments in the comment section.
I appreciate any feedback from my viewers!
Like and/or subscribe if you want more accurate analysis.
Thank you so much!
Disclaimer:
I do not provide personal investment advice and I am not a qualified licensed investment advisor.
All information found here, including any ideas, opinions, views, predictions, forecasts, commentaries, suggestions, expressed or implied herein, are for informational, entertainment or educational purposes only and should not be construed as personal investment advice. While the information provided is believed to be accurate, it may include errors or inaccuracies.
I will not and cannot be held liable for any actions you take as a result of anything you read here.
Conduct your own due diligence, or consult a licensed financial advisor or broker before making any and all investment decisions. Any investments, trades, speculations, or decisions made on the basis of any information found on this channel, expressed or implied herein, are committed at your own risk, financial or otherwise.
I Looked At The GOLD Chart For Next Week... It’s Insane.In this upcoming week's gold weekly analysis, we break down the critical institutional order flow shifts on XAUUSD that most retail traders completely miss. If you want to know where smart money is moving their capital next week, this gold trading strategy video reveals the exact liquidity pools and footprint chart imbalances you need to watch.At Flow Trading Academy, we don't guess—we follow the data. We dive deep into XAUUSD technical analysis, looking at the invisible order flow dynamics, buyer/seller absorption patterns, and market structure shifts that signal major price reversals before they happen. Whether you are looking for a reliable gold breakout strategy or trying to avoid the classic retail liquidity traps, this video gives you an institutional edge.
GOLD — THE FED GAVE US THE MOVE… NOW WHAT?We've been sitting in consolidation for most of the week waiting for the Fed.
Well... we finally got the catalyst.
The Fed raised rates by 25bps today, bringing the target range to 3.75%–4.00%, while also signaling that inflation remains elevated and that additional tightening could still be on the table.
And Gold initially reacted exactly how you'd expect.
Straight down.
But here's where I'm getting interested.
That selloff pushed price directly into the area I've been waiting for.
The H4 FVG was largely filled, and price also swept the lows.
Now I'm watching to see what happens after the liquidity grab.
Because at this point, I don't necessarily want to chase the downside.
I want to see if sellers can actually hold the lower prices.
🔵 THE BULLISH IDEA
The level I'm watching now is the Previous Weekly Low around 4,339.7.
Price is currently below it.
So I'm not calling a long simply because we swept the lows.
I want to see price reclaim that level.
If we push back above the Previous Weekly Low, then I want to see whether we can retest it from above and hold.
Something like:
Sweep the lows → FVG fill → buyers step in → reclaim PWL → successful retest → continuation.
THAT is the setup I'm interested in.
If that happens, the Fed reaction could end up being the liquidity event that gave buyers the opportunity to step back in.
🔴 BUT I'M NOT GOING TO FORCE THE BULLISH STORY
This is the part that's important.
The Fed just delivered a hawkish catalyst, and the initial reaction was bearish for Gold.
So if price cannot reclaim the Previous Weekly Low, I'm not going to sit here saying:
"Well... they swept the lows, so it has to go up."
Nope.
If sellers continue accepting price below that level, then the sweep wasn't necessarily a reversal.
It may simply have been the beginning of another leg lower.
And that's when I'm looking for the next area where Gold may want to react.
📊 WHAT I'M WATCHING IN ORDER FLOW
This is where the DOM/order flow becomes important for me.
I want to see whether the aggressive selling we're getting after the Fed actually produces continued downside acceptance.
If sellers keep hitting the market but price stops making meaningful progress lower...
That's interesting.
If buyers begin absorbing that selling...
Even more interesting.
Then we reclaim the Previous Weekly Low?
Now we've got something I can actually work with.
I'm not trying to predict the reversal.
I'm waiting for the market to prove it.
🎯 MY PLAN
Bullish scenario:
🔹 H4 FVG gets filled
🔹 Lows get swept
🔹 Selling pressure begins to dry up
🔹 Buyers take control
🔹 Price reclaims ~4,339.7
🔹 Retest holds
🔹 Look for continuation higher
Bearish scenario:
🔻 Price remains below the Previous Weekly Low
🔻 Sellers continue accepting lower prices
🔻 Reclaim attempt fails
🔻 No reason for me to force a long
🔻 Wait for the next major level/FVG
The key for me is 4,339.7.
I don't need to catch the exact bottom.
I'd rather miss the first 30–50 points and get confirmation that buyers have actually taken control than try to call the bottom and get run over if sellers aren't finished.
The news created the volatility.
Now I'm watching price tell me what that volatility actually means.
Let it show its hand.
#Gold #MGC #GC #GoldFutures #FuturesTrading #OrderFlow #PriceAction #VolumeProfile #MarketStructure #TradingView #DayTrading #Futures #COMEX #GoldTrading
GOLD WEEK AHEAD — SETUP IS THERE, NOW WE WAITNew week. New levels. And after adding IV Rank into my view, I'm starting to see another layer of information that I think can help with timing these moves.
Looking at how Gold closed last week, I'm coming into this week with a bullish lean.
Price finished the week strong and is currently sitting just above a 1H Bullish FVG.
Now I'm watching to see whether Gold wants to come back down and fill that imbalance before the Killzone window opens.
That's where things get interesting.
🔵 THE LEVEL I'M WATCHING
The biggest level for me right now is around 4390.
That's the POC for the previous month, so I'm treating it as an important area of acceptance/rejection.
If price pulls into the 1H FVG and we can hold around that 4390 area, I want to see how buyers respond.
My ideal sequence would look something like:
1H FVG fill → 4390 holds → sellers lose momentum → buyers step in → reclaim/hold higher → continuation.
That's the setup I'm interested in.
I'm not trying to buy simply because price touches the FVG.
I want to see the reaction.
📊 IV RANK HAS MY ATTENTION
This is one of the newer things I've added to my charting process.
The Gold Volatility Index / IV Rank is giving me another piece of information about the current volatility environment.
And after watching how it behaved around last week's move, I'm interested in seeing whether that volatility backdrop continues to support expansion this week.
But I'm keeping this distinction clear:
IV Rank doesn't tell me which direction price has to go.
It helps give me context.
Price still has to confirm the direction.
That's why I'm combining it with my FVG, volume profile, POC, order flow and Killzone structure.
🔴 WHAT WOULD CHANGE MY MIND?
If Gold comes down through the 1H FVG and breaks below 4390, I'm not going to keep trying to force the bullish idea.
That's my cue to step back.
If we lose that monthly POC and sellers begin accepting price below it, then I need to let the market show me where it actually wants to go.
There are lower levels and larger areas of interest beneath us.
I don't need to predict which one gets hit.
I'll wait for price to get there and react.
🎯 THE PLAN
Right now I'm watching two scenarios.
🟢 BULLISH
Price fills the 1H FVG.
4390 holds.
Sellers fail to continue lower.
Buyers take control.
Then I want to see price start pushing back toward the upper levels, with the previous weekly high around 4439 and the overhead H4 bearish FVG becoming areas I'll be watching for reaction.
🔴 BEARISH / HANDS OFF
Price breaks through the FVG.
4390 fails.
Sellers accept below the monthly POC.
I'm out of the way.
No forcing a long.
No trying to catch a falling knife.
Just wait for the next meaningful level.
👀 THIS IS THE PART I'M REALLY WATCHING
The setup isn't:
"Gold is bullish, so I'm buying."
It's:
"Gold is positioned for expansion. Here's my level. Now show me whether buyers are willing to defend it."
That's a much better trade.
The FVG gives me the location.
The Monthly POC gives me the line in the sand.
IV Rank gives me volatility context.
The Killzone gives me my timing.
And order flow tells me whether buyers are actually taking control.
That's the edge I'm trying to build.
Don't predict the move.
Build the conditions.
Then let price confirm it.
Let's see what Gold gives us this week. 👊🏾
#Gold #MGC #GC #GoldFutures #FuturesTrading #OrderFlow #PriceAction #FVG #VolumeProfile #IVRank #Volatility #TradingView #MarketStructure #DayTrading #FuturesTrader #GoldTrading
Gold Holds Firm as US Dollar Momentum Starts to FadeGold has retraced for a fourth week, with a small bullish hammer respecting the 50-week EMA and weekly VOPC showing demand around 4300. It also suggests bears are losing steam, given bearish volatility is waning. Note the bullish engulfing candle on the daily around the 50-day EMA.
Prices are now consolidating around the upper half of last week’s range. The near-term bias is to seek dips within last week’s range while prices hold above last week’s low, with 4500 and 5600 being possible upside targets.
But one thing that has really caught my attention is how gold has remained supported despite the strength of the US dollar index. Given bullish momentum is waning on DXY, even a minor pullback on the dollar could benefit gold over the near term. A break beneath last week’s low invalidates my near-term bullish bias, or a sudden spike of bearish volatility could serve as an early warning sentiment has changed.
MS
When Trends Disagree, Timing Matters More Than DirectionThe trend is not one thing
One of the most common questions in technical analysis is also one of the most incomplete: “What is the trend?”
The problem is that a market rarely has just one trend. A market can be advancing on a monthly chart, declining on a weekly chart, and changing direction again on a daily chart—all at the same time.
That is not necessarily a contradiction. It is the normal consequence of observing the same market through different time horizons.
A more useful question is: what job should each timeframe perform in the decision process?
The current Gold futures chart provides a useful case study. We are looking at GC on a daily chart while calculating the Supertrend indicator independently from monthly, weekly, and daily data. Supertrend uses volatility, typically through Average True Range, to establish a trailing trend threshold that changes sides when the underlying trend condition changes.
As captured on the chart, the three timeframes are telling three different stories.
The monthly Supertrend remains up. The weekly Supertrend is down. And the daily Supertrend, which was previously up, has just turned down.
Instead of trying to decide which one is “correct,” we can give each timeframe a different role.
Give each timeframe a job
A practical multiple-timeframe framework separates context from timing.
The higher timeframe can tell us about the larger environment. The intermediate timeframe can show whether there is pressure developing within that environment. The shorter timeframe can then provide the timing condition used to evaluate a particular scenario.
Applied to this Gold case study:
The monthly Supertrend provides the broader context: up.
The weekly Supertrend provides intermediate directional pressure: down.
The daily Supertrend provides the newest timing information: it has just turned down.
That combination is more informative than simply labeling Gold bullish or bearish.
The fresh daily downside condition is aligned with the weekly trend, which strengthens the case for examining a downside scenario. But both are operating against a monthly trend that remains up.
That higher-timeframe disagreement matters.
It does not necessarily invalidate a short-term downside scenario. Instead, it can influence how much should reasonably be expected from that scenario.
Direction and expectation are different decisions
This distinction is important.
A trader may identify a valid directional opportunity without expecting a very large move.
When the daily and weekly trends point down while the monthly trend remains up, there are at least two competing forces in the analysis. Shorter-term momentum may carry price lower, while the larger trend creates a reason to be less ambitious about how far that decline might extend.
This is why multiple-timeframe analysis can be useful for more than deciding direction.
It can also help calibrate expectations.
If all three Supertrends were pointing down, a trader might evaluate whether there was room for a more extended downside movement. With the monthly Supertrend still pointing up, a nearer technical objective may be more appropriate for an illustrative scenario.
In other words, the higher timeframe does not always have to determine the trade direction. Sometimes its most valuable role is determining how aggressively—or conservatively—the shorter-timeframe opportunity should be managed.
A trend signal still needs a location
There is another important limitation to address.
A Supertrend change tells us something about direction and timing, but it does not automatically tell us that the current price is a meaningful entry location.
That is why the chart introduces a second condition.
Below the current market sits a minor UFO support area around 4,281.2. Instead of treating the new daily downside Supertrend as sufficient by itself, the illustrative scenario waits for price to break below this UFO support.
This creates a conditional entry near 4,281.2.
The distinction is subtle but important. The trend signal says that conditions have changed. The support break would provide additional evidence that price is actually moving through a level where buyers had previously been able to respond.
Until that happens, there is no entry in this case study.
This helps separate a setup from a trade.
Let market structure define the target
The next relevant support identified on the chart sits around 4,115.2.
That creates a potential target approximately 166 points below the illustrative 4,281.2 entry.
Why stop there rather than assume that a new daily downtrend must produce a much larger decline?
Because the monthly Supertrend is still pointing up.
The target therefore reflects both sides of the analysis. The daily and weekly conditions provide the rationale for examining the downside, while the monthly condition argues against assuming that the downside must become a major longer-term reversal.
This is a reusable principle: higher-timeframe disagreement can be incorporated into target selection rather than treated as a reason to abandon shorter-term analysis altogether.
Using Point of Control to define invalidation
A target answers only half of the risk-management question. We also need to know what would make the scenario no longer acceptable.
For that purpose, the chart uses Point of Control, or POC.
In a volume profile, the POC represents the price at which the greatest amount of volume was transacted within the period being measured. It can therefore identify an area where the market previously demonstrated significant acceptance.
The current-month and prior-month POCs are both positioned above the proposed entry area.
For a downside scenario, that creates a useful structural reference.
Rather than placing a stop an arbitrary number of points above the entry, the illustrative stop is positioned beyond this POC structure, around 4,488.8.
The reasoning is not that price cannot trade through a POC. It can.
Instead, if price breaks the proposed support, activating the downside scenario, and subsequently moves back through the nearby high-volume acceptance area far enough to reach 4,488.8, the original downside thesis has materially weakened.
That makes the stop an invalidation level rather than merely a predetermined distance.
A coherent setup can still have an imperfect payoff
The proposed levels also reveal another useful lesson.
An entry around 4,281.2, stop around 4,488.8, and target around 4,115.2 create approximately 207.6 points of initial risk versus 166 points of potential movement toward the target.
That is roughly a 0.8-to-1 reward-to-risk relationship.
It would be easy to solve that problem cosmetically by selecting a much lower target. But doing so would undermine the logic of the analysis. The reason the target is relatively conservative is precisely because the monthly trend remains up.
This illustrates why a technically coherent setup and an attractive payoff profile are not automatically the same thing.
The analysis should determine meaningful levels first. Risk criteria can then determine whether the resulting scenario is suitable for a particular trading plan.
If a trading plan requires a higher reward-to-risk threshold, the appropriate response may simply be to pass on the scenario, wait for a different entry, or require additional confirmation. Moving technical levels merely to manufacture a preferred ratio reverses the analytical process.
Contract size changes the dollars, not the framework
The same Gold price analysis can be considered through several CME contract sizes.
GC represents 100 troy ounces of Gold. Micro Gold futures, MGC, represent 10 troy ounces, or one-tenth of GC. The 1-Ounce Gold futures contract, 1OZ, represents one troy ounce, or one-hundredth of GC. GC and MGC use a minimum price fluctuation of $0.10 per troy ounce, while 1OZ trades in $0.25 increments.
That scaling makes position size an important part of the case study.
Using the approximate 207.6-point distance between the illustrative entry and stop, the corresponding price risk before commissions, slippage, or gaps would be about $20,760 for one GC contract, $2,076 for one MGC contract, and approximately $207.60 for one 1OZ contract. Actual orders must, of course, conform to each contract's permitted tick increments.
The approximately 166-point distance from entry to target translates to about $16,600 for GC, $1,660 for MGC, and $166 for 1OZ.
These figures also demonstrate why margin and trade risk should never be confused.
The current margin amounts are approximately $22,000 for GC, $2,200 for MGC, and $220 for 1OZ. Margin requirements can change, and the amount required to establish or maintain a futures position is not a limit on how much that position can lose.
The stop distance, contract size, liquidity, possible gaps, and account-level risk limits remain separate considerations.
When trends disagree, ask better questions
Multiple timeframes do not need to agree before they become useful.
The monthly trend can define the broader context. The weekly trend can reveal intermediate pressure. The daily trend can provide timing. Support can determine whether the signal has reached a meaningful location. POC can help establish structural invalidation. And the relationship among those elements can determine whether expectations should be aggressive or conservative.
That leads to a more useful sequence than simply asking whether a market is bullish or bearish:
What is the larger context?
What has changed on the trading timeframe?
Has price reached or broken a meaningful level?
Where would the scenario become invalid?
How far is it reasonable to expect the move to travel given the higher-timeframe condition?
In this Gold example, the monthly, weekly, and daily Supertrends disagree—but that disagreement is exactly what makes the analysis educational.
Direction is only one part of the decision.
Timing, location, expectation, and risk determine what can actually be done with it.
Data Consideration
When charting futures, the data provided could be delayed. Traders working with the ticker symbols discussed in this idea may prefer to use CME Group real-time data plan on TradingView: www.tradingview.com - This consideration is particularly important for shorter-term traders, whereas it may be less critical for those focused on longer-term trading strategies.
General Disclaimer
The trade ideas presented herein are solely for illustrative purposes forming a part of a case study intended to demonstrate key principles in risk management within the context of the specific market scenarios discussed. These ideas are not to be interpreted as investment recommendations or financial advice. They do not endorse or promote any specific trading strategies, financial products, or services. The information provided is based on data believed to be reliable; however, its accuracy or completeness cannot be guaranteed. Trading in financial markets involves risks, including the potential loss of principal. Each individual should conduct their own research and consult with professional financial advisors before making any investment decisions. The author or publisher of this content bears no responsibility for any actions taken based on the information provided or for any resultant financial or other losses.
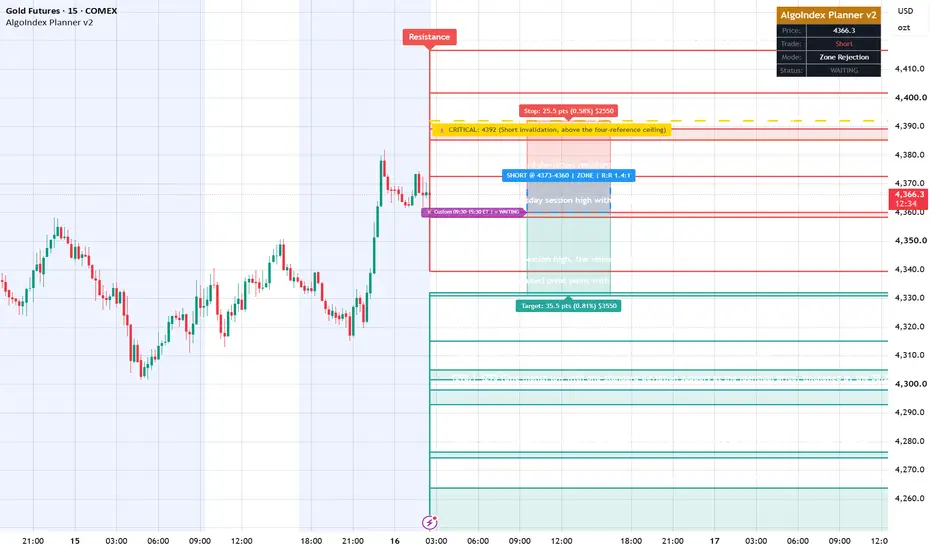
Gold (GC) Analysis, Key-Zones, Setup for Wed (Sep 16)Bias: December gold settled Tuesday at 4,332.8 after a compressed 56.6 point session between 4,358.3 and 4,301.7, finishing near the middle of that range, and the exchange-traded proxy closed up 0.24 percent on the day. Holding ground is itself the notable outcome, because it follows a five-day decline of 133.5 points or 2.99 percent and it happened while the dollar firmed and long-end yields pushed to multi-year highs. The metal is caught between two forces pulling hard in opposite directions. Against it sits the real-rate channel: benchmark 10-year Treasury yields topped 5 percent for the first time since 2007 and the dollar index rose 0.14 percent to sit just beneath Monday's one-and-a-half-week high. Gold pays no coupon, so a rising real yield raises the cost of holding it, and that is the mechanism behind a 100-day decline of 501.1 points or 10.38 percent. For it sits an unusually loaded backdrop: an active conflict involving Iran described in trade commentary as now in its seventh month, a crucial Saudi pipeline out of service for three to five weeks, Brent settling at 108.75 dollars after a 2.9 percent advance, and diesel settling at a record 5.2620 dollars a gallon. That the haven bid is not winning against those headlines is the most informative signal this market is giving. When gold cannot rally on a supply shock, a shooting conflict and record distillate prices, the marginal buyer is being priced out by the discount rate rather than drawn in by the risk. The structure sharpens the decision to a knife edge. The settle sits 0.8 points above the 50-day average at 4,332.0 and 1.9 points above the computed pivot at 4,330.9, so the contract enters Wednesday balanced on the only intermediate average it still holds, beneath every other one. The oscillator set is deeply extended, with the 14-day stochastic percent K at 10.10, but the 9-day directional index at 26.48 with the negative directional indicator dominant marks an established decline rather than a drift, and oversold readings in trending markets tend to become more oversold. Bias is lower while beneath 4,392, with rallies into 4,360 to 4,373 the preferred area to sell, though a 25 basis point increase is already roughly 92 percent priced and the 02:00 PM ET projections will set the real yield gold must compete against.
Resistance:
- 4,416.7 Pivot R3, the outer boundary of the computed ladder and the practical ceiling for any session that does not reverse the prevailing decline
- 4,401.8 3 Standard Deviation Resistance, a statistical extension boundary rather than a structural level
- 4,389.2 2 Standard Deviation Resistance, the top of a four-reference ceiling that also holds the 40-day average crossing at 4,387.8, Pivot R2 at 4,387.5 and the 50 percent retracement of the 13-week span at 4,385.3, four levels inside four points
- 4,372.6 1 Standard Deviation Resistance, the upper edge of the preferred entry band for the primary setup
- 4,360.1 Pivot R1, sitting 1.8 points above Tuesday's session high so the pair forms one decision band
- 4,358.3 Tuesday's session high, the level a recovery must clear to change the short-term sequence
- 4,339.5 the overnight session high, the immediate ceiling and first test of any early strength
Support:
- 4,332.0 the 50-day average, the last intermediate average gold still holds and only 0.8 points beneath the settle, whose loss on a closing basis leaves the contract under every average on the board
- 4,330.9 the computed Pivot Point, effectively coincident with that average, concentrating Wednesday's opening decision into a band barely two points wide
- 4,315.2 the overnight session low, the first marker beneath the pivot band
- 4,305.1 the computed downside objective from the same level set that produces the pivot ladder
- 4,303.5 Pivot S1, sitting inside a tight three-way shelf with the computed objective above it and Tuesday's low below it
- 4,301.7 Tuesday's session low, the line whose loss confirms continuation rather than consolidation
- 4,293.0 the one-month low with 1 Standard Deviation Support at the identical price, the most important support on the board because two independent methods land on the same number, thickened by the 38.2 percent retracement from the 13-week low at 4,298.1
- 4,274.3 Pivot S2, with 2 Standard Deviation Support at 4,276.4 immediately above it
- 4,246.9 Pivot S3, the outer boundary of the ladder, bracketed by 3 Standard Deviation Support at 4,263.8 and the 3-10 day average crossover reference at 4,244.0
Primary Setup: SHORT GC from the 4,360 to 4,373 zone on a rally into the band running from Pivot R1 at 4,360.1, just above Tuesday's session high, up to the 1 Standard Deviation Resistance at 4,372.6. Stop 4,392, above the four-reference ceiling at 4,385.3, 4,387.5, 4,387.8 and 4,389.2, so that a stop-out requires clearing the 50 percent retracement of the 13-week span, the second pivot, the 40-day average crossing and the two standard deviation band together rather than tagging any one of them. Targets at 4,331 first, taken inside the pivot band where the computed Pivot Point at 4,330.9 and the 50-day average at 4,332.0 sit barely two points apart, 4,304 second at the tight shelf holding the computed objective at 4,305.1, Pivot S1 at 4,303.5 and Tuesday's low at 4,301.7, and 4,293 third where the one-month low and 1 Standard Deviation Support fall on the identical price, taken only if momentum extends through the second target on expanding volume. From a 4,366.5 entry midpoint that is 25.50 points of risk against 35.50, 62.50 and 73.50 points of reward, roughly 1.4 to 1, 2.5 to 1 and 2.9 to 1. Half size is appropriate given that the interest rate decision, the rate statement and the Summary of Economic Projections all land at 02:00 PM ET with the press conference at 02:30 PM ET, and retail sales at 08:30 AM ET is forecast at 0.8 percent against a negative 0.6 percent prior. Pricing is likely to be disorderly between 02:00 PM and 02:45 PM ET, and government crude inventories at 10:30 AM ET feed the inflation-expectations channel earlier in the day. A sustained move above 4,392, and in particular an hourly close above 4,416.7, negates the thesis. The standing counter-argument is that a 14-day stochastic percent K of 10.10 is deeply extended and that this backdrop needs only one escalation to force a violent repricing from a market positioned for further weakness.
Wednesday is a decision session rather than a trend session for gold, and its sensitivity is second-order but sharp, because the metal trades the projected path of real rates rather than the rate decision itself. A 56.6 point Tuesday against a 14-day average daily range of 106.3 points leaves roughly half the normal daily distance unspent, and the release scheduled for 02:00 PM ET is what it will be spent on.
GOLD — THE SETUP FINALLY SHOWED ITS HANDYesterday I talked about waiting for Gold to come down into the H4 FVG, sweep the lows, and then show me whether buyers were actually going to step back in.
Well...
That's exactly what happened.
Price swept the lows, pushed into the area I was watching, and then buyers stepped in and started driving price higher.
I didn't try to catch the exact bottom.
I waited for the reaction.
And that patience paid off.
🔵 NOW WE HAVE A PULLBACK
Going into the NY session today, Gold started pulling back after the initial move higher.
Instead of chasing the move, I waited.
Price eventually came back down into the 1H FVG I had marked out.
That's where things got interesting.
At the same time, I'm watching GVZ and its IV Rank, which had moved into an area that, based on the way I use this tool, supported the potential for another strong move.
Now I had multiple pieces coming together:
Liquidity sweep ✅
H4 FVG reaction ✅
1H FVG pullback/fill ✅
GVZ/IV Rank confirmation ✅
Price reclaiming session value ✅
That's the type of confluence I'm looking for.
🎯 THE ENTRY
I took the long at:
4373.1
The important thing for me wasn't simply that price touched the FVG.
It was the reaction around the level.
I wanted to see buyers defend the area and price begin accepting back inside the session's value.
Once price moved back inside value, I was able to move my stop and take some risk off the table.
Now I'm simply letting the trade develop.
👀 WHAT I DON'T WANT TO DO
This is where trading can get dangerous.
Once you're in a trade and it's moving your way, it's very easy to start thinking:
"This thing is going to the moon."
😂
Nah.
I'm still watching the same thing I was watching before I entered:
Is price continuing to accept higher?
If buyers maintain control, I'll let it work.
If the market tells me that the move is losing momentum, I'll respect that too.
The setup doesn't become invalid just because I want the trade to keep going.
🧠 THIS IS WHY I WAIT
The original idea wasn't:
"Gold is going down into this FVG, so I'm buying it."
It was:
Let price come to the level → watch the reaction → confirm the buyers → then participate.
That's a completely different mindset.
The sweep gave me the location.
The FVG gave me the area.
Order flow and value helped me with the timing.
And once the market showed me buyers were willing to take control...
I got on the ride.
That's trading for me.
I don't need to predict the move.
I just need to be ready when the setup actually presents itself.
📈 CURRENTLY RIDING THE LONG FROM 4373.1
Now let's see what Gold wants to do.
Price showed its hand.
I just made sure I was paying attention. 👊🏾
#Gold #MGC #GC #GoldFutures #FuturesTrading #OrderFlow #PriceAction #FVG #LiquiditySweep #VolumeProfile #TradingView #DayTrading #FuturesTrader #MarketStructure #GoldTrading
**Gold: External Expansion Toward 1.414**
After reaching our POI, Gold delivered the expected bullish reaction.
During the move toward the POI, the market formed a key imbalance. This area now remains the main zone to watch for a possible short-term rebalance and support.
The current structure indicates that the asset is developing an external expansion. A temporary pullback into the key imbalance is still possible and would remain consistent with the bullish scenario.
As long as this area holds, my main target is the Fibonacci **1.414 level**, located near **4535**. This is where I plan to take 100% of the profit.
A decisive loss of the key imbalance would require a reassessment of the scenario.
**We trust Fibonacci.**
This is my personal market view, not financial advice.
Gold (GC) Analysis, Key-Zones, Setup for Fri (Sep 18)Bias: Gold settled Thursday at 4,399.7 on the December contract, up 12.2 points or 0.28 percent, and the settlement hides a genuine reversal session. December opened at 4,301.4, already 86.1 points or 1.96 percent beneath the prior settlement of 4,387.5, printed a low of 4,294.5 and a high of 4,423.3, 3.00 percent above that low, and settled at 4,399.7, 81.7 percent of the way up a 128.8 point range. A market that gaps two percent lower on a hawkish central bank and closes green has absorbed the news. The gap itself was mechanical: the Federal Reserve raised rates 25 basis points to 3.75 to 4.00 percent on Wednesday, the first increase since July 2023, unanimously, with projections showing twelve of eighteen officials expecting one further increase this year and no cut next year. Thursday's ten-year inflation-protected auction at 1:00 PM ET then cleared at a 2.653 percent high yield against 2.438 percent previously, a direct and measurable rise in the opportunity cost of holding a non-yielding asset. The dollar index sat near 100.238 in evening trade after the 04:00 PM ET equity close, easing 0.10 percent but holding nearly all of its post-decision gains after setting a fresh one-and-a-half month high. What the recovery could not do is clear resistance: the advance stalled at 4,423.3 and settled 10.4 points beneath the 100-day average at 4,410.1, having pierced it intraday without holding it. Structurally the metal is a completed downtrend searching for a base at a neutral reading, trading 23.90 percent below its 52-week high of 5,781.8, beneath its 20-day, 100-day and 200-day averages but above its 5-day and 50-day, with a 14-day directional index of just 16.66 and positive direction 15.98 against negative direction 17.16, which is an absence of trend rather than a downtrend. The multi-indicator composite reads 16 percent sell at minimum strength with its trend component on hold, matching the readings on both equity index contracts. The 14-day stochastic %K at 32.00 percent sits in the lower part of its range. Bias is lower while 4,450 caps the bounce, with the 4,410 area the decision line, and the 9:15 AM ET data window the session's first identifiable catalyst, with Federal Reserve commentary carried on the news-feed calendar at 9:30 AM ET and unconfirmed against a primary source following it.
Resistance:
- 4,755.0 13-week and 1-month high, the lower high that defines the current swing sequence
- 4,579.3 Pivot R3, extended mechanical objective beyond one and a half average ranges
- 4,501.3 Pivot R2, converging with the 20-day average within 11.3 points
- 4,490.0 20-day moving average, first level whose recovery changes the structural read
- 4,450.5 Pivot R1, invalidation reference for the primary setup
- 4,423.3 session high, upper edge of the supply band
- 4,410.1 100-day moving average, nearest resistance of any kind and the decision line
Support:
- 4,387.5 prior settlement, the level the reopened session is trading beneath
- 4,372.5 Pivot Point, converging with the 5-day average at 4,371.1 within 1.4 points
- 4,342.0 50-day moving average
- 4,321.7 Pivot S1, second objective of the primary setup
- 4,294.5 session low, 6.9 points beneath a two percent gap-down open, with the settlement 105.2 points above it
- 4,273.3 1-month low, 21.2 points beneath Thursday's low, the pair forming base evidence
- 4,243.7 Pivot S2, first mechanical objective beneath the one-month low
- 4,192.9 Pivot S3, deepest level with mechanical basis for the session
Primary Setup: SHORT GC from the 4,410 to 4,425 supply band on a retest of the area where Thursday's recovery stalled, with the thesis resting on a bounce that reached the 100-day average and the session high without settling above either while the real-rate direction moved decisively against the metal. Stop 4,455, placed above Pivot R1 at 4,450.5, since a settlement through that level would mean the reversal bar is extending rather than stalling. Targets at 4,372 first, where the Pivot Point and the 5-day average converge within 1.4 points, 4,322 second at Pivot S1, and 4,295 third at Thursday's session low if momentum extends through the second target. The 14-day average true range is 105.2 points, or 2.39 percent of settlement, and the position carries half the normal allocation given a counter-trend entry ahead of a tentatively timed overnight central bank decision and a September quarterly expiration session, carried in the options positioning data rather than a verified calendar and unconfirmed, whose dollar flows can move the metal without conveying direction. The entry band sits above the settlement, so the setup requires strength before it activates rather than weakness. Pricing is likely to be disorderly around the 9:15 AM ET industrial production release and the Federal Reserve commentary from Bowman and Schmid carried on the news-feed calendar at 9:30 AM ET and 11:45 AM ET, both unconfirmed against a primary source. Gold settles at 1:30 PM ET, so the metal's session is decided ahead of the equity close. A decisive settlement above 4,450.5 negates the short case and puts the 20-day average at 4,490.0 and Pivot R2 at 4,501.3 in play. The overnight Bank of Japan decision, carried on the news-feed calendar at 11:30 PM ET on a tentative statement time and unconfirmed against a primary source, matters more to this metal than it appears, since a second major central bank tightening in the same week reinforces the global real-rate direction that has driven gold 23.90 percent below its 52-week high.
Friday is a decision session rather than a trend session for gold, and the decision is whether Thursday's reversal extends or stalls. The 14-day average true range is 105.2 points, or 2.39 percent of the settlement, and Thursday's 128.8 point range exceeded that average by 23.6 points. A one average-true-range day from the settlement spans 4,294.5 to 4,504.9, which puts Thursday's session low almost exactly on the lower bound and shows how much of a normal day's distance the recovery has already consumed.
Gold (GC) Analysis, Key-Zones, Setup for Mon (Sep 21)Bias: December gold settled Friday at 4,424.9, up 25.2 on the session. That is a gain of 0.57 percent from Thursday's 4,399.7 close, but the shape of the day matters more than the size of the gain. The contract opened at 4,381.6, which was 18.1 beneath the prior settlement, traded down to 4,372.2, then recovered the entire deficit and closed at 4,424.9, a gain of 43.3 from its own open and 78.0 percent of the way up the session range measured from the low. A gap-down open that closes in the upper part of the session range is a reversal signature, and the documented facts are the 43.3 point open-to-close rise and the 78.0 percent closing position. The one United States activity release captured for the session, industrial production at 09:15 AM ET, printed 0.0 percent against a 0.3 percent forecast, with capacity utilisation at 76.3 percent against 76.4 percent expected, which is supportive for gold at the margin. The complication is the yield side, where the captured market wrap headline described ten-year yields rising during the session, with no level or quote time captured, raising the opportunity cost of holding a non-yielding asset. The policy backdrop remains restrictive: the central bank projections published Wednesday show twelve of eighteen officials expecting one further 25 basis point increase this year. The medium-term picture is still damaged. Price sits 23.47 percent beneath its 52-week high of 5,781.8, it is down 3.20 percent over twenty sessions, and it remains 67.2 beneath the 20-day average of 4,492.1 and 223.7 beneath the 200-day average of 4,648.6, with a multi-indicator composite reading just 32 percent buy at weak strength, though its direction is rated strengthening. What argues the other way is momentum: the stochastic percent K sits above percent D on both the 9-day and 14-day horizons, at 52.73 against 37.58 and 36.85 against 25.09, and price closed 12.6 above its own pivot point of 4,412.3 and back above both the 50-day average of 4,342.8 and the 100-day average of 4,410.5. The trend framework says neither side owns this market, with a 14-day directional index of 16.42 and the two directional components separated by five hundredths of a point. Bias is constructive on a pullback into the 4,397 to 4,385 grouping, and this is a levels market rather than a trend market. Two days of headline exposure separate Friday's settlement from the Sunday reopen at 06:00 PM ET, including a Chinese loan prime rate decision at 09:00 PM ET Saturday, per the news-feed calendar captured for this run, unconfirmed against the verified forward calendar.
Resistance:
- 4,520.0 (Pivot R3, outermost resistance of Monday's ladder)
- 4,514.1 (50 percent retracement of the four-week range)
- 4,492.1 (20-day moving average, the level the short-term composite signal is measured against)
- 4,479.9 (Pivot R2, grouped with the 2 standard deviation resistance at 4,477.2)
- 4,472.5 (38.2 percent retracement from the 13-week high, 4.7 beneath the 2 standard deviation resistance)
- 4,452.4 (Pivot R1, effectively identical to the computed target price at 4,452.0)
- 4,439.8 (Friday's session high)
Support:
- 4,412.3 (Pivot Point, the mechanical midpoint the session closed above)
- 4,410.5 (100-day moving average, reclaimed on the session and the nearest trend line above the entry zone)
- 4,387.9 (1 standard deviation support)
- 4,385.3 (50 percent retracement of the 13-week range)
- 4,384.8 (Pivot S1, three references inside 3.1 points with the two levels above, adjacent beneath the 4,385 zone edge)
- 4,372.2 (Friday's session low, effectively identical to the 2 standard deviation support at 4,372.6)
- 4,360.8 (3 standard deviations support, outer statistical band)
- 4,344.7 (Pivot S2, second pivot support of Monday's ladder)
Primary Setup: LONG December gold from the 4,385 to 4,397 entry zone, built on the grouping where the one standard deviation support at 4,387.9, the 50 percent retracement of the 13-week range at 4,385.3 and the first pivot support at 4,384.8 sit inside 3.1 points, the last of those adjacent beneath the zone's lower edge. Stop at 4,358, beneath the third standard deviation support at 4,360.8, which itself sits beneath Friday's low at 4,372.2 and the effectively coincident second standard deviation support at 4,372.6. Targets at 4,440 first, Friday's session high, then 4,452 second, where the computed target price at 4,452.0 and the first pivot resistance at 4,452.4 sit within half a point of each other, and 4,480 third, the second pivot resistance grouped with the second standard deviation resistance at 4,477.2 and the 38.2 percent retracement from the 13-week high at 4,472.5, only if momentum extends on expanding volume. Measured from the 4,391 midpoint against the 4,358 stop, risk is 33 points for approximately 1:1.5 to the first target, 1:1.8 to the second and 1:2.7 to the third. Invalidation is a settlement beneath 4,360.8, which takes out Friday's low and the second standard deviation band together. The 33 point risk is 30 percent of the 14-day average true range of 108.7, so the stop is tight by this contract's standards, and the weekend carries a Chinese loan prime rate decision at 09:00 PM ET Saturday with calendar forecasts of 3 percent and 3.5 percent, per the news-feed calendar captured for this run, unconfirmed against the verified forward calendar. The cash open at 09:30 AM ET Monday gives the first liquid directional test of the map above. The calendar captured for Monday shows no United States data release; the week's first-order risk for this metal is Tuesday, when three central bank speakers and a two-year note auction land, at 10:05 AM ET, 10:20 AM ET and 01:00 PM ET with the auction also at 01:00 PM ET, per the news-feed calendar captured for this run, unconfirmed against the verified forward calendar.
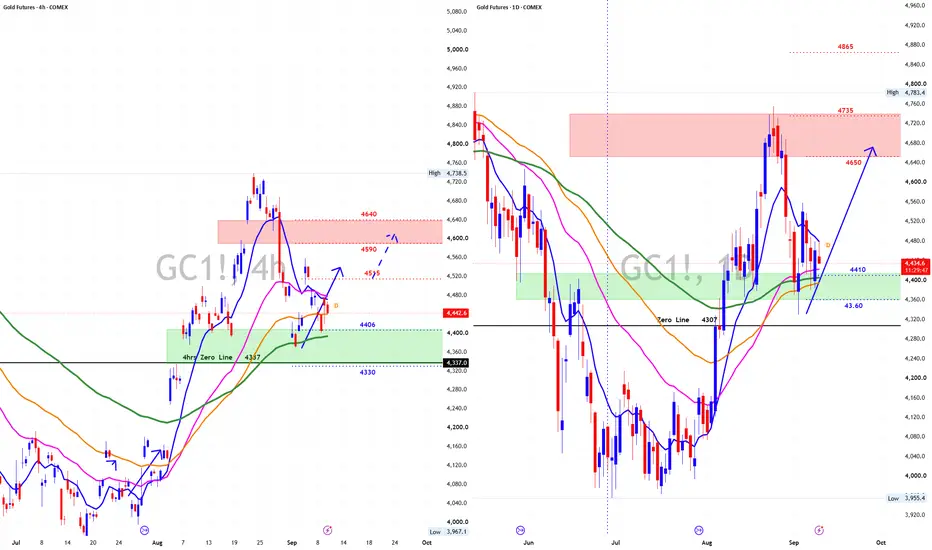
Is GOLD Set Up To Continue Higher?Sure it is ladies and gentlemen.
Gold is setting up to continue higher.
Set up is almost completed and if both the 4hrs and The Daily TFs get in sync by next week then we will have a breakout.
Buckle up GOLD lovers, grab your popcorns an beer because wild rides are coming.
Play it right......................Play it safe....................Play it The Numberfive Way.
Boost.....................Follow.....................Share...............Comment.
GOLD: If The Fed Hikes The Rate, Look For SELLS!In this Weekly Market Forecast, we will analyze Gold for the week of Sep 14 - 18th.
Gold is leaning bearish to neutral in the short term heading into this week, as rising expectations for a Federal Reserve interest rate hike place strong downward pressure on the non-yielding metal. The market closed the previous week at $4,408.90 per ounce, marking its third consecutive weekly decline.
My Plan: Wait for the Daily +FVG to be either respected or disrespected. This will signal the bias for this market.
Enjoy!
May profits be upon you.
Leave any questions or comments in the comment section.
I appreciate any feedback from my viewers!
Like and/or subscribe if you want more accurate analysis.
Thank you so much!
Disclaimer:
I do not provide personal investment advice and I am not a qualified licensed investment advisor.
All information found here, including any ideas, opinions, views, predictions, forecasts, commentaries, suggestions, expressed or implied herein, are for informational, entertainment or educational purposes only and should not be construed as personal investment advice. While the information provided is believed to be accurate, it may include errors or inaccuracies.
I will not and cannot be held liable for any actions you take as a result of anything you read here.
Conduct your own due diligence, or consult a licensed financial advisor or broker before making any and all investment decisions. Any investments, trades, speculations, or decisions made on the basis of any information found on this channel, expressed or implied herein, are committed at your own risk, financial or otherwise.
Gold - $4800 now possibleGold futures (1D) are testing a major decision point at $4,456, where two pitchfork structures overlap (U-MLH 1/4 Confluence).
- Red Pitchfork (Descending): Defines the macro corrective channel from the Feb/March highs. Price is testing the upper boundary line ($4,450-$4,500), which acts as critical overhead resistance.
- White Pitchfork (Ascending): Defines the recovery trend from the July swing low ($3,950). Price has reached the upper quarter median line (U-MLH 1/4).
PITCHFORK SCENARIOS & RULE #1
- Bull Case (Rule #1 Continuation): A daily close above the $4,500 confluence zone clears the red channel. Following Pitchfork Rule #1, price will target the White Centerline (CL), currently projected near $4,850-$4,900. Because of the upward angle of the white CL, this target moves higher each day price moves forward.
- Bear Case (Confluence Rejection): A failure to break $4,500 signals a rejection off resistance. The downside target becomes the White L-MLH around $4,150-$4,200 as dynamic support. A break below $4,150 invalidates the white pitchfork and opens risk toward $3,750.
KEY LEVELS TO WATCH
- Immediate Resistance: $4,450 - $4,500
- Upside Target (White CL): $4,850+
- Key Support (White L-MLH): $4,150 - $4,200
Gold (GC) Analysis, Key-Zones, Setup for Tue (Sep 15)Bias: Gold spent Monday failing to do the one thing the news set said it should. The December contract ran a session high of 4,396.8 and a session low of 4,293.0, which is also the one-month low, and the post-settlement electronic quote read 4,336.4 at 04:24 PM ET, down 72.5 points or 1.64 percent from Friday's prior close of 4,408.9. That close sits at 41.8 percent of the session range, computed from the same high, low and post-settlement print, so the decline was absorbed off the low rather than accelerating into the bell. The entire session traded beneath Friday's reference. Meanwhile the energy complex priced an active supply shock, with naval forces declaring the Strait of Hormuz closed, a supertanker reported ablaze after striking a mine, a damaged pipeline expected to stay out of service for three to five weeks, and crude settling at 101.39 dollars a barrel, up 1.34 percent. Equity volatility rose 7.95 percent to 17.11 while index futures fell. Gold did not participate in any of it. The reason is monetary. The scheduled consensus is a 25 basis point increase at the meeting that convenes Tuesday and announces Wednesday, the dollar index closed at 99.500, up 0.41 percent and at a one and a half week high, and the ten-year yield finished at 4.992. Firm inflation and labour data through the past two weeks built that expectation and the discount-rate channel is currently overwhelming the haven channel. Structurally the metal has now completed a lower high and a lower low from the late-August peak, it sits 3.94 percent below its 20-day average and just 0.21 percent above its 50-day average, and the 50-day is the only average it still holds. Momentum is the counterweight, with the 14-day stochastic pinned at 7.34 percent and relative strength at 41.79, which argues against pressing new downside at the lows. Dealer-positioning data for the gold fund carries a next-expiration move of 1.71 percent, though the expiry date behind it was not captured and it therefore cannot be scaled to a single session. Bias is lower into the mechanical resistance band while the metal holds beneath its pivot, with the long-end auction at 01:00 PM ET the session's first-order catalyst.
Resistance:
- 4,514.1 GC 20-day moving average, the line separating a bounce from a genuine structural repair, requiring 4.10 percent of recovery from the current print
- 4,494.9 GC computed third resistance, roughly 1.4 average true ranges above the reference print and relevant only to a short-covering event on a soft policy outcome
- 4,445.9 GC computed second resistance, converging within three points with the upper edge of the one average-true-range projection at 4,448.7, which marks the realistic ceiling for any Tuesday recovery
- 4,408.9 GC Friday prior close, untouched all of Monday, and the level whose reclaim would fill the gap that defined the session
- 4,391.1 GC computed first resistance, sitting 5.7 points beneath Monday's session high and forming the primary short reference with it
- 4,375.0 GC Monday opening print, an unfilled reference from the session that produced the decline
- 4,342.1 GC computed pivot, the immediate mechanical ceiling where Monday's late recovery stalled, and the single number that frames whether Tuesday trades in sell-rallies or buy-dips condition
Support:
- 4,327.2 GC 50-day moving average, the only average price still holds and by just 9.2 points on a closing basis, making it the most consequential level on the board
- 4,298.1 GC 38.2 percent retracement measured from the 13-week low, effectively coincident with Monday's extreme
- 4,293.0 GC Monday session low and one-month low, the defended level and the reference that defines the counter-trend alternate
- 4,287.3 GC computed first support, 5.7 points beneath the session low, so the 4,287 to 4,293 zone is a confluence a break must clear in full to count
- 4,238.3 GC computed second support, the first objective on a confirmed break of the September shelf
- 4,224.1 GC lower edge of the one average-true-range projection, converging with the computed second support and marking the reasonable maximum downside for one normal session
- 4,183.5 GC computed third support, roughly 1.4 average true ranges below the reference print and reachable only on liquidation of a crowded speculative long book
Primary Setup: SHORT GC from the 4,386 to 4,396 band, where the computed first resistance at 4,391.1 meets the session high at 4,396.8 that already rejected Monday's only rally attempt. Stop 4,421, placed above the moving-average crossover stall reference at 4,414.3 and above Friday's prior close at 4,408.9 so that a real reclaim invalidates rather than a wick. Targets at 4,342.1 first, the computed pivot and nearest mechanical magnet, then 4,293.0 second, the session and one-month low coincident with the 4,298.1 retracement, then 4,238.3 as a runner only if momentum extends on expanding volume. Risk to reward is roughly 1:1.6 to the first target, 1:3.3 to the second and 1:5.1 to the third, measured from the 4,391 midpoint against the 4,421 stop. Half size is appropriate given the policy announcement scheduled for Wednesday, which makes Tuesday a staging session rather than a resolution. Pricing is likely to be disorderly in the minutes immediately around the twenty-year auction result at 01:00 PM ET, and the cash open at 09:30 AM ET sets the session's first directional test.
Alternate Setup: LONG GC from 4,290 to 4,300 only on evidence of absorption at the shelf, a zone bracketing the session low at 4,293.0 and the 4,298.1 retracement, and sitting directly above the computed first support at 4,287.3. Stop 4,262 beneath the zone. Targets at 4,342.1 first, 4,391.1 second and 4,445.9 as a runner, contingent on the dollar index losing its Monday gains. Risk to reward is roughly 1:1.4 to the first target and 1:2.9 to the second from the 4,295 midpoint. Reduced size on this side, since it trades against the established structure and into an event.
Tuesday Events:
- 10:00 PM ET Monday, Chinese industrial output (4.8 percent consensus against 4.5 percent prior), retail sales (0.8 percent against 0.6 percent) and urban investment year to date (minus 7.1 percent against minus 6.7 percent)
- 02:00 AM ET, UK labour market data, unemployment rate (4.9 percent consensus) and average weekly earnings (3.9 percent against 4.1 percent prior)
- 05:00 AM ET, German economic sentiment (40 consensus against 34.2 prior) and current conditions (minus 52.1 against minus 61.1)
- 08:30 AM ET, New York regional manufacturing survey (15 consensus against 20.60 prior)
- 01:00 PM ET, United States twenty-year bond auction, prior 5.204 percent high yield and 2.530 bid-to-cover, KEY first-order event for gold
- 02:15 PM ET, legislative cloture vote
- 07:50 PM ET, Japanese trade balance and core machinery orders
- Gulf headline risk remains live and unscheduled, with the strait situation and pipeline repair timeline both unresolved
How I'm seeing it:
- The structural shift is that Monday added a lower low to an already established sequence of lower highs, and it did so while the metal closed beneath its own forward pivot. A market that finishes under its pivot after a 1.64 percent decline is mechanically in sell-rallies condition until it proves otherwise.
- The daily candle gapped down and never filled, holding entirely beneath Friday's reference, with a 41.8 percent close position, so it is directional without being a capitulation signature. Volume of 158,885 against a 20-day average of 184,944 means the break happened on below-average participation, which is a real qualifier on conviction.
- The mechanism for Tuesday runs entirely through the long end of the yield curve. The ten-year at 4.992 and the dollar index at 99.500 are what is pressing the metal, and the auction at 01:00 PM ET is the scheduled test of both. A firm reception releases gold back toward the pivot, a weak one drives the 4,290 shelf.
- The two-sided catalyst is the Gulf. An escalation that moves crude sharply can spike gold on the headline, but Monday's evidence is that such spikes are being sold unless yields fall alongside them. Conversely a credible de-escalation removes what little premium remains and accelerates the downside.
- Cross-asset confirms a broad precious-metals liquidation rather than a gold-specific event. Silver fell 2.26 percent to 63.715, underperforming gold on the day and putting the gold to silver ratio at 68.12 measured from the front-month quotes. Crude settled 1.34 percent higher and equity volatility rose 7.95 percent, neither of which helped the metal.
- The broader framing is consolidation inside a large drawdown rather than a trend ending, with the contract 25.00 percent below its 52-week high but still 12.91 percent higher across that year and only 0.62 percent changed over three months. The 14-day directional index at 19.97 sits below the trending threshold and the 14-day relative strength at 41.79 is mid-range. The 50-day average at 4,327.2 is the level whose failure on a closing basis flips this from consolidation to continuation.
- Path weighting for Tuesday, as analyst judgment rather than statistically derived figures: Path A at 35 percent is dollar-led continuation, the metal rejecting the 4,386 to 4,396 band and working the 4,290 shelf by the close. Path B at 30 percent is pin and drift, a 4,312 to 4,376 session that resolves nothing before Wednesday. Path C at 20 percent is oversold reversion, absorption at the shelf carrying back through the pivot toward 4,391.1. Path D at 15 percent is a geopolitical premium spike that runs past 4,408.9 on a Gulf headline, sustained only if yields fall with it.
Invalidation: A decisive session close above 4,408.9, Friday's prior close, negates the short thesis by filling the gap that defined Monday. A sustained session above 4,445.9 unlocks 4,494.9 and then the 20-day average at 4,514.1. On the other side, a decisive close beneath 4,287.3 confirms the lower-low structure and opens 4,238.3 and 4,224.1, with 4,183.5 in play only on liquidation.
GC GEX – Testing the 4405 Put Wall AgainGold futures are returning to a familiar decision zone on the daily chart.
The October 16 cumulative GEX Profile places the strongest put wall at 4405 , directly where rising technical support now converges. Previous tests around this structure produced meaningful reactions, making the latest retest especially important.
🔶 Regime Context 🔶
GEX History shows 0, W1, M1, M2 and ALL aligned in negative GEX . This is a volatility backdrop rather than a directional signal: price movements can become faster and more amplified while the alignment persists.
Price is testing P1 rather than decisively trading below it, so negative extension is not yet confirmed. The next daily reaction must determine whether 4405 remains support.
🔶 Options Structure Context 🔶
👉 4405 – P1 / strongest put wall
The level aligns with the rising daily support line, creating a combined technical and GEX reaction zone.
A successful hold would keep the established support structure intact and put the HVL regime pivot back in focus. Reclaiming that pivot could reopen the path toward 4570 , the largest call wall.
Clear daily acceptance below 4405 would change P1 from support into resistance and move Gold into a negative extension zone , introducing downside gamma-squeeze risk if momentum confirms.
🔶 Options Sentiment 🔶
CALL$ 56.4% means calls at an equivalent distance from spot are priced 56.4% higher than the corresponding puts—elevated call pricing skew.
The Options Oscillator’s green histogram has declined sharply from its recent peak, showing that call pricing skew has been fading.
IVRank 37.6
IVx 27.6 (36 DTE) | IVx 5dCh +1.2%
CALL$ 56.4% (36 DTE)
Implied move ±0.57% (±25)
🔶 Key Structure to Watch 🔶
4405 holds — another reaction from P1 and rising support
HVL reclaimed — potential stabilization of the GEX regime
4570 — largest call wall and main upside reference
4405 breaks and holds below — negative extension and downside gamma-squeeze risk
The key question is whether 4405 can produce another confirmed reaction—or whether the all-negative multi-expiry backdrop finally pushes Gold through its strongest put wall.
GOLD WEEKLY OUTLOOK — NOW WE WAIT FOR THE REACTIONGold finally broke out of the consolidation range we've been watching, and now we're sitting at a pretty important decision point.
Price pushed lower into the H4 Bullish FVG, which sits just below the previous day's low.
We actually started filling this imbalance late in the NY session today, but it happened outside of my killzone, so I stayed out.
That's important.
Just because price reaches my level doesn't mean I have to trade it.
Now I'm watching to see what happens next.
🔵 THE BULLISH SCENARIO
If sellers continue pushing price into the H4 FVG, I'm going to let them.
I actually want to see the gap get filled.
What I'm looking for is:
FVG gets filled → sellers lose momentum → buyers step in → price reclaims Previous Day Low → confirmation.
If I see that sequence accompanied by the order flow shifting back toward the buyers, that's where I'm interested in taking the long.
Because at that point I'm not simply buying an FVG.
I'm buying the reaction to the FVG.
And that's a big difference.
My target would initially be a move back through value, with the possibility of continuing higher if buyers can regain control.
🔴 BUT HERE'S WHERE I'M WRONG
If price simply slices through this FVG and continues accepting lower prices, I'm not going to sit there trying to convince myself that it has to bounce.
If we break down through roughly 4370, I'm hands off.
At that point, the market may be looking for the next larger imbalance/liquidity area below.
Let it go.
I'll wait for price to tell me where the next opportunity is.
📊 WHAT I'M SEEING IN ORDER FLOW
One thing that has my attention right now is that value has shifted higher, even though sellers are currently pushing price back down.
That's interesting.
It tells me the market has established higher value, but sellers are currently testing whether that higher value can actually hold.
So now the question becomes:
Are sellers actually taking control… or are they simply filling the imbalance before buyers step back in?
That's what I want the order flow to answer for me.
I'm not interested in guessing.
🌎 AND THEN THERE'S THE MACRO
There's another interesting piece of the puzzle coming into play tomorrow.
Starting September 9, the U.S. Treasury is increasing the maximum size of its longer-dated nominal Treasury buyback operations from $2B to at least $4B per operation, through the end of the current refunding quarter on November 4. Treasury describes this as liquidity support for the longer end of the Treasury market.
I've seen the argument that this is basically "QE" and therefore automatically bullish for gold.
I'm not going that far.
It's not the same thing as Federal Reserve QE.
But it could have implications for liquidity, Treasury demand, yields and ultimately the dollar — all things that can matter to Gold.
And this week we also have some serious potential catalysts:
Thursday: PPI
Friday: CPI
Next week: FOMC, September 15–16.
So there's plenty sitting underneath this technical setup.
🎯 MY PLAN
For me, this is all about timing.
I'm not touching this just because price enters the FVG.
I want to see:
1️⃣ Price fill the FVG
2️⃣ Sellers fail to continue lower
3️⃣ Buyers take control on the order flow
4️⃣ Price reclaim Previous Day Low
5️⃣ THEN I'm looking for the long
And I'm still respecting my timing rules.
I don't want to touch this before :45 of the hour. I want the market to have time to develop the reaction instead of jumping in because I think I know what's coming.
If the setup develops?
I'm ready.
If it doesn't?
That's fine too.
Because the goal isn't to predict the reversal.
The goal is to recognize it when it actually happens.
Gold is sitting at a decision point.
Bullish FVG below.
Previous Day Low sitting overhead.
Value has shifted higher.
Sellers are testing the downside.
Macro catalysts are coming.
Now we wait and see who actually takes control.
Price doesn't owe me a trade.
Let it show me what it wants to do. 👊🏾
#Gold #MGC #GC #Futures #GoldFutures #OrderFlow #PriceAction #VolumeProfile #TradingView #DayTrading #FuturesTrading #SmartMoney #MarketStructure
GOLD: New Long Entry Ahead!Primary Scenario
Currently, gold futures are in an internal upward move. Once the associated top is established, we expect sell-offs into our green Target Zone ($4261–$4046). After reaching a low there, we anticipate a move above resistance at $4917, where we expect a significant corrective high within our red Target Zone ($4988–$5438). After that, price should turn downward again.
Alternative Scenario
In our alternative scenario, gold futures would climb directly above resistance at $4917, completing the larger corrective upward move more quickly (probability: 35%). In this case, price would not reach our green Target Zone ($4261–$4046), but instead move to the levels of the red Target Zone ($4988–$5438) sooner.
Long-Term Outlook
The weekly chart still highlights our blue Long-Term Entry Range ($2149–$1328). We expect a major low in this area, which should trigger a sustainable trend reversal to the upside.