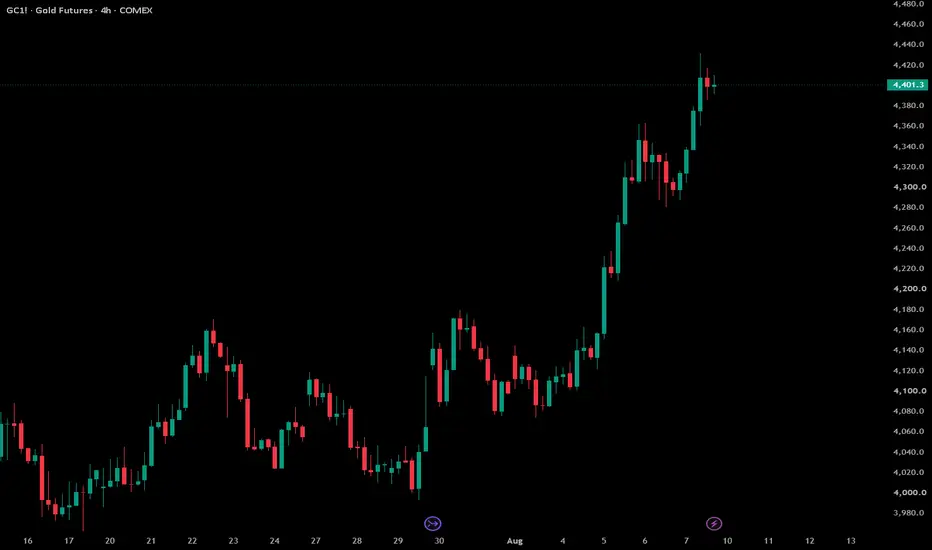
Gold - Is the correction over?Gold has spent the past few months consolidating after the strong decline from the highs earlier this year. Price found significant support around the $4,000 area and has since started to build a more constructive structure. After weeks of sideways price action, buyers have recently shown strength and pushed price back toward the upper end of the range. The key question now is whether this move marks the beginning of a larger trend reversal or simply another relief rally. There are several technical signs suggesting that the bulls may finally be gaining control.
Consolidation Around $4K
Gold spent a significant amount of time consolidating around the $4,000–$4,300 area after the previous downtrend. During this period, sellers were unable to push price meaningfully below the major support around $4,050, while buyers repeatedly stepped in at these lower levels. This created a clear base from which the recent rally developed. The longer price held this consolidation, the more important the eventual breakout became. With price now trading well above the middle of this range, the structure is starting to look increasingly bullish.
Higher High
One of the most important developments is the recent formation of a higher high. After breaking above the previous swing high around the $4,400–$4,450 area, Gold showed that buyers were able to overcome a level that had previously acted as resistance. This is an important change compared with the series of lower highs seen during the preceding downtrend. A sustained move above this level would strengthen the case that the market structure is shifting in favor of the bulls. However, confirmation will depend on whether Gold can hold these higher levels rather than immediately falling back into the previous range.
Trendbreak
Gold has also broken above the long-term descending trendline that had been guiding price lower for several months. This trendline connected multiple lower highs and acted as a clear representation of the broader downtrend. Breaking above it is therefore an important technical development and suggests that the sellers may be losing control. If the breakout holds, the previous downtrend could transition into a new bullish phase. Ideally, we would now see the trendline or nearby support zones hold during any pullback.
Retest of the Daily FVG?
The Daily FVG around the $4,200–$4,250 area could become an important level to watch if Gold pulls back from current prices. A retest of this imbalance would allow the market to confirm whether the previous resistance has successfully turned into support. If buyers step in around this zone, it could provide the foundation for another move higher and potentially a continuation toward $4,800 and beyond. On the other hand, losing the Daily FVG would weaken the current bullish structure and could signal that the breakout was premature. For now, this area is one of the most important zones to monitor on any retracement.
Final Thoughts
Overall, Gold is showing several signs of a potential trend reversal after months of consolidation and lower highs. The breakout of the descending trendline combined with the formation of a higher high gives the bulls a strong technical argument. A pullback into the Daily FVG could therefore be a healthy retest rather than a bearish signal, provided buyers defend the zone. If the FVG holds, I would expect Gold to continue moving higher and potentially target the $4,800 area. The main invalidation would be a loss of the Daily FVG and a return below the recent breakout structure, which would suggest that the bears are attempting to regain control.
In-depth trading ideas
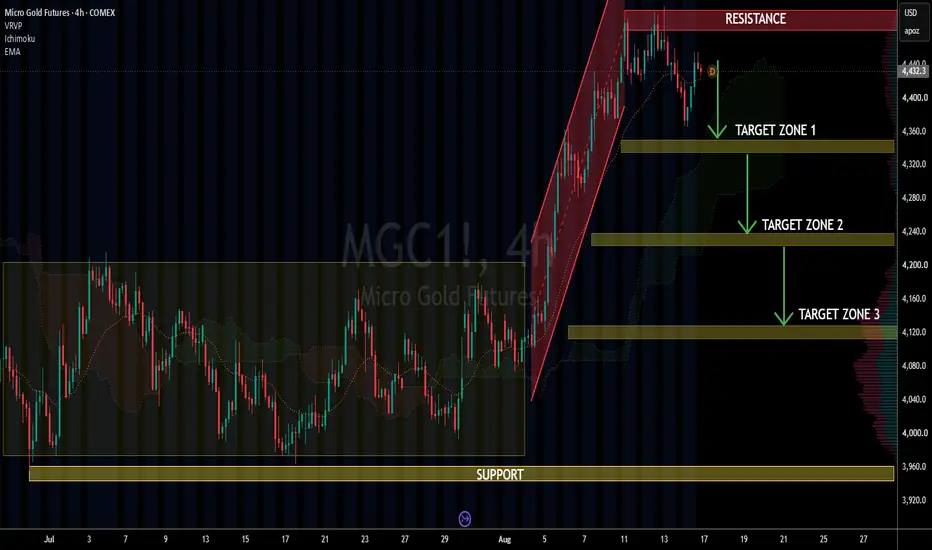
This is the Micro Gold Futures - MGC1! 4-Hour chart on COMEX.This is the Micro Gold Futures - MGC1! 4-Hour chart on COMEX.
Chart Analysis:
1. Accumulation Done: Price was ranging in the "SUPPORT" zone around $3940 - $3960 for a while. Multiple tests and held.
2. Breakout + Channel: Then we got a strong bullish move up inside a red ascending channel. Clean structure.
3. At Resistance Now: Price hit "RESISTANCE" near the top of the channel and pulled back a bit.
4. Targets Marked: 3 "TARGET ZONES" drawn for a pullback/continuation play:
- TARGET ZONE 1: ∼$4320 - $4340
- TARGET ZONE 2: ∼$4280 - $4300
- TARGET ZONE 3: ∼$4240 - $4260
Key Levels to Watch:
- Resistance: Channel top ∼$4380 - $4400. Break above this and next leg starts
- Support Zones: Those 3 green boxes. If price pulls back, these are buy areas
- Major Support: $3940 - $3960 - The big yellow zone. Lose this and bias flips bearish
Bias: Bullish while holding above $4240. The plan looks like: Buy the dip into Target Zones, ride back up to new highs. A 4H close below $4240 likely means a deeper correction to $3960 support.
Educational only. Not financial advice. Gold is news driven - watch DXY and yields
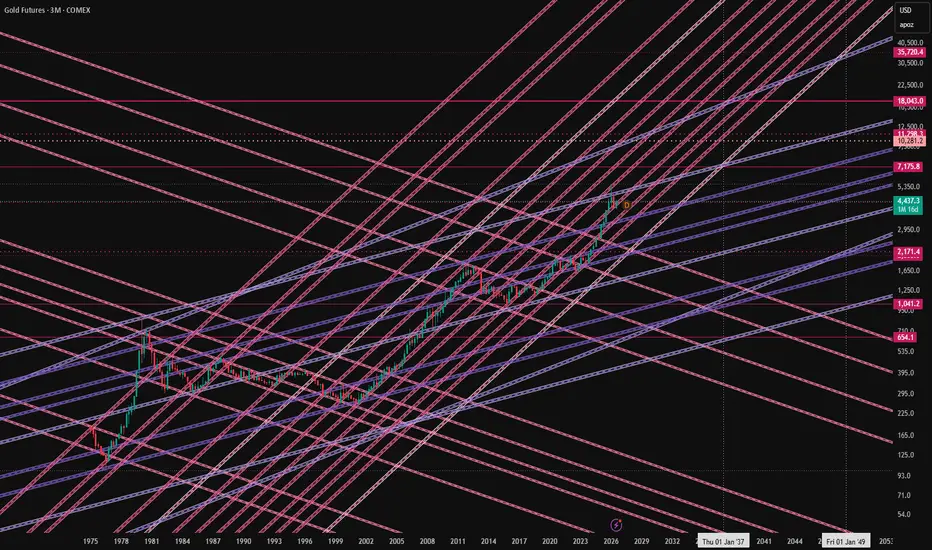
gold future with preferred angles Hi!, trying to look into the future (2050) , not so easy but if chart shows the physics, very much possible , plotted levels needs the consideration.
u can see the preferred angles here followed by the gold future for rising and for correction , gold followed the sharper rising angle for last many years.
lets c , will post the chart in lower time frame in below slides
Back to Basics with Chart Setups but with modern indicatorsI love this chart set up - and i believe it reflects the fact that we really don't need too many indicators on our TV charts to identify and action possible winning trades.
yes, the Gold Futures chart here has only 2 indicators
1- MagicRibbon, which is essentially a bunch of moving averages with green & red markers that show up when an trend alignment is detected - nothing super fancy
2- then there's EVEREX at the lower panel, which acts as a dual-period volume weighted RSI - but believe me when i tell you, this "simple" chart layout took many years of TA study and experimentation (and trading) to reach that level of "simplicity" and efficiency.
by inspecting the chart, we can see how effective this set up is in identifying potential price moves - and winning trades to take - and this is what we're here to do, right?
Using the magic of TradingView and Pine, you can take classic, proven technical analysis concepts (like Moving Averages reflecting momentum, and using MTF with the ribbon) and weighted "Rate of Flow" / Effort Versus Results (Wyckoff Law) and create a winning set up - we haven't even used AI yet :)
That's the thought i wanted to share today. what do you think? Is this chart setup as effective as i think ?
Also, do you think should we invest effort in creating more advanced versions of these indicators - will that be a value-add to you as a SCALP / SWING or TREND trader - making money in Futures, Crypto, Stocks ?... This setup is so generic that it can easily adjust to any style - oh, and the best thing, you can still "add to it" whatever secret weapon that you use today - just avoid too many signals that become over-confusing.
I'd love to hear your feedback - maybe a screener-friendly version? or advanced alerts capabilities? .. Let me know in the comments -- happy trading!
GOLD: Bullish Going Into This Week. But Is It A Buy?In this Weekly Market Forecast, we will analyze Gold for the week of Aug 10-14th.
Gold enters the week with a bullish bias after a strong rally pushed prices near $4,400/oz, though the potential for high volatility looms.
As bullish as it may have ended last week, it closed in a potentially resistant area.
Enjoy!
May profits be upon you.
Leave any questions or comments in the comment section.
I appreciate any feedback from my viewers!
Like and/or subscribe if you want more accurate analysis.
Thank you so much!
Disclaimer:
I do not provide personal investment advice and I am not a qualified licensed investment advisor.
All information found here, including any ideas, opinions, views, predictions, forecasts, commentaries, suggestions, expressed or implied herein, are for informational, entertainment or educational purposes only and should not be construed as personal investment advice. While the information provided is believed to be accurate, it may include errors or inaccuracies.
I will not and cannot be held liable for any actions you take as a result of anything you read here.
Conduct your own due diligence, or consult a licensed financial advisor or broker before making any and all investment decisions. Any investments, trades, speculations, or decisions made on the basis of any information found on this channel, expressed or implied herein, are committed at your own risk, financial or otherwise.
Who Is Selling Gold While Central Banks Keep Buying?Gold has been correcting over the past quarter. But here’s something interesting.
While the gold price was falling, central banks around the world continued to show a strong appetite for gold.
According to the latest World Gold Council research, central banks continued to accumulate gold. From April to June this year, their purchases increased to nearly 289 tonnes—higher than in the second quarter of 2025, 2024, and 2023.
So, this raises a very interesting question: If central banks are buying gold, who is selling it?
And perhaps an even more important question:
What are central banks seeing that other investors may not be seeing?
Mirco Gold Futures and Options
Ticker: MGC
Minimum fluctuation:
0.10 per troy ounce = $1.00
Disclaimer:
• What presented here is not a recommendation, please consult your licensed broker.
• Our mission is to create lateral thinking skills for every investor and trader, knowing when to take a calculated risk with market uncertainty and a bolder risk when opportunity arises.
CME Real-time Market Data help identify trading set-ups in real-time and express my market views. If you have futures in your trading portfolio, you can check out on CME Group data plans available that suit your trading needs www.tradingview.com
GOLD: A Superposition at $4,400 — Which State Collapses First?My own system is printing Sell on the weekly right now. On the monthly, the same
system prints Strong Buy with a first target near 5,195. Same indicator, same
data, opposite conclusions.
My indicators are private, so the chart here is clean price action and I am
quoting their readings instead of showing them. Every number below is a reading,
not a promise.
I am not going to hide one to make the other look smarter. Both states are alive
until something is measured.
ONE RULE ABOVE EVERYTHING: THE MARKET IS ALWAYS RIGHT
The market is not an opinion I get to argue with. It is the measurement. When
price closes, that is the observation, and the observation is never wrong. Only
my model can be wrong. Every rule below exists to make my model cheap to update
and expensive to defend.
WHAT 10,000 TICKS ACTUALLY MEANS
I say this on stream constantly: anything under 10,000 ticks is scalping.
That is not a price target. It is a unit of measurement. On COMEX GC one tick is
$0.10 per ounce, so 10,000 ticks is about $1,000 per ounce of travel. Below that
distance I am not looking at a trend - I am looking at noise with good lighting.
Above it, structure has to exist, because price cannot travel that far without
leaving evidence of who was buying and where.
So when I say gold has a 10,000-tick move in it, I am not promising a number. I
am naming the class of move I am measuring. Anything smaller does not qualify for
the thesis. Part of that distance has already printed, which does not make the
rest certain - it makes the rest a fresh decision.
NON-COMMUTING OBSERVABLES: WHY MY OWN TIMEFRAMES DISAGREE
In physics, measuring position precisely destroys precision in momentum. They
cannot both be sharp at once. Charts behave the same way, and today my own panel
demonstrates it better than any explanation I could write:
Monthly: Buy, strong reading, first target near 5,195, reward-to-risk about 1.5.
Weekly: Sell, first target below current price.
Daily: Buy - but reward-to-risk about 0.4.
Look at that daily line again, because it is the whole lesson. The direction is
right and the trade is still garbage. A 0.4 reward-to-risk means I am putting up
more than twice what I stand to make. Correct and unprofitable are not opposites.
That is what a shorter measurement window costs you. It sharpens timing and
destroys the distance you need for the payoff to exist. The longer window has the
payoff and cannot tell you when. Monthly up, weekly down, daily up is not a
contradiction. It is three measurement bases returning three valid answers.
The monthly carries the thesis. The weekly decides the entry. The daily is noise
until the weekly close agrees. A long-term view is allowed to sit through a
weekly pullback. What it is not allowed to do is rewrite its story afterwards and
pretend it always said that.
SUPERPOSITION: ALL DIRECTIONS STAY OPEN UNTIL SOMETHING IS MEASURED
Before the weekly close, gold is not going up or down in my model. It holds both,
with different weights. Almost every large loss I have watched, including my own,
came from collapsing that early - picking one branch because holding two felt
uncomfortable, then spending weeks defending the pick.
So I hold the distribution, not the conclusion, and I let the close do the
collapsing. My discomfort is not information.
ENTANGLEMENT: NEVER READ GOLD ALONE
Gold, silver, copper, platinum, palladium - I read the whole metals complex.
Correlated systems share information, so measuring one tells me something about
the others. When the complex moves together, the move has a body behind it. When
gold runs while silver and copper refuse, the correlation has broken, and that is
the earliest warning available. It arrives before any indicator says a word.
I read gold across five independent axes: price structure, macro, correlation,
news flow, and technicals. On the macro side for metal it is the dollar, long-end
yields, crude, and volatility. If I could keep one macro input and throw the rest
away, I would keep rates - metal is priced against the cost of holding money.
Here is the part most people will not like. My engine refuses to give a
directional call unless enough of those axes are fresh and agreeing. If several
inputs go stale, it returns neutral on purpose. It is built to be able to say "I
do not know."
A system that always has an opinion is not confident, it is lying to you. No
measurement means no collapse, and no collapse means no trade.
MEASUREMENT: WHAT ACTUALLY COUNTS AS AN OBSERVATION
Not a touch. A close.
I mark where price actually turned, repeatedly, and I never buy the first touch of
a level - a touch is a rumour. I wait for the reclaim close: price closing back
above the level is buyers proving they won, not hoping. Then at least 2:1 reward
to risk, or I pass. That single filter is why the daily setup above does not get
my money today.
I also do not trust a level only one source can see. A weekly level on the chart,
the same area in order-book depth from my domestic broker feed, and whether I
said it out loud on stream before it happened. Three independent looks. If two of
the three disagree, it is an opinion, not a level.
THE ANSWER TO THE QUESTION I GET MOST
Every stream, someone asks the same thing: when does it move?
My answer has not changed: it moves once you cut your loss.
That sounds harsh. It is mechanical. Price travels toward where positions have to
be closed, and the last cluster of stops sitting under an obvious level is fuel.
If you place your stop where everybody else placed theirs, you are not managing
risk - you are supplying it.
This is also the honest version of the quantum framing. You are not standing
outside the system observing it. You are part of what gets measured. Your
capitulation is one of the inputs. Size and stop placement are the only parts of
that you control.
THE STATE THAT ENDS THIS THESIS
A weekly close that loses the level the move launched from, or the metals complex
splitting apart while gold pushes alone. Either observation and the thesis is
gone - I stand down and re-mark. A thesis with no exit condition is not a thesis,
it is a wish.
Same long-term logic on my board: NQ 26,000 remains valid.
One honest note: this is a thinking framework, not a claim that quantum physics
moves price. I use it because it forces the two habits that actually pay - holding
several outcomes at once, and letting the measurement decide instead of me.
So here is what I want to hear, because I think it separates the people who last
from the people who do not: when your own system disagrees with your thesis,
which one do you obey - and what is your written rule for it? Put it in the
comments. I read all of them.
Educational content only. Not financial advice. Every entry, exit and outcome is
your own judgement, not mine. I publish the framework, never instructions.
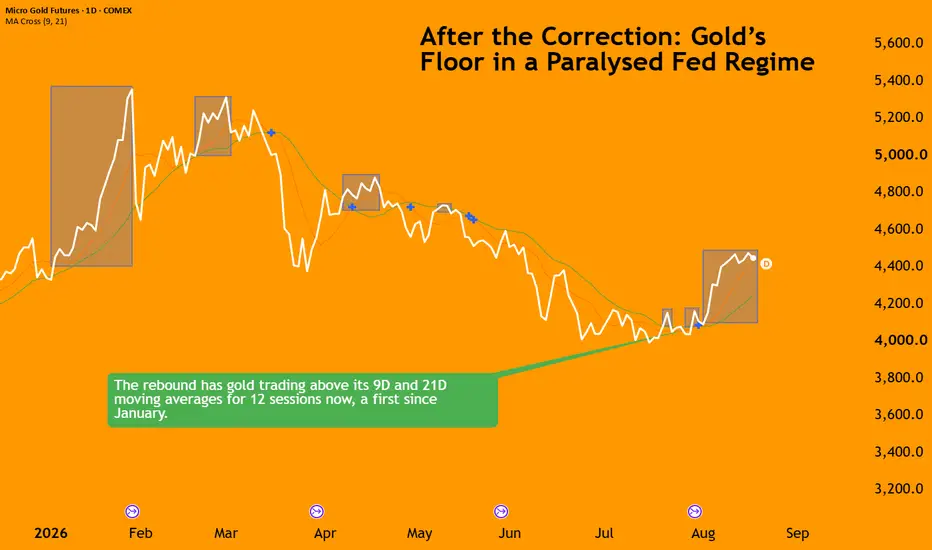
After the Correction: Gold’s Floor in a Paralysed Fed RegimeGold is still well below its January peak, but the correction has started to stabilise. Currently, COMEX futures are trading near $4,385, roughly 22% below the $5,602 high.
The immediate trigger comes from a change in the rate outlook.
July payrolls fell by 23,000, with May and June revised down by a combined 103,000. Then July CPI came in softer, with core inflation slowing to 2.5% year on year. A September hike had been a live risk earlier in the summer, but it is now much harder for the Fed to justify.
However, the rate repricing only explains the bounce. It does not explain why the selling stopped around $4,000, how much of the recovery is being driven by fresh speculative length, or whether gold can keep moving higher while real yields remain elevated. Those questions sit at the centre of the current setup.
Who Bought the Dip
The World Gold Council’s Q2 numbers establish that the correction found real support, even if the picture was not uniformly strong across every buyer group. Total demand, including OTC activity, held at 1,269 tonnes in the quarter. That took first-half demand to 2,522 tonnes, up 2% year on year and worth a record $380 billion.
Central banks were the clearest source of strength, with official-sector purchases reaching 289 tonnes, the highest second-quarter total on record. Poland was the largest reported buyer, but China also stepped up by adding 33 tonnes. The caveat is that Q1 official demand was weak after revisions, leaving first-half central-bank buying at 345 tonnes, the lowest H1 total since 2022.
Source: Gold.org
Jewellery demand weakened as high prices constrained affordability. Global consumption fell to 278 tonnes, its lowest level since the pandemic. But that did not translate into a collapse in spending: jewellery outlays still rose 14% YoY to $40 billion, as buyers shifted toward lighter pieces, lower-carat products and old-for-new exchanges.
Source: Gold.org
ETF flows told a more regional story, with global physically backed funds losing 45 tonnes in Q2, or about $4 billion, all on account of just North American funds. Asian funds were also down 15 tonnes, but they remained up 70 tonnes over the first half, making it the region’s strongest H1 on record.
Source: Gold.org
The PBOC, in fact, made its largest monthly addition since October 2023, adding roughly 20 tonnes in July, bringing holdings to over 76 million ounces.
The Tape Since the High
Gold ran aggressively into January, and by early July, spot briefly pierced $4,000 to print in the high $3,900s. Sure, some of the January move had been speculative, but the market was also reassessing the policy implications of a Warsh-led Fed.
The rebound since then has also brought speculators back. Managed money has moved back into the rally with stronger open interest week-on-week, all while longs rose faster than shorts. This points to fresh speculative demand rather than a rebound driven purely by short covering.
Source: CME QuikStrike
Smaller and retail traders also turned more constructive into the rebound. Net length rose to its highest level in the period shown, led by a renewed increase in outright longs rather than a reduction in shorts.
Source: CME QuikStrike
The macro picture is mixed rather than uniformly supportive. The dollar has eased as markets have priced out some of the September-hike risk, with DXY falling from above 101 in late July to around 99.5.
Real yields are the less accommodating part of the picture. The 10-year Treasury yield remains near 4.64%, while 10-year TIPS yields touched 2.42% in late July and remain close to 2.4%. Those are levels that would normally limit gold’s upside by raising the opportunity cost of holding bullion.
In a nutshell, the current move rests more on the conviction that the Fed may not be able to deliver another hike. Whether that is enough to sustain the rebound will depend on whether the labour data continue to close that door.
The Box the Fed Is In
On July 29, the FOMC voted 9–3 to maintain the federal funds target range at 3.50–3.75%—the sixth consecutive hold and an unchanged rate since December.
Chair Warsh reiterated a strict 2% inflation target, stating there is no soft alternative, yet no action was taken. That assessment was written before the July jobs report.
Payrolls then fell by 23,000, while May and June were revised down by a combined 103,000. The three-month payroll average is now only 20,000, and participation has fallen to 61.4%, down 0.7 percentage points since January.
July headline CPI rose only 0.1% month on month, but energy remains 14.7% higher than a year ago, even after falling 1.5% in July alone. The monthly decline there is owing to lower gasoline prices; the year-on-year energy problem has not disappeared.
The Hormuz situation also keeps that risk alive, with the Strait’s closure certain until Iran deems its conditions met and Brent anchored in the high $80s. The Fed cannot directly fix an oil-supply shock, but it also cannot dismiss the possibility that higher energy prices bleed back into headline inflation and expectations.
Source: CME
CME FedWatch now assigns roughly a two-thirds probability to rates remaining at 3.50%–3.75%, versus roughly one-third for a 25-basis-point hike.
Gold thrives within this exact box: a rate hike into a negative 23,000 payroll print is unviable, while the Hormuz blockade prevents clean disinflation.
Historical Parallel: October 2023 to March 2024
In early October 2023, gold traded down to $1,810 just as 10-year real yields hit cycle highs. The Fed had delivered its final hike in July (to 5.25–5.50%) and continued signalling higher-for-longer. No easing was on the horizon.
When geopolitical conflict escalated in early October, the marginal threat of further rate hikes faded, and gold surged.
By late March 2024, spot broke through $2,230, even though the first actual rate cut did not materialise until September 2024.
For this historical-hypothetical scenario played in real-time, a realistic entry window sits around mid-October, after the market had started to reject the breakdown. A trader using the April 2024 Micro Gold contract, for example, could have entered at $1,950, once the reversal was established.
After rallies in the final quarter of 2023, gold consolidated and trended around $2050 for a few months. The breakout came in March, and by early April, the contract was trading near $2,330.
Exiting during the first week of April would have captured the main move while avoiding the temptation to hold a maturing contract into its final weeks.
Contract size: 1 Micro Gold futures contract, representing 10 troy ounces.
Entry: $1,950/oz
Exit: $2,310/oz
Total P&L: $360 x 10 oz = $3600
One Micro Gold contract represents 10 troy ounces, so every $1 move in gold changes the contract value by $10.
What the market rewarded then was not policy accommodation, but the removal of the next tightening increment, all against an active geopolitical backdrop and persistent physical demand.
Today's setup follows the same structure:
Labour Weakness: The employment picture is weaker today than in late 2023, making additional rate hikes even more difficult to justify.
Structural Base: Gold is currently digesting a 22% post-peak correction rather than grinding out of a mid-cycle consolidation at $1,800. However, sovereign central-bank accumulation underneath $4,000 is substantially larger than it was during the previous cycle.
If this analogy holds, the trade does not depend on Warsh delivering a dovish surprise at Jackson Hole as well. Hawkish momentum has already crested in the macroeconomic data, allowing gold to work higher while the Fed Chair continues to defend the 2% inflation target.
This content is sponsored.
MARKET DATA
CME Real-time Market Data helps identify trading setups and more effectively express market views. If you have futures in your trading portfolio, you can check out on CME Group data plans available that suit your trading needs at tradingview.com/cme .
DISCLAIMER
This case study is for educational purposes only and does not constitute investment recommendations or advice. Nor are they used to promote any specific products, or services.
Trading or investment ideas cited here are for illustration only, as an integral part of a case study to demonstrate the fundamental concepts in risk management or trading under the market scenarios being discussed.
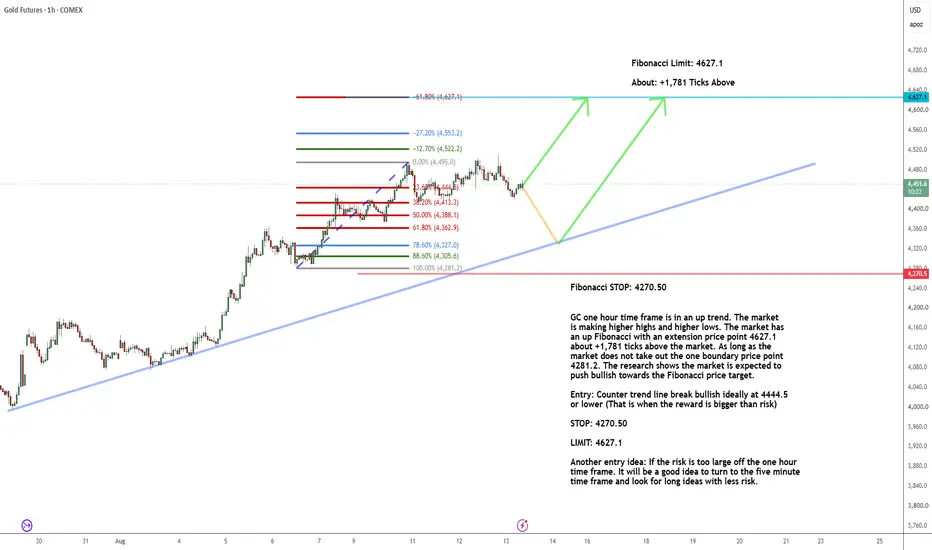
GC One hour_+1,781 ticks to targetGC one hour time frame is in an up trend. The market
is making higher highs and higher lows. The market has
an up Fibonacci with an extension price point 4627.1
about +1,781 ticks above the market. As long as the
market does not take out the one boundary price point
4281.2. The research shows the market is expected to
push bullish towards the Fibonacci price target.
Entry: Counter trend line break bullish ideally at 4444.5
or lower (That is when the reward is bigger than risk)
STOP: 4270.50
LIMIT: 4627.1
Another entry idea: If the risk is too large off the one hour
time frame. It will be a good idea to turn to the five minute
time frame and look for long ideas with less risk.
Gold: May Be Starting A Pullback To DiscountIn this Weekly Market Forecast, we will analyze Gold for the week of Aug 17 - 21st.
Gold is carrying some short-term bearishness for the upcoming week, despite finishing the previous week higher at $4,437.30 per ounce. While the medium-to-long-term macroeconomic outlook remains highly bullish, current technical structures indicate that the metal faces immediate downward pressure and profit-taking.
Enjoy!
May profits be upon you.
Leave any questions or comments in the comment section.
I appreciate any feedback from my viewers!
Like and/or subscribe if you want more accurate analysis.
Thank you so much!
Disclaimer:
I do not provide personal investment advice and I am not a qualified licensed investment advisor.
All information found here, including any ideas, opinions, views, predictions, forecasts, commentaries, suggestions, expressed or implied herein, are for informational, entertainment or educational purposes only and should not be construed as personal investment advice. While the information provided is believed to be accurate, it may include errors or inaccuracies.
I will not and cannot be held liable for any actions you take as a result of anything you read here.
Conduct your own due diligence, or consult a licensed financial advisor or broker before making any and all investment decisions. Any investments, trades, speculations, or decisions made on the basis of any information found on this channel, expressed or implied herein, are committed at your own risk, financial or otherwise.
MGC (Micro Gold Futures) – Bullish Breakout & Long Trade Setup |MGC (Micro Gold Futures) – Bullish Breakout & Long Trade Setup | Complete Technical Analysis
Description:
MGC (Micro Gold Futures) is showing a potentially strong bullish structure, with price action indicating improving buyer strength and the possibility of further upside momentum. The market has been building a clear structure around important support and resistance levels, and the recent price movement suggests that buyers are attempting to take control.
From a technical-analysis perspective, the key focus is on the support zone, breakout area, resistance level, and confirmation of bullish momentum. If price continues to hold above the important support area and successfully breaks and closes above the nearby resistance, it could provide confirmation for a potential long/buy setup.
For a safer entry, traders can wait for a confirmed breakout followed by a successful retest of the broken resistance as support. This can help reduce the risk of entering during a false breakout. If the bullish structure remains intact, the next resistance levels can be considered as potential profit-taking or target areas.
📈 Long Setup
- Market: MGC – Micro Gold Futures
- Bias: Bullish / Long
- Entry: Preferably after bullish confirmation and breakout/retest
- Stop Loss: Below the relevant swing low or major support zone
- Target 1: Previous resistance / nearby high
- Target 2: Next major resistance zone
- Target 3: Extended bullish target if momentum continues
🔑 Important Levels
Support: The major support area is important for maintaining the bullish structure. A strong reaction from support can indicate continued buyer interest.
Resistance: Resistance is the key level that buyers need to overcome. A confirmed breakout with strong momentum can increase the probability of continuation.
Breakout Confirmation: Avoid chasing a candle that has already moved sharply. A candle close above resistance and a retest can provide stronger confirmation.
📊 Trade Management
Once price moves in favor of the trade, consider protecting the position by moving the stop loss toward breakeven or using a trailing stop according to your risk-management plan. Avoid risking more than a small, predefined percentage of your trading account on a single setup.
⚠️ Risk Disclaimer
This is a technical-analysis idea, not a guaranteed trade signal or financial advice. Futures trading, including MGC, involves significant risk and leverage. Always confirm the setup with your own analysis, use proper position sizing, and define your stop loss before entering a trade.
COT 101 · Lesson 02 — Why the Hedgers Are the Smart Side
🔵 WHERE THE NAME COMES FROM
The COT report was born in the agricultural markets. The CFTC needed to know what the big grain players were doing — and the biggest players were farmers and grain merchants protecting their harvests. That is what "commercial" means in this report: a business with a real interest in the physical commodity. Not a trader. A gold miner, a farmer, an airline, a refiner.
🔵 HEDGING IS INSURANCE, NOT OPINION
A farmer sells futures against the crop still in the ground. He locks in today's price, because he needs to know what he will get paid — his business depends on it. An airline buys futures against next year's fuel. A gold miner sells futures against next quarter's production. None of them is predicting where price goes. They are transferring risk to whoever wants it.
That whoever is the speculator. The hedger pays a small premium (the basis), and the speculator carries the risk. That is the deal: insurance, not forecast.
🔵 WHY THAT MAKES THEM THE "SMART" SIDE
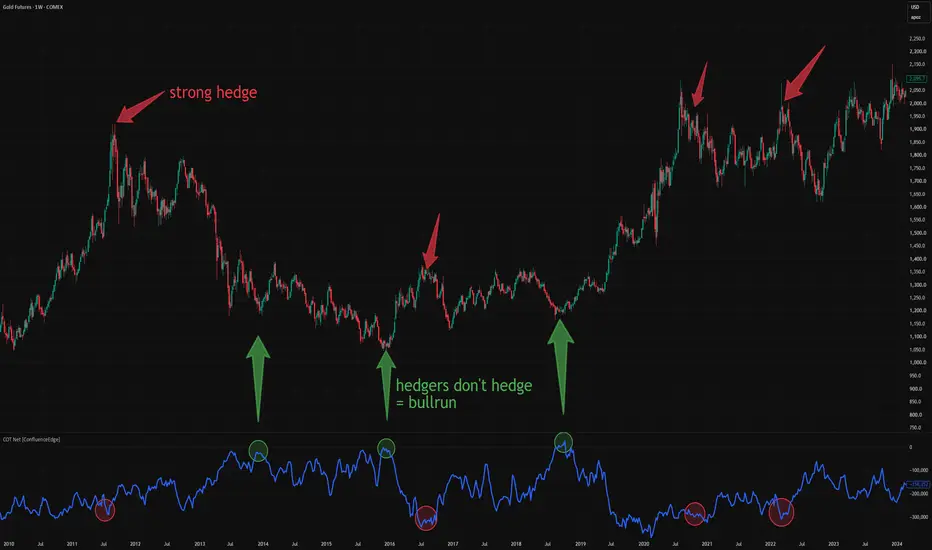
Not because they are smarter. Because their positions are driven by business necessity, not by sentiment. When prices are high, it is good business to sell forward — so they sell. When prices are low, it is good business to buy forward — so they buy. They are systematically on the opposite side of emotion. That is why studies of COT data have shown commercials as a group to be profitable over decades, while the trend-following crowd pays for their positions.
🔵 THE CONTRARIAN READ
So when commercials are heavily short, read it exactly like this: prices are high enough that producers want to lock them in. That is supply coming into the market — and it is a warning, not a crash signal. Short into strength is business, not bearish.
And when commercials are heavily long, prices are low enough that producers and consumers want to secure them. Buying weakness is business, not bullish.
Same rule as Lesson 01, applied: the hedger sells strength and buys weakness. You read that against the price, not with it.
🔵 WHAT THE CHART SHOWS
On this chart you see the two markers: where commercial net positioning hit its extreme short and gold was near its highs, and where commercial positioning was extreme long while gold sat at the lows. Same pattern, repeated over years.
Next lesson: the other side of the trade — non-commercials, the trend-following crowd, and why their extremes mark turning points.
Educational content only. Not investment advice.
Futures vs Stocks: Differences Every Trader Should UnderstandFor more than two decades, a stock trader placing four or more day trades within five business days needed at least $25,000 in account equity to keep trading. That threshold no longer exists. FINRA, the regulator overseeing US brokerage firms, replaced it in June 2026 with a standard tied to actual market exposure.
Futures and stocks both let a trader express a view on price. The two markets stay regulated, financed, and taxed differently even when the view is identical.
Most comparisons stop at leverage, noting futures require less capital and stocks require more, then listing margin percentages and trading hours. Fewer explain why that capital difference exists on a structural level.
📌 Ownership vs. Exposure: What You're Actually Buying
(Illustrative purposes)
A share of the company represents a fractional legal claim on the company, including dividends if declared and a claim on assets if the company is ever liquidated.
A Micro E-mini S&P 500 futures contract represents none of that. It obligates the holder to a cash settlement based on where the S&P 500 index sits at expiration, multiplied by $5 per index point. No shares change hands.
For example, an investor buying Apple shares is acquiring ownership. A trader buying S&P 500 futures is acquiring exposure to a price, with no ownership attached.
📌 Capital Efficiency: The Same Exposure, a Fraction of the Capital
Notional value = Futures price × Contract multiplier
Scenario: Assume the S&P 500 futures contract trades at a hypothetical price of 5,500 (used here for illustration rather than a live quote).
One Micro E-mini S&P 500 contract carries a notional value of 5,500 × $5, or $27,500. Reaching roughly $500,000 of exposure would take about 18 contracts at that price.
Buying that same $500,000 of exposure through S&P 500 index shares or an ETF requires close to the full amount in cash or eligible collateral. The futures position reaches it with a smaller fraction as margin.
Capital efficiency is a separate idea from leverage. Leverage describes how much price exposure a given amount of capital controls; institutions lean on futures because the same market view gets expressed with far less capital tied up in any single position.
Worth noting: Capital efficiency and leverage are related but distinct. Leverage describes exposure per dollar, while capital efficiency describes how little collateral reaches a given exposure.
📌 Short Selling and Trading Hours
Shorting a stock means borrowing shares from a broker first, a process that depends on availability and carries a cost that shifts with demand.
Short selling a futures contract involves no borrowing step. A trader sells to open a position the same way a trader buys to open one, with identical mechanics either direction. This is one reason macro traders gravitate toward futures when a bearish view needs to move fast.
Trading hours diverge just as sharply. US stocks trade primarily from 9:30 a.m. to 4:00 p.m. Eastern; US index futures trade nearly around the clock, Sunday evening through Friday afternoon.
Worth noting: The short-selling symmetry in futures is a structural feature of the contract, separate from the amount of risk involved. Losses on a short futures position carry no built-in cap.
📌 Futures vs. Stocks at a Glance
(Illustrative purposes)
📌 Tax Treatment and the Pattern Day Trader Rule
One difference between stocks and futures is how profits and losses may be treated for tax purposes. In many cases, futures use a different tax framework than stocks, which can sometimes be beneficial for active traders.
Stock investments are generally taxed based on how long the position was held. Shorter-term trades and longer-term investments may be treated differently.
Another difference historically involved day trading rules. For more than twenty years, active stock traders in the United States who made frequent same-day trades were required to maintain a minimum account balance to continue day trading.
That rule changed in 2026. Instead of relying on a fixed account size requirement, the newer framework focuses more on the actual level of market exposure and risk being taken in the account.
These day trading restrictions applied only to stock trading accounts and never applied to futures accounts.
📌 Key Takeaways
Stocks represent ownership; futures represent contractual exposure to a price with no ownership attached.*
* A Micro E-mini S&P 500 contract's notional value equals the futures price multiplied by the $5 contract multiplier.
Shorting a stock requires borrowing shares; shorting a futures contract uses the same mechanics as buying one.*
* FINRA eliminated the fixed $25,000 PDT equity threshold in June 2026, replacing it with a standard based on actual market exposure.
📌 Final Thoughts
Stocks and futures give traders access to the same markets, but they work in very different ways.
Buying a stock means owning a piece of a company. Trading a futures contract means gaining exposure to price movement without owning the underlying asset.
Neither is better than the other. They simply offer different advantages, risks, and trading mechanics.
Understanding the differences can help traders choose the right tool for their strategy rather than forcing every strategy into the same instrument.
– Team Plus500
📌 Disclaimer
IMPORTANT: Trading in futures and options carries substantial risk of loss and is not suitable for every investor. The valuation of futures and options contracts may fluctuate rapidly and unpredictably, and, as a result, clients may lose more than their original investments. In no event should the content of this website be construed as an express or implied promise or guarantee by or from Plus500US Financial Services LLC that you will profit or that losses can or will be limited in any manner whatsoever. Market volatility, trade volume, and system availability may delay account access and trade executions. Past results are no indication of future performance. Information provided in this correspondence is intended solely for informational purposes and is obtained from sources believed to be reliable. Information is in no way guaranteed. The trading of futures is available through Plus500US Financial Services LLC d/b/a Plus500, a Futures Commission Merchant registered with the US Commodity Futures Trading Commission and a member of the National Futures Association (NFA ID number 0001398). Plus500US Financial Services LLC is a wholly-owned subsidiary of Plus500US Inc. Trading privileges subject to review and approval. Not all applicants will qualify. Information collected on account applications will be used to verify an applicant’s identity, as required under Federal law.
Long trade
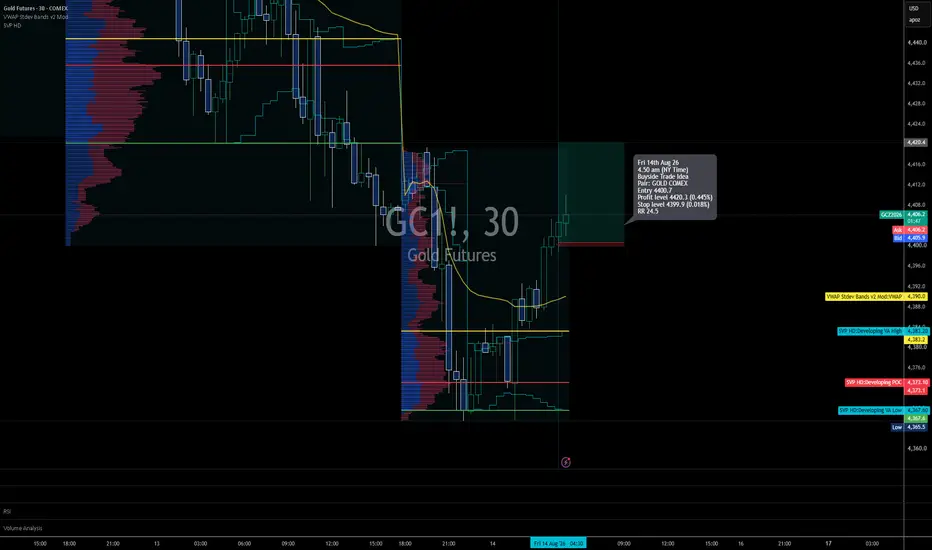
GOLD COMEX — SRL Buyside Trade Idea
Friday 14 August 2026
Entry time: 4:50 AM NY Time
Direction: 🟢 Buyside
Timeframe: 30-minute
Entry: 4400.7
Stop: 4399.9
Target: 4420.3
Potential return: +0.445%
Risk: 0.018%
RR: 24.5R
SRL read
Gold has recovered strongly from the lower developing-value structure around 4367–4383 and reclaimed both VWAP and the higher-volume profile area. The 4400 area now acts as the immediate decision/reference zone. The long is effectively looking for the reclaim to hold and for price to continue rotating back toward the upper distribution around 4420.3.
Indicator context
VWAP Stev: price has reclaimed VWAP near 4398.9, supporting a return toward higher value.
Volume Profile: the move has progressed from the lower-developing VA/POC area into a thinner overhead structure, leaving room for expansion. Developing POC: around 4373, well beneath entry, showing how far price has already migrated away from lower value. Developing VA High: around 4382.8, now reclaimed.
Heikin Ashi / price structure: momentum has shifted from the prior markdown into a sequence of higher lows and stronger bullish candles.
Risk
The main weakness is the extremely tight 0.8-point stop. With Gold futures, normal volatility can easily probe below 4399.9 even if the broader idea remains correct. So, the 24.5R is attractive, but it depends on the 4400 reclaim holding almost immediately.
Final read
We assume a buyside continuation setup after Gold reclaimed lower value and VWAP.
SRL Status: 🟢 Buyside active
Invalidation: 4399.9
Target: 4420.3
Planned RR: 24.5R
MAP → RECLAIM → SHIFT → DISPLACE → PAY
@SNAPTradingFramework
Gold Futures: Upward MomentumGold Futures hit a new local high on Friday, but upward momentum has eased somewhat at the start of this week. Currently, we locate the price in a corrective upward move. There’s still some immediate upside potential, but this should clearly stall below resistance at $4917 and transition into renewed selling. On the other hand, in our alternative scenario, Gold Futures could see significantly stronger (corrective) gains and make a move above resistance at $4917 (probability: 25%).
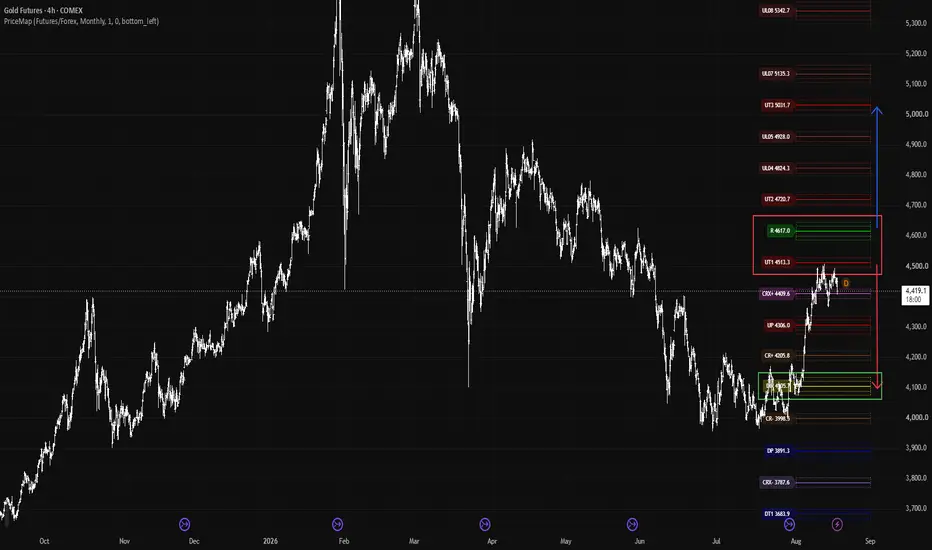
GC Obtained the Objective Target - What's Next?GC has completed its initial objective target from the M DIR 4106 trading 2APMDs to 4513. IF the MKT is good, a held trade of the PYC 4504 will tee up a test of the R level at 4617 and WHAT IF higher.
4617 defines the regime for the balance of the month, and is the line in the sand for the current regime. A held trade over the figure is a sign of strength and is not one to fade.
However, under the current conditions the expectation for slowing in the momentum within the zone of 4504 - 4617 is to be expected as we head into the SETTLEMENT PHASE of the month.
A break of 4410, on negative price structure tees up a retest of 4306 initially and a WHAT IF scenario to the month's open at 4107.
Keep it tight, and good luck.
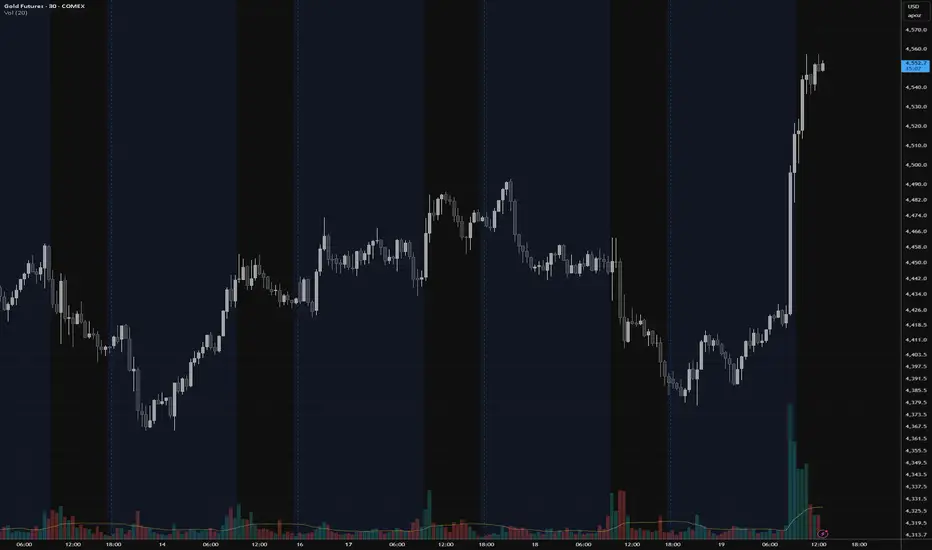
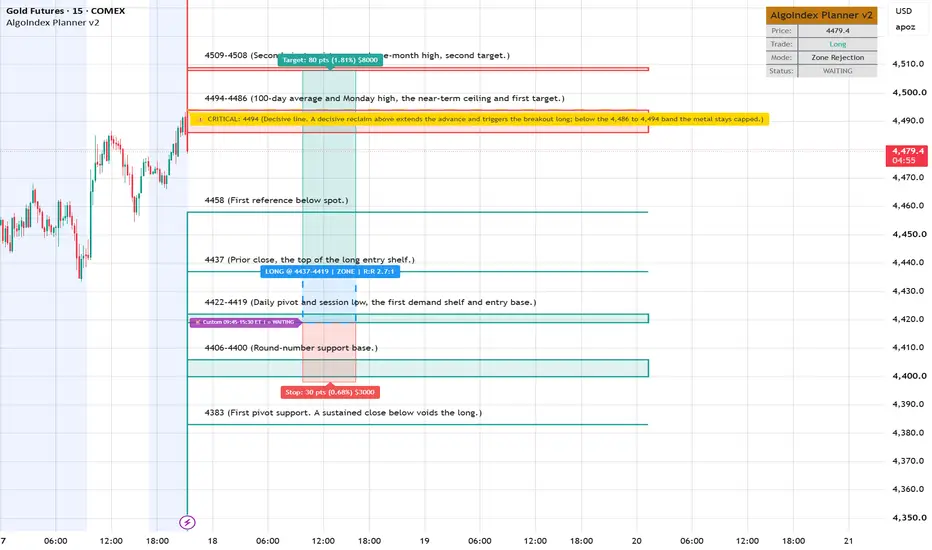
Gold (GC) Analysis, Key-Zones, Setup for Tue (Aug 18)Bias: Gold closed Monday firmly higher, with the December front month near 4,473.7, up about 0.82 percent from Friday's 4,437.3 close after a run to 4,486.5 and an orderly pullback that held the upper half of the range. The driver was a fresh Middle East escalation that lifted the safe-haven bid and pushed crude sharply higher, reinforced by a soft dollar at two-month lows and a weak US data run that keeps the rate-cut path in play. Structure is constructively bullish, with price above the 5, 20, and 50-day averages and a strengthening trend reading, but the metal is capped directly beneath the 100-day average near 4,486.7, exactly where Monday's high was rejected. Short-term momentum is stretched, so the higher-probability path is a shallow pullback that holds support before the next leg, and the 4,486 to 4,494 band is the line that decides whether the advance extends. The bias stays higher while the safe-haven catalyst persists and the 4,419 to 4,437 shelf holds.
Resistance:
4,486 to 4,494 (Monday high and 100-day average, near-term ceiling)
4,508 to 4,509 (second pivot resistance and 1-month high)
4,558 to 4,562 (momentum-extreme reference and third pivot)
4,621 (200-day average)
4,693 (13-week high)
Support:
4,458 (first reference below spot)
4,437 (prior close)
4,419 to 4,422 (daily pivot and session low, first demand shelf)
4,400 to 4,406 (round-number support base)
4,383 (first pivot support)
4,330 (second pivot support)
Primary Setup: The preferred play is a long on strength, entered on a controlled pullback into the 4,419 to 4,437 shelf, with a structural stop below 4,398. Targets sit at 4,472 to 4,486, then 4,508 to 4,509, then 4,558 to 4,562, for a risk-to-reward of roughly 1:1.3, 1:2.4, and 1:4. A sustained close below 4,383 voids the long premise. The conditional alternate is a breakout long on a decisive reclaim above 4,494, targeting 4,508 then 4,561. Traders should stand aside inside the 4,437 to 4,486 middle zone with no catalyst into Wednesday's Federal Reserve minutes, and note that a confirmed Middle East de-escalation would cut the safe-haven premium.
Can Gold Futures Outperform Surging Bond Yields?Geopolitics and Sovereign Geostrategy
Central banks aggressively purchase physical gold to diversify their sovereign reserves. Geopolitical friction in the Middle East heightens global supply chain vulnerability. Sanction risks drive non-Western nations toward tangible, un-sanctionable assets. Gold futures allow institutional desks to hedge against sudden geopolitical escalation. Sovereign entities use derivatives contracts to anchor national financial stability. Strategic reserve management increasingly relies on liquid futures markets. This strategic positioning insulates emerging economies from foreign currency volatility.
Macroeconomics and Financial Markets
Global bond yields recently surged to multi-year highs. The 30-year Treasury yield reached a nineteen-year peak. Elevated interest rates traditionally increase the opportunity cost of holding metal. Yet, gold futures maintain remarkable resilience near historic levels. Major investment banks like Wells Fargo project gold targeting four thousand nine hundred dollars per ounce. Persistent inflationary pressure fuels ongoing interest in gold futures contracts. Derivatives provide traders with necessary capital efficiency through leverage.
Exchange Management and Business Models
Futures exchanges generate robust revenues through transaction fees and data licensing. Market operators like CME Group continuously expand their global clearing services. Leadership teams focus heavily on risk management and strict capital requirements. Modern management models prioritize continuous liquidity and operational uptime. Exchange corporate cultures cultivate rapid technological adaptation and innovation. Clearing houses adjust margin requirements dynamically during extreme market volatility. These resilient business models capture value regardless of market direction.
High-Tech Integration and Science
High-frequency algorithms execute millions of gold futures transactions daily. Distributed ledger technology improves settlement transparency across international markets. Advanced predictive analytics help traders model complex macro relationships. Scientific breakthroughs also expand physical gold utilization in high-tech manufacturing. Miniaturized electronics require specialized gold wire bonding for conductive reliability. Patent filings reflect growing interest in gold-based micro-conductors and sensors. Technological demand provides a steady fundamental floor for the commodity.
Cybersecurity and Quantum Defense
Financial exchanges face relentless state-sponsored cyber threats daily. Robust cybersecurity architectures protect order books from malicious manipulation. Exchanges implement zero-trust security frameworks to safeguard sensitive transaction data. Patent analysis highlights heavy investment in quantum-resistant encryption protocols. Securing derivatives trading platforms remains vital for global financial stability. Vault monitoring systems utilize advanced biometric access control technologies. Data integrity ensures institutional trust in digital futures contracts.
Pharmaceutical Applications and Biotech Innovation
Physical gold links directly to modern pharmaceutical and medical research. Gold nanoparticles enable targeted drug delivery systems in cancer therapy. Biotech companies patent gold-based diagnostic strips for rapid pathogen detection. High-precision medical manufacturing relies on pure physical gold supplies. Industrial consumption in healthcare binds biotech innovation to raw commodity markets. Gold futures allow pharmaceutical manufacturers to hedge critical material costs. This scientific bridge reinforces gold's essential utility beyond monetary speculation.
GOLD: A Superposition at $4,400 — Which State Collapses First?My own system is printing Sell on the weekly and Strong Buy on the monthly at the
same time. Same indicator, same data, opposite conclusions. Below are all three
timeframes exactly as my panel printed them, with what each one is actually saying.
Every probability stays open. I am not predicting. I am showing the frame I hold
and the condition that would end it.
ONE RULE ABOVE EVERYTHING: THE MARKET IS ALWAYS RIGHT
The market is not an opinion I get to argue with. It is the measurement. When
price closes, that is the observation, and the observation is never wrong. Only my
model can be wrong. Every rule below exists to make my model cheap to update and
expensive to defend.
Three things follow from that, and they are the only advice I would give anyone:
1. Write the invalidation before the entry. If you cannot name the exact close that
would prove you wrong, you do not have a thesis, you have a hope. Write it down
before you risk anything, because once the position is on, your memory becomes your
defence lawyer.
2. Never argue with a close - only with your own model. Losing money is expensive.
Defending a broken idea is far more expensive, because it also costs you the next
ten trades. When price disagrees with you, updating is the cheap option. Take it
early.
3. Size it so that being wrong is survivable and boring. A position that makes you
check the screen at three in the morning has already taken something the market
cannot pay back. If the stop hurts, the size is wrong, not the stop.
MONTHLY - THE THESIS LIVES HERE
Strong Buy, high conviction. First target 5,194.98, about 18 percent up, at roughly
1.5 reward to risk. Ceiling marked at 5,626.8, distance 27.89 percent.
This is the only timeframe allowed to hold the thesis. It is too slow to time an
entry and it does not pretend otherwise.
WEEKLY - THE ENTRY DECIDES HERE, AND IT SAYS NO
Sell, and the aggregate reading has gone slightly negative. First target sits below
the current price. Floor line 3,901.3, distance 11.33 percent.
Same system, one step down, opposite answer. This is not a contradiction and it is
not a refutation of the monthly. It is a timing statement. A long-term view is
allowed to sit through a weekly pullback. What it is not allowed to do is rewrite
its story afterwards and pretend it always said that.
DAILY - RIGHT DIRECTION, UNUSABLE TRADE
Strong Buy again. First target 4,492.3, only 2.1 percent away - and reward to risk
about 0.4.
Read that last number again, because it is the whole lesson. The direction is
correct and the trade is still garbage. A 0.4 reward to risk means risking more
than twice what I stand to make. Correct and profitable are not the same word.
WHY THE THREE DISAGREE - AND WHY THAT IS NORMAL
In physics, measuring position precisely destroys precision in momentum. They
cannot both be sharp at once. Charts behave the same way.
The more precisely I time an entry, the shorter the window I measure, and the less
that window can say about a trend. The more confident I want to be about the trend,
the longer the window, and the worse it is at timing. Monthly up, weekly down,
daily up is three measurement bases returning three valid answers.
The monthly carries the thesis. The weekly decides the entry. The daily is noise
until the weekly close agrees. Before that close, gold is not going up or down in
my model - it holds both, with different weights. Almost every large loss I have
watched, including my own, came from collapsing that early: picking one branch
because holding two felt uncomfortable, then spending weeks defending the pick.
WHAT 10,000 TICKS ACTUALLY MEANS
I will say it plainly: anything under 10,000 ticks is scalping.
That is not a price target, it is a unit of measurement. On COMEX GC one tick is
$0.10 per ounce, so 10,000 ticks is about $1,000 per ounce of travel. Below that
distance I am not looking at a trend, I am looking at noise with good lighting.
Above it, structure has to exist, because price cannot travel that far without
leaving evidence of who was buying and where.
NEVER READ GOLD ALONE
Gold, silver, copper, platinum, palladium - I read the whole metals complex.
Correlated systems share information, so measuring one tells me something about the
others. When the complex moves together, the move has a body behind it. When gold
runs while silver and copper refuse, the correlation has broken, and that is the
earliest warning available.
I also refuse to read price in isolation from the cost of money. If I could keep one
macro input and throw the rest away, I would keep rates - metal is priced against the
cost of holding money. That one relationship explains more gold behaviour than any
oscillator I have ever tested.
And my system is allowed to say nothing. When the inputs are not agreeing it returns
neutral on purpose, rather than manufacturing a call. A system that always has an
opinion is not confident, it is lying to you.
WHAT COUNTS AS AN OBSERVATION
Not a touch. A close. I mark where price actually turned, repeatedly, and I never
buy the first touch of a level - a touch is a rumour. I wait for the reclaim close:
price closing back above the level is buyers proving they won, not hoping. Then at
least 2:1 reward to risk, or I pass. That single filter is why the daily setup above
does not get my money today.
THE QUESTION THAT COMES UP MOST
When does it move? My answer has not changed: it moves once you cut your loss.
That sounds harsh. It is mechanical. Price travels toward where positions have to be
closed, and the last cluster of stops sitting under an obvious level is fuel. If you
place your stop where everybody else placed theirs, you are not managing risk, you
are supplying it. You are not standing outside the system observing it. You are part
of what gets measured.
THE STATE THAT ENDS THIS THESIS
A weekly close that loses the level the move launched from, or the metals complex
splitting apart while gold pushes alone. Either observation and the thesis is gone -
I stand down and re-mark. A thesis with no exit condition is not a thesis, it is a
wish.
One honest note on the framing. Superposition, measurement, entanglement - I use
these as a thinking tool, not as a claim that quantum physics moves price. I use
them because they force the two habits that actually pay: holding several outcomes
at once instead of one, and letting the measurement decide instead of me.
One honest note on the framing: this is a thinking tool, not a claim that quantum
physics moves price. I use it because it forces the two habits that pay - holding
several outcomes at once, and letting the measurement decide instead of me.
WHAT COMES NEXT
Gold is one instrument. The same three-timeframe reading works everywhere, and the
disagreements between the three are just as informative. Long term I am watching
Nasdaq toward 26,000 - I will not defend that number here, it needs its own chart
and its own invalidation level. Crypto, crude oil, currencies and a few others are
queued the same way. I will run them one instrument at a time, same structure:
monthly thesis, weekly entry, daily execution.
CLOSING NOTE
The indicators on these charts are my own private scripts and they stay private, but
nothing about the reading is hidden - the method above IS the method.
Every level named above is falsifiable on a close, which is the only standard I think
analysis should be held to. If the close does not arrive, the thesis does not exist.