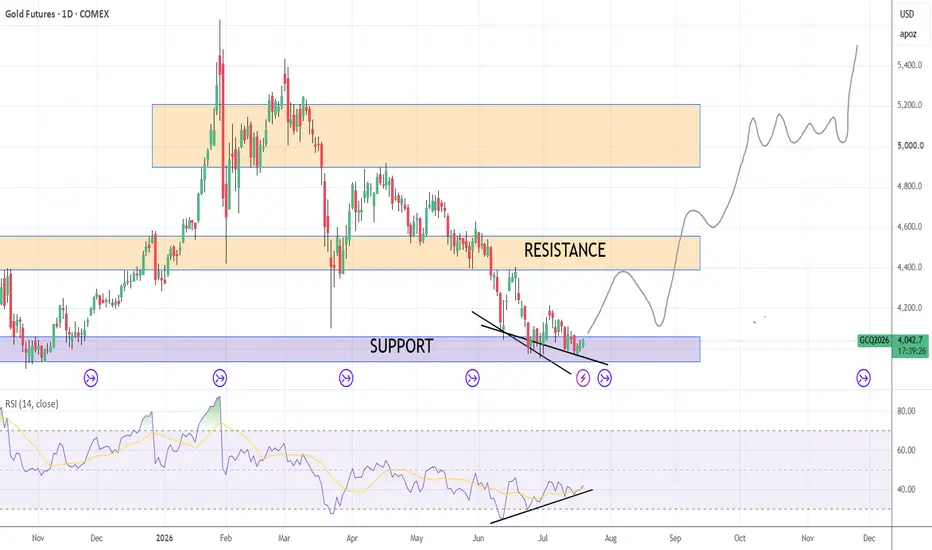
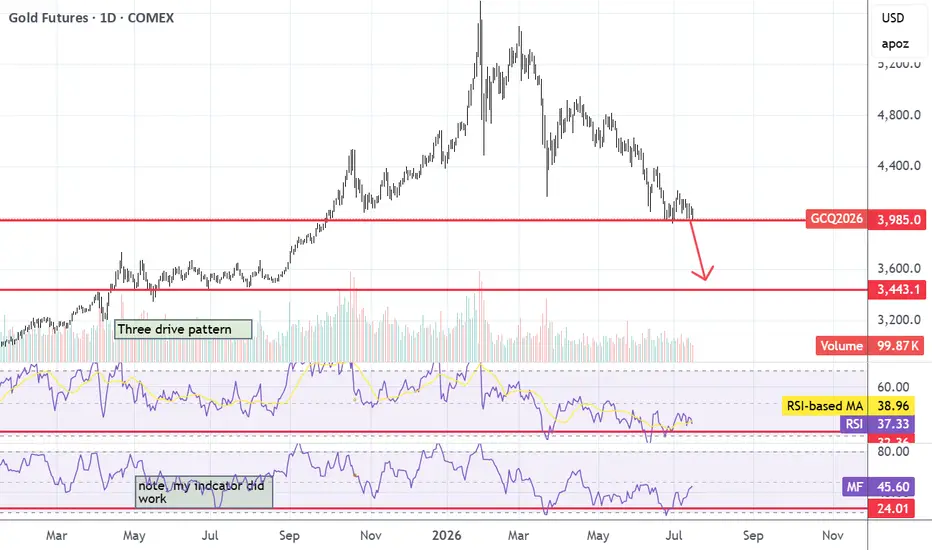
Gold and silver are trading higher today This is July 22nd and they wanted you to see a follow up from yesterday because gold and silver has gone higher but it may be coming to a support area and perhaps some correction lower even though I think gold and silver are going to go higher than what you see right now but there's some patterns that you have to be aware of and that's in the video and there's a little blurb of stuff on space X and I talk about that
In-depth trading ideas
GOLD: Still Trending Lower! Is It At The Bottom Yet?In this Weekly Market Forecast, we will analyze Gold for the week of July 20-24th.
Gold is widely expected to lean bearish this coming week, as prices struggle to hold the critical $4,000 per ounce floor. Downward pressure is being driven by a stronger US dollar and expectations of a hawkish Federal Reserve, even though easing US inflation numbers recently tried to provide some support.
These same price levels are in Premium of the range. So, I am on the look out for the sell model to form on the highlighted fib levels.
Enjoy!
May profits be upon you.
Leave any questions or comments in the comment section.
I appreciate any feedback from my viewers!
Like and/or subscribe if you want more accurate analysis.
Thank you so much!
Disclaimer:
I do not provide personal investment advice and I am not a qualified licensed investment advisor.
All information found here, including any ideas, opinions, views, predictions, forecasts, commentaries, suggestions, expressed or implied herein, are for informational, entertainment or educational purposes only and should not be construed as personal investment advice. While the information provided is believed to be accurate, it may include errors or inaccuracies.
I will not and cannot be held liable for any actions you take as a result of anything you read here.
Conduct your own due diligence, or consult a licensed financial advisor or broker before making any and all investment decisions. Any investments, trades, speculations, or decisions made on the basis of any information found on this channel, expressed or implied herein, are committed at your own risk, financial or otherwise.
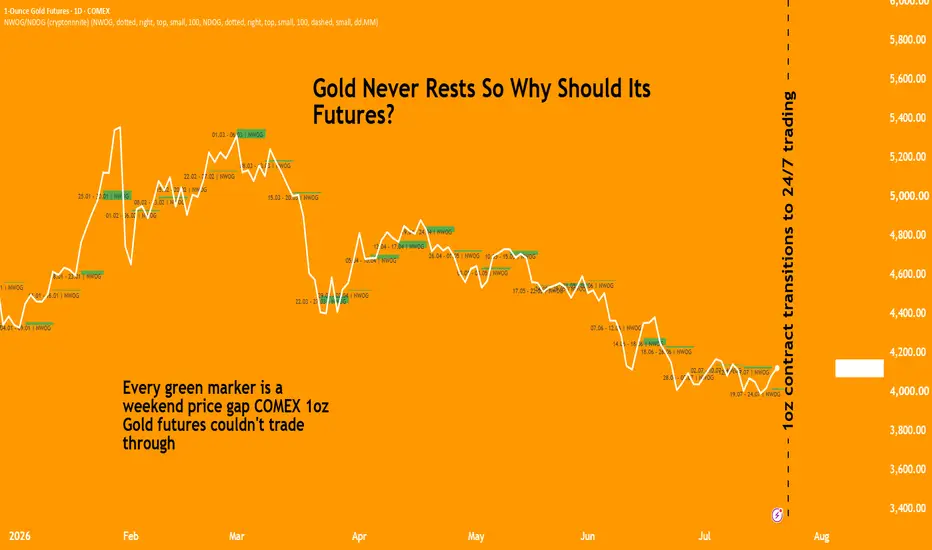
Gold Never Rests So Why Should Its Futures?Although COMEX gold futures trade almost continuously during the week, they halt every Friday afternoon and do not reopen until Sunday evening. Yet events that move gold markets can and do occur over the weekend.
While Gold priced through crypto tokenized gold and CFD style products can continue trading during that closure, the most active gold trading venue – CME futures – remains closed.
COMEX has listed gold futures since December 1974, and this weekend break has existed throughout that period. Continuous gold feeds are a much more recent development, creating a structural mismatch between prices that continue to move and regulated derivatives that remain closed.
Any repricing during that window appears as a gap when futures resume trading, leaving no regulated and liquid trading venue between Friday's close and Sunday's reopen.
Against this backdrop, CME is enabling 24/7 trading for its 1oz gold futures , scheduled to launch on 24 July 2026, reducing the roughly two-day blind spot to a brief maintenance window.
What the Data Reveals About Gold Weekend Gaps
To measure the impact of the weekend futures market closure, we analysed 44 weekends between October 2025 and July 2026, comparing the Friday close with the Sunday reopen and tracking whether each gap was filled during the following trading week.
Most gaps were modest, remaining within roughly 0.5% in either direction. The clear outlier was late January 2026, when gold reopened 2.91% lower, the largest gap in the sample. That move followed news of Kevin Warsh's appointment as the next Federal Reserve Chair.
It also shows why weekend price action has become more common. Market-moving policy announcements increasingly land over the weekend. Recent examples span monetary policy, trade measures and geopolitical developments, leaving investors exposed to moves they cannot hedge.
Of the 44 gaps, 42 (95.5%) were filled during the following trading week, leaving only two open.
The 17 April 2026 gap, at 1.03%, has remained open for more than three months, despite closing within 0.02% of filling in late April. The 10 July gap, more recent and larger at 1.08%, has stayed further from filling, closing 0.87% short at its nearest approach.
The Gap Understates Weekend Risk
The Friday-close-to-Sunday-reopen gap captures only two price snapshots and says nothing about gold's path in between.
Comparing it with the full weekend high-low range shows how much risk the headline gap can miss. In late January 2026, the 2.91% gap sat against a 4.84% weekend range. In late February, a 1.96% gap compared with a 4.18% range, more than twice as large.
Across the sample, the weekend range exceeded the two-point gap in 43 of 44 weeks, including ordinary low-volatility periods. The understatement was therefore structural rather than driven by a few large moves. This represents potential market moves that gold traders never had access to before.
Why This Matters
The same pattern exposes the weakness of relying on proxies such as XAUTUSD. Thin, catch-up-prone trading may show where gold has moved, but not at the depth required for genuine price discovery.
CME's 24/7 1oz gold futures replace that blind spot with regulated weekend volume, reducing the roughly two-day closure to a brief maintenance window.
Continuous trading won't make weekend risk disappear, but it does bring that risk into view earlier, when traders can still act on it.
The 17 April gap, still open after more than three months, illustrates the distinction. A move that persists for that long behaves more like a lasting shift in market direction than a temporary blip.
Granular Weekend Hedging using Micro Contracts
The weekend of 30 January 2026 provides a useful example of what continuous access would have meant in practice.
Consider a trader who held a long position in CME 1oz gold futures as of 30/Jan. Under the old framework, the position could not be modified between Friday's COMEX close and the Sunday reopen. The 2.8% decline would therefore have produced a mark-to-market loss of USD 137 before the trader could respond.
The same weekend also shows the upside a short position could have captured, using XAUTUSD as a proxy for how gold would have traded through the closure.
Gold declined steadily into Saturday 31 January, allowing a short to be closed that afternoon at roughly a 2.3% profit. After a brief rebound, prices resumed falling, giving scope to re-enter and close a second short by the Sunday reopen.
Trading both moves would have produced a materially better result than holding a single short across an inactive weekend.
Each CME 1oz Gold futures (1OZ) contract represents 1 troy ounce, one-hundredth of the standard 100-ounce GC contract. This contract requires maintenance margin of ~$200 making them a capital efficient instrument to obtain granular exposure to gold prices.
This content is sponsored.
MARKET DATA
CME Real-time Market Data helps identify trading setups and more effectively express market views. If you have futures in your trading portfolio, you can check out on CME Group data plans available that suit your trading needs at tradingview.com/cme .
DISCLAIMER
This case study is for educational purposes only and does not constitute investment recommendations or advice. Nor are they used to promote any specific products, or services.
Trading or investment ideas cited here are for illustration only, as an integral part of a case study to demonstrate the fundamental concepts in risk management or trading under the market scenarios being discussed.
GC is sideways, looking for +811 tick bullish push. GC one hour time frame is in a sideways range. The market is falling
from the top of the range to the bottom. When or if the market falls
to the bottom of the range. I am looking for a new bullish trend back
towards the top of the range price point 4137.6 about +811 ticks above.
When or if the bullish trend starts, it will be a good idea to look for up
Fibonacci set ups to the one hour future resistance price point 4137.6
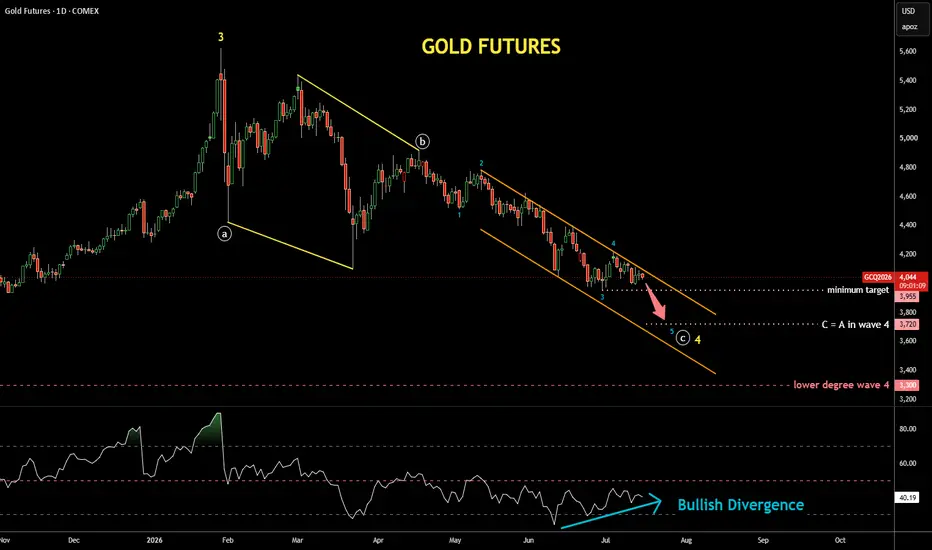
Gold Update [24JUL2026]: More Complex Wave 4 Appeared wave 4 has built more complex flat correction
its second spike neither broke above the trend channel not above RSI crucial 50 level
wave 5 of (C) of ((4)) could be underway
Minimum target: $3,955 to retest valley of wave 3
Normal target: $3,720 where ((C)) = ((A))
Trend's support: $3,500
Strong support: $3,300 where lower degree wave 4 had bottomed
Can Gold Futures Save Portfolios from Stagflation?Geopolitical Flares and Macroeconomic Pressure
Gold futures recently scaled above $4,130 per ounce amidst escalating global uncertainty. Traders aggressively price in persistent inflation and shifting central bank monetary policy. Geopolitical conflicts in the Middle East drive crude oil prices higher. This energy spike revives grave stagflation fears across major world economies. Consequently, institutional investors treat gold futures as an essential systemic hedge.
Geostrategic fractures transform physical gold into a vital national asset. Central banks in emerging markets rapidly stack bullion reserves. They actively reduce reliance on foreign fiat currencies and debt instruments. Additionally, global trade disruptions reinforce gold's role as neutral liquidity. Gold futures provide sovereign treasuries and private funds unmatched hedging flexibility during crises.
High-Tech Mining and Patent Innovation
Modern gold discovery relies heavily on high-tech innovation and patent filings. Mining conglomerates use artificial intelligence to map subsurface mineral reserves. Advanced sensor patents allow precise underground ore grading and robotic extraction. Furthermore, patented bio-leaching technologies revolutionize metal recovery from low-grade deposits. These technological breakthroughs lower cash costs while reducing environmental impact.
Scientific research reveals expanding applications for physical gold in high-tech manufacturing. Micro-electronics require ultra-thin gold wiring due to exceptional electrical conductivity. In medicine, gold nanoparticles drive targeted drug delivery systems in oncology. Pharmaceutical firms patent gold-based chemical compounds to treat complex inflammatory diseases. Consequently, industrial demand extends far beyond traditional jewelry and investment bullion.
Enterprise Risk, Cybersecurity, and Corporate Strategy
Volatile commodity markets demand sophisticated corporate leadership and resilient business models. Mining equipment providers actively transition into high-margin digital software entities. Executive teams leverage algorithmic risk management tools to navigate rapid price swings. Meanwhile, cybersecurity remains paramount for digitized metal trading platforms. Enterprise defense systems protect global derivative exchanges against sophisticated cyber threats.
Ultimately, gold futures reflect the convergence of technology, macroeconomics, and geopolitics. Structural shifts in energy prices continue to challenge central bank targets. Yet, technological innovation lowers extraction costs while opening new industrial markets. Corporate leaders must manage volatile cost structures while securing critical mineral reserves. Gold futures remain the ultimate barometer of global economic stability.
Trading GOLD with Volume Profile and VWAP - XAUUSD Trade IdeaIn this video, I show you how I use Volume Profile and VWAP to gain an edge when trading XAUUSD. I'll walk you through my current market analysis, explain what I'm looking for, and share a trade idea you can use as part of your own trading plan.
Any gold bulls still out there?Just a scenario for people to think about (and check later against what happened).
I see signs of strength in gold. The Iran conflict never changed by view on the role of gold in the world. Actually, the increased deficit spending resulting from the conflict further strengthens it. There will be a lot of coded speeches from the Fed and posturing, but they aren't actually able to raise rates significantly due to the debt and interest load. Signs of economic weakness are evident recently and the Fed will be itching to re-commence tinkering with Treasury yields downwards and printing money to monetise the debt.
Also the Weekly MACD is slowly curving up towards the zero line, showing the potential for a multi-month up-trend to commence. RSI is showing an up-trend while the price is showing lower lows, this is always a sign of slowing momentum and sometimes a sign of an impending reversal of the local trend.
So this is my call, up-trend and a bounce off USD4400-4600 resistance, followed by a stronger move up towards historic highs and beyond. Time will tell. I have still been buying gold miners and haven't sold any due to the conflict.
It is actually funny, a silver and gold developer that I own just reached my average purchase buy-in price after being up 200%+ at times about 7 months ago. The difference? When I bought in silver was below USD35/oz and today silver is USD60/oz. They have been drilling and improving the properties, so they are valued far lower today than when I bought in. Each silver equivalent ounce is in their resource is only valued at USD$0.20/oz (market cap / ounces) which is crazy cheap considering the eventual net profit margin on mining these ounces will likely be more than 50% ($60/2 = $30/oz net margin). So I am very comfortable holding this equity. If you can pick up your favourite silver miner / developer today for the same price as you could in March 2025, that sounds like a good deal to me. If you cannot find any, check out AVM.
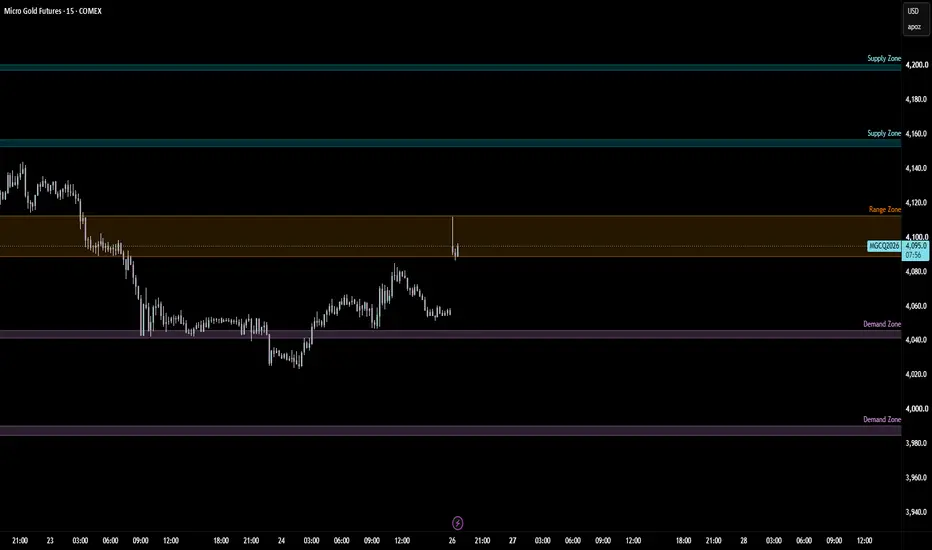
Gold (MGC) | Is This the High of the Week?After three strong days of bullish momentum, Gold is starting to show signs that buyers may be losing steam. I'm not ready to call the top just yet, but we're reaching an area where I want to see how price reacts before making my next move.
One thing that immediately caught my attention was the large gap down at today's session open. Rather than chasing price lower, I'd actually like to see the market retrace and attempt to fill that gap. The reaction there should tell us a lot about who is in control heading into the Asian Kill Zone.
📈 Bullish Scenario
If buyers reclaim the gap, break above yesterday's high, and can hold those gains, then the uptrend remains intact and I'll continue respecting the bullish momentum.
📉 Bearish Scenario
If price fills the gap but fails to reclaim value, followed by a break and acceptance below 4116, I'll view that as confirmation that sellers are beginning to take control. That would align with the larger bearish structure I'm seeing on the higher timeframes.
I'm trying not to let my higher timeframe bias force trades. Yes, the Daily chart still favors the bears overall, but the intraday trend has been making higher highs and higher lows all week. Until that structure breaks, patience is key.
For me, this session isn't about predicting the next move—it's about letting the market confirm which side is winning the auction.
Key Levels I'm Watching
🔹 Yesterday's High – Bullish continuation if reclaimed and accepted above.
🔹 4116 – Bearish confirmation if price breaks below and accepts underneath.
🔹 Session Gap – The reaction here could determine the direction for the remainder of the week.
As always, I'm letting price come to me rather than chasing moves. The best trades usually come after confirmation, not anticipation.
What's your bias heading into Thursday? Are you expecting continuation higher, or do you think this rally is running out of steam?
#Gold #MGC #Futures #PriceAction #OrderFlow #TradingView #COMEX #MarketStructure #ICT #SmartMoney #DayTrading #NOFOMOTrading
Gold (MGC) Weekly Outlook | Will Sellers Stay in Control?Heading into a new trading week, I'm trying to stay focused on what price is doing, not what I want it to do.
Last week started with strong bullish momentum, but everything changed after Wednesday's New York session. Sellers stepped in aggressively, and by Friday Gold had closed back below the midpoint of the week's expansion. That tells me buyers lost control of the auction at higher prices.
On the bigger picture, Gold is still trading below the Monthly Point of Control (POC), which keeps my higher-timeframe bias leaning bearish. However, I'm not interested in chasing shorts into support.
My ideal scenario would be a retracement back toward the 4085-4120 area, where we have a 1H Fair Value Gap and previous areas of value. If sellers defend that zone, I'll be looking for confirmation of another move lower.
On the other hand, if buyers can reclaim 4120 and hold above it, I'll become much more cautious with any bearish ideas. That would suggest the market may be shifting back toward bullish continuation.
Key Levels This Week
🔹 Resistance: 4085-4120 (1H Fair Value Gap)
🔹 Support: Friday's Low
🔹 Major Psychological Level: 4000
Things I'm Watching
Month-end order flow and possible portfolio rebalancing.
Wednesday's Federal Funds Rate announcement, which is likely to be the biggest volatility event of the week.
Whether rallies are accepted above value or rejected back into the recent downtrend.
I'm not trying to predict exactly where Gold will finish this week. My goal is to identify where buyers or sellers become aggressive and let the market confirm the next move.
Trade the reaction, not the prediction.
#Gold #MGC #Futures #PriceAction #OrderFlow #TradingView #MarketStructure #FairValueGap #COMEX #DayTrading #NOFOMOTrading
Gold – Long-Term Perspective **Gold – Long-Term Perspective 📉📈**
Today, I'm taking a look at **Gold from a higher-timeframe perspective**.
The **Weekly (W1), Daily (D1), and H4 charts** are all currently showing a **bearish order flow**. From a structural point of view, the broader trend remains to the downside.
However, it is important to keep the recent price action in perspective. Since its **all-time high**, Gold has already declined by **around 30%**. After such an extended move, a corrective recovery is a realistic possibility before the higher-timeframe trend continues.
From the **H4 chart**, my preferred scenario is a move higher toward the **buy-side liquidity** resting above the current price. This area is particularly interesting because it could offer a location where sellers step back into the market, potentially leading to another leg lower.
Looking at the **weekly timeframe**, significant **sell-side liquidity** still remains below the current market. This supports the idea that any bullish move in the coming weeks may be corrective rather than the beginning of a new long-term uptrend.
For the next few weeks, **long setups** are therefore worth monitoring, provided the market confirms them through price action. Once the buy-side liquidity has been taken, I will reassess whether the market is preparing for another move lower.
As always, I don't predict the market—I prepare for scenarios and let price action determine the next move.
**Disclaimer:** This post is provided for informational and educational purposes only and does not constitute financial or investment advice, or a recommendation to buy or sell any financial instrument. All analyses reflect my personal market view only. Every trader and investor should conduct their own research and apply appropriate risk management.
#Trading #Gold #XAUUSD #ICT #PriceAction #Liquidity #OrderFlow #MarketStructure #SmartMoney #TechnicalAnalysis #SwingTrading
Gold Update 16JUL2026: Final Drop Silver updated chart inspired me to redraw the gold chart
Overall, the trend is similar, however the internal structure is different
It's ABC zigzag in wave 4
Wave B is irregular flat
Final wave C is almost done as 4 out of 5 waves are completed
RSI confirms that count
Wave 5 of C of (4) should retest the valley of wave 3 at $3,955 as a minimum
Next target for this final drop is located at $3,720 where wave C is equal to wave A
Downtrend's support is below at $3,600
Lower degree wave 4 is further down at $3,300
Gold Long Idea at a Key Support ZoneGold is currently trading once again near a technically important support zone between approximately 3,930 and 4,005. This area has already been tested several times on the chart and previously produced strong reactions from buyers.
The current pullback into this zone could therefore offer an interesting long opportunity. At the same time, the Volume Profile shows increased trading activity around the current price, which adds further importance to the 4,000 area.
However, I would not enter blindly at support. I would first wait for clear bullish confirmation.
🟢 Bullish Scenario
If Gold manages to defend the support zone and moves back above approximately 4,025–4,050, a recovery toward the higher resistance levels could develop.
Potential target areas:
First target: 4,050–4,075
Second target: 4,125–4,160
Main target: 4,205–4,235
The area between approximately 4,205 and 4,235 represents the next major resistance zone. Stronger selling pressure could appear there, so securing partial profits at the intermediate targets may be reasonable.
Potential Long Confirmations
A long entry would become interesting to me only after at least one of the following signals appears:
A strong lower wick inside or below the support zone
A bullish reversal candle
A false breakout below 4,000, followed by a quick reclaim
A clear candle close above 4,025–4,050
An aggressive entry could be considered directly after a strong reaction from support. A more conservative approach would be to wait for a confirmed reclaim of the nearby resistance levels.
🔴 Bearish Scenario and Invalidation
If Gold clearly loses the support zone and closes below approximately 3,930, the long idea would be invalidated for the time being.
In that case, the downward move could continue toward 3,900 or lower. A stop-loss should therefore be placed clearly below the support zone and adjusted according to the trader’s position size and risk tolerance.
Conclusion
Gold is currently trading at an important decision area. As long as the zone between 3,930 and 4,005 holds, a bullish recovery toward 4,150 and potentially 4,205–4,235 remains possible.
I am waiting for a clear reaction from buyers and would not enter the market without confirmation.
This is not financial advice. Always wait for confirmation and manage your risk carefully.
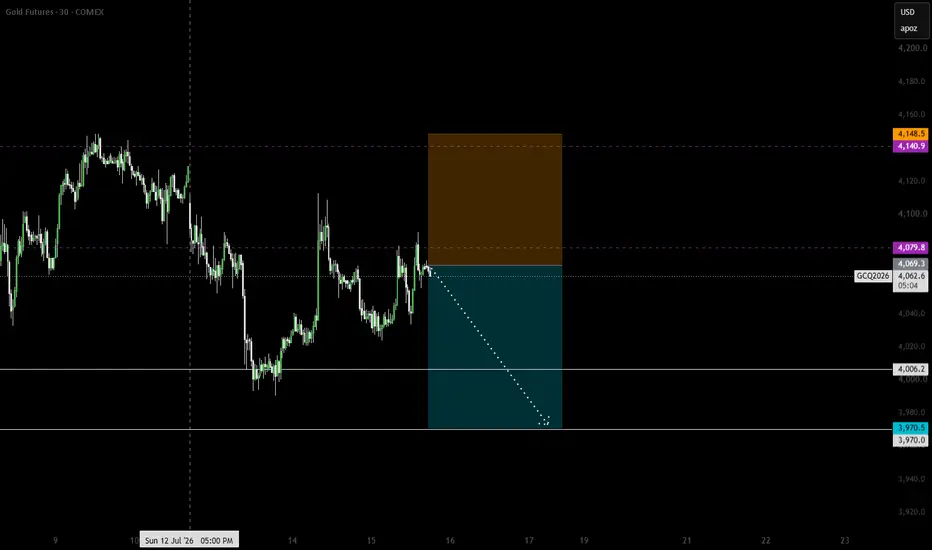
GOLD Short
GOLD SELL MARKET ORDER : 4069.3
Stop Loss: 4148.5
Remove risk/Partials @ : 4006.2
Take profit: 3970.5
Trade Plan: Short
Bias: BEARISH short term.
Entry reason: Price has tested key TPO area. The short-term valuation tool also shows temporarily overvalued against the index
Stop Loss: Above nearest high.
First target: 4006.2
GOLD at a Make-or-Break Zone: $4,230 Breakout or Drop Toward $3,Gold Futures are currently trading near a critical decision area on the 4-hour chart.
Price is moving around $4,070, caught between a major support zone at $3,940–$3,990 and an important resistance area between $4,200 and $4,230.
The Volume Profile also shows significant trading activity around the current price region. This could lead to choppy price action and false breakouts, which is why I am waiting for clear confirmation before entering.
Bullish Scenario 🟢
For the bullish scenario, I want to see a strong 4H candle close above $4,230.
My bullish roadmap:
Breakout above $4,200–$4,230
Successful retest of the breakout zone
Continuation toward $4,300–$4,320
Higher targets around $4,450–$4,500
Major resistance near $4,680–$4,720
A clean breakout followed by a successful retest would provide the strongest bullish confirmation.
The bullish setup would weaken if price immediately falls back below $4,200 after the breakout.
Bearish Scenario 🔴
If Gold gets rejected before reaching the resistance zone or loses the support area between $3,940 and $3,990, sellers could regain control.
My bearish roadmap:
Rejection from the current area or the $4,200–$4,230 resistance
Retest of the $3,940–$3,990 support zone
Confirmed 4H close below $3,940
Continuation toward $3,880–$3,900
A breakdown below the support zone could trigger further selling pressure, especially if the retest from below fails.
Key Levels to Watch
Above $4,230: bullish confirmation with potential toward $4,300 and later $4,450.
Between $3,940 and $4,230: consolidation and increased risk of false breakouts.
Below $3,940: bearish confirmation with potential toward $3,880.
Final Thoughts
Gold is currently sitting between two major technical zones, so patience is more important than prediction.
My bias remains neutral until the market confirms its direction:
4H close above $4,230 = bullish.
4H close below $3,940 = bearish.
I would avoid entering in the middle of the range and wait for either a confirmed breakout or breakdown.
Which level do you think Gold reaches first: $4,300 or $3,880? Let me know in the comments. 👇
This analysis is for educational purposes only and does not constitute financial advice.
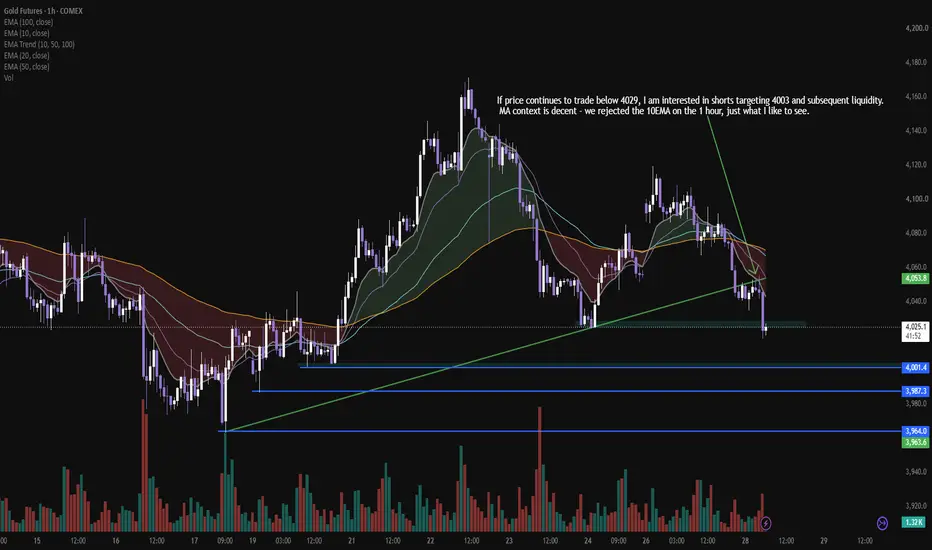
Gold this week Went into yesterday with a long bias above about 4100, what not given valid entry signals. Sat on hands most of the day yesterday, as EMA's fanned out to the downside last night, took some shorts into the PM session resulting in partials/small wins.
Continuing short bias today as MA's continue to fan out and demand is sliced through. Open to shorts below 4030 - I take entries on 1 min and 5 min flag breaks, targeting below demand and liquidity notated here.