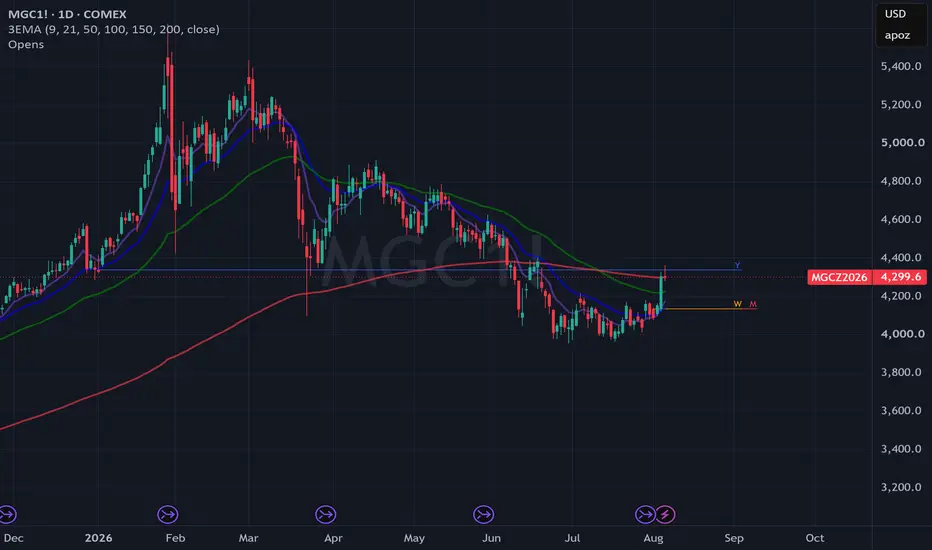
Can the Precious Metals Maintain Momentum?Since the highs recorded in January of this year, the precious metals broadly have seen selling pressure after an almost extreme run to the upside. There was large central bank buying of Gold and Silver during the run higher and the momentum carried these markets to all time record highs. Looking at Gold since the top in January, prices have grinded lower similar to the rate of the rise, and prices have seemed to stabilize. The question is now lingering for the Gold market asking if the market will be able to see a rebound in the current Fed and interest rate environment or if prices are poised to move even lower.
Understanding the fibonacci retracements can help you see potential support and resistance levels where the market has traded in the past. Looking at a weekly Gold chart from the January highs to the breakout point from August of 2025, the price sold off to the 0.236 retracement point and found at least some support, and the prices have moved higher from there. Along with that, the 50-day exponential moving average had acted as a floor in this market going back to October of 2023, and now Gold is trading right at that level after closing below it a few days ago. This point is now acting as congestion, and traders will be watching this level this week with all of the economic data on jobs and inflation being released in the coming days.
If you have futures in your trading portfolio, you can check out on CME Group data plans available that suit your trading needs tradingview.com/cme/
*CME Group futures are not suitable for all investors and involve the risk of loss. Copyright ยฉ 2023 CME Group Inc.
**All examples in this report are hypothetical interpretations of situations and are used for explanation purposes only. The views in this report reflect solely those of the author and not necessarily those of CME Group or its affiliated institutions. This report and the information herein should not be considered investment advice or the results of actual market experience.
Micro Gold Futures (Apr 2028)
No trades
No trades
In-depth trading ideas
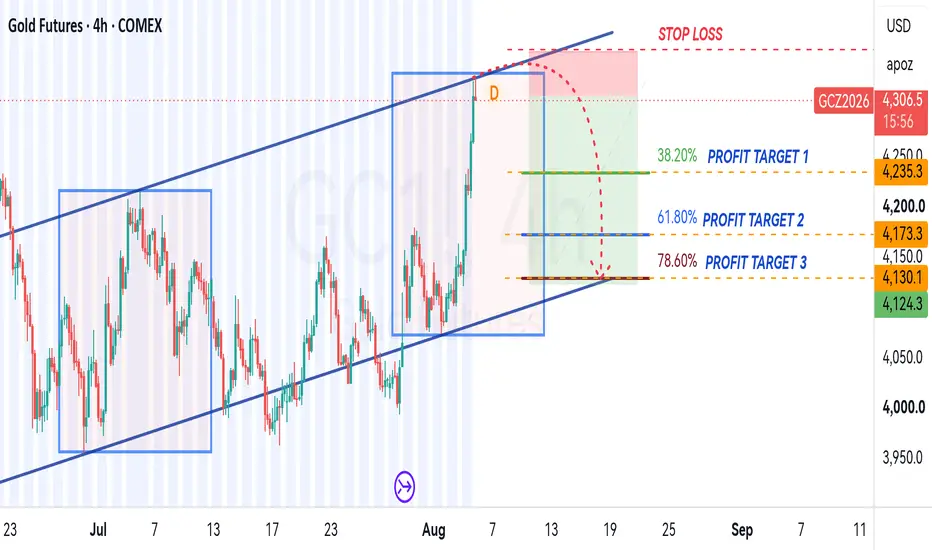
๏ปฟSELL GOLDToday's bullish move was monumental, we now expect a major drop of price since price action reached a strong supply zone,.. the current high is also a Potential Reverse Zone of a Harmonic Bearish Crab on the daily TF which is good confluence, we anticipate distribution to the downside....As always emphasized,..manage risk to protect equity..
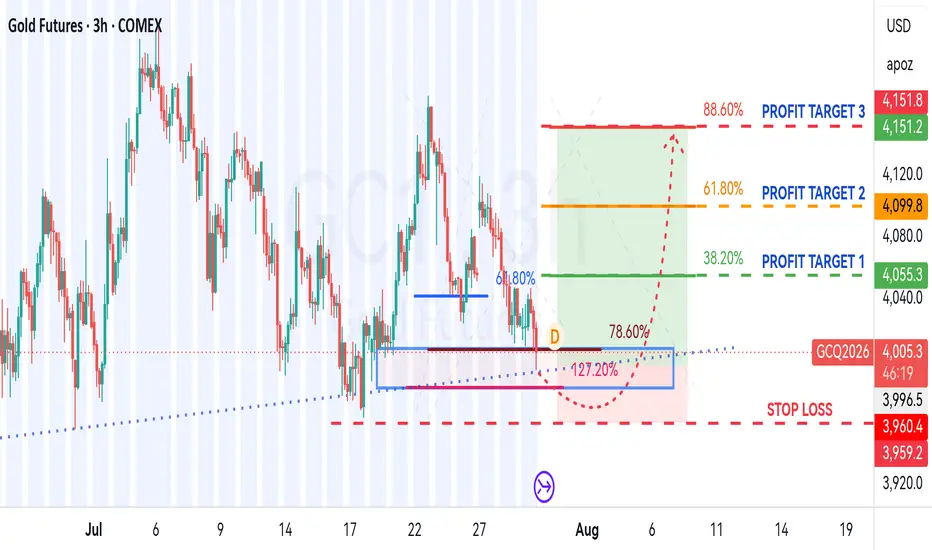
GC Long โ Gold's dip into support looks like a gift before the nGold is printing a clean, aligned 4h bullish pullback that has reset its extension nicely. Recent headlines highlight a pause in the rally as Fed minutes loom, but analysts favor buying the dip into the current support zone. The structure provides a solid risk-reward setup to position for the next leg higher, though conviction is slightly tempered by the upcoming binary event.
๐ Entry: 4106.8
๐ Stop: 4065.6
๐ฏ Target: 4180.2
โ๏ธ R:R: 1.78
XAUUSD ANALYSIS
ANALYSIS
---
# GC1! | PDH Liquidity Sweep into HTF Bearish Order Block | ICT Premium Distribution Model
## Executive Summary
Gold Futures (GC1!) have rallied into a high-probability institutional reaction zone after engineering liquidity above the **Previous Day High (PDH)**. The liquidity sweep occurred within a premium dealing range, where multiple bearish confluencesโincluding SMT divergence, a Higher Timeframe Bearish Order Block, and an unmitigated Fair Value Gapโsuggest the potential for a bearish repricing.
Rather than anticipating a reversal, this setup focuses on waiting for bearish confirmation before targeting internal sell-side liquidity.
**Market Bias:** Bearish while price remains below the Higher Timeframe Bearish Order Block.
---
# Market Narrative
Price delivered a strong bullish expansion from the Previous Day Low (PDL), rebalancing inefficiencies before attacking **Previous Day High (PDH)** liquidity.
The raid above PDH occurred directly beneath the **Previous Week High (PWH)** and inside a Higher Timeframe Bearish Order Block, placing price in a premium environment where institutional distribution frequently occurs.
Adding further weight to the bearish thesis, **SMT divergence** developed during the rally, indicating weakening relative strength despite the continued advance.
If sellers reclaim control through a lower-timeframe Market Structure Shift (MSS), the market may begin delivering toward internal sell-side liquidity and nearby bullish imbalances.
---
# Institutional Confluences
### Previous Day High (PDH) Liquidity Sweep
The market engineered liquidity above PDH before showing signs of rejection.
Liquidity raids above previous session highs frequently precede institutional reversals when supported by additional confluences.
---
### Previous Week High (PWH)
The weekly liquidity objective remains overhead, placing price within a higher-timeframe premium zone where institutional selling interest may increase.
---
### Higher Timeframe Bearish Order Block
Price is trading beneath a significant bearish Order Block that previously initiated an impulsive decline.
This remains the primary institutional supply zone and serves as the invalidation area for the bearish thesis.
---
### Bearish Fair Value Gap (FVG)
The current rally has mitigated a bearish Fair Value Gap, providing an efficient location for institutional sell orders to enter the market.
---
### SMT Divergence
SMT divergence developed during the advance, indicating that correlated markets failed to confirm the new highs.
This intermarket divergence often precedes a liquidity reversal when combined with premium pricing.
---
### Premium Pricing
The market is currently trading in premium relative to the active dealing range, favoring short opportunities over aggressive buying.
---
# Trade Plan
## Entry
**Entry:** **4,149.90**
The preferred short entry follows:
* PDH liquidity sweep
* Rejection inside the Bearish Fair Value Gap
* SMT divergence
* Lower-Timeframe Market Structure Shift (MSS)
* Bearish displacement confirming institutional selling
---
## Stop Loss
**Stop Loss:** **4,178.90**
A sustained acceptance above this level weakens the bearish narrative and increases the probability of continuation toward the Higher Timeframe Bearish Order Block and Previous Week High liquidity.
---
## Profit Targets
### TP1 โ Internal Sell-Side Liquidity (SSL)
**Target:** **4,107.30**
The first objective aligns with Internal Sell-Side Liquidity and a nearby bullish Fair Value Gap, making it a logical area for partial profit-taking.
---
### TP2 โ 4084
A successful break below Internal SSL increases the probability of price seeking liquidity resting beneath the **Previous Day Low (PDL)**.
---
EXTENDED
### TP3 โ Higher Timeframe Bullish Order Block
Should bearish momentum accelerate, price may continue into the Higher Timeframe Bullish Order Block near the **4,055โ4,060** region, completing a deeper discount rebalance.
---
## Risk-to-Reward
* **Entry:** 4,149.90
* **Stop Loss:** 4,178.90
* **TP1:** 4,107.30 (Internal SSL)
* **TP2:- 4084
**Projected Risk-to-Reward:** Approximately **7:1**, offering favorable asymmetry if bearish confirmation develops.
---
# Liquidity Roadmap
### Completed
* โ
Previous Day Low expansion
* โ
Bullish Displacement
* โ
Previous Day High Liquidity Sweep
* โ
Premium Repricing
* โ
Bearish FVG Mitigation
* โ
SMT Divergence
### Monitoring
* โณ Lower-Timeframe MSS
* โณ Bearish Displacement
* โณ Internal SSL Raid (TP1-TP2)
* โณ Previous Day Low (TP3)
---
# Alternative Scenario
If buyers establish sustained acceptance above **4,178.90** and continue through the Higher Timeframe Bearish Order Block, the bearish setup becomes invalid. In that scenario, the market may continue expanding toward **Previous Week High (PWH)** liquidity before encountering the next significant area of institutional supply.
---
# Trade Checklist
* โ
Higher Timeframe Bias
* โ
Premium Pricing
* โ
Previous Day High Liquidity Sweep
* โ
Previous Week High Overhead Liquidity
* โ
SMT Divergence
* โ
Higher Timeframe Bearish Order Block
* โ
Bearish Fair Value Gap
* โ
Defined Risk
* โณ Lower-Timeframe MSS Confirmation
* โณ Bearish Execution Trigger
---
# Conclusion
This setup reflects a high-confluence ICT premium distribution model, where price engineers liquidity above the **Previous Day High** within a premium dealing range before testing a Higher Timeframe Bearish Order Block. The combination of **PDH sweep, SMT divergence, Bearish Fair Value Gap mitigation, and institutional supply** creates a compelling bearish framework. Execution remains conditional on lower-timeframe confirmation, with downside objectives focused on **Internal Sell-Side Liquidity**, the **Previous Day Low**, and the Higher Timeframe Bullish Order Block.
---
**Educational Disclaimer**
This analysis is provided solely for educational purposes to illustrate ICT and Smart Money Concepts. It presents a scenario-based market interpretation and should not be considered financial advice or a prediction of future price movement. Always wait for confirmation and apply disciplined risk management before entering any trade.
GOLD (GC): Fib Confluence & Declining VolumeFollowing a strong macro rally to $5,508, Gold (COMEX Futures) has entered a corrective wedge phase. Price action has pulled back directly into a major confluence zone on the daily chart, testing whether long-term buyers will step back in to defend the primary uptrend.
Key Technical Factors
38.2% Fibonacci Level ($4,004.9): Price is interacting directly with the first major macro Fib retracement level from the $1,571 base run.
Structural Support ($3,947 โ $4,098): Confluence between horizontal demand and dynamic trendline support.
Volume Profile & Contraction: Noticeable volume decay during the corrective channel descent, signaling selling momentum is drying up as price reaches lower liquidity pools.
Macro Trend Alignment: The long-term rising trendline and 200-day moving average remain intact just below current price levels.
Trade Execution Scenarios
Scenario A: Bullish Defense
Trigger: Daily reversal confirmation (e.g., pin bar / bullish engulfing holding above $3,947).
Target 1: $4,397.4 (Resistance / Lower high)
Target 2: $4,579.7 (23.6% Fib level)
Target 3: $5,508.9 (Macro Highs)
Invalidation: Daily close below $3,940.
Scenario B: Corrective Expansion
Trigger: Sustained daily close below $3,947 with an expansion in bear volume.
Target 1: $3,540.3 (50.0% Fib retracement)
Target 2: $3,289.3 (Major structural horizontal shelf)
Are you looking for a bounce off this 38.2% Fib zone, or do you expect a deeper pullback toward the 50% retracement? Drop your thoughts in the comments!
Take partial profits if you want to ruin your futureTaking partials is not inherently a better strategy unless the numbers actually show that it is. The reality is that, in general, the data shows exactly the opposite: reducing the size of a winning position halfway through, or even earlier, ends up hurting long-term profitability instead of improving it.
The logic is actually quite simple. When someone needs to determine where to take profits, the only thing they can really do is estimate the probability of price reaching a given target. Suppose someone does the work and their data shows that, on average, a certain target has a 70% probability of being reached. Perfect. That trader now has a logical place to set their take profit instead of choosing one that is completely random or based on feelings or intuition.
Now, what happens if they decide to take partial profits halfway there? If the original target was chosen because the statistics showed it was the optimal exit, then taking partials before reaching it also requires a statistical justification. Otherwise, the decision is no longer based on the same probabilistic framework used to choose the TP in the first place.
Seventy percent of the time, price will still reach the target, but it will do so with only half of the original position, while losing trades will still be full-size losses.
There is nothing in this framework, the most basic framework that exists in trading, that makes it reasonable to abandon half of a position halfway to the target just to lock in less profit.
We constantly hear traders say things like, "Price moves toward liquidity pools." Fine. If that is the natural path of price, then why would you want to arrive there with only half of your position, assuming reaching that area is already considered a high-probability event? From a numerical or expectancy standpoint, it makes absolutely no sense.
In reality, traders take partial profits as a psychological crutch, not because it generates higher returns. I am guilty of this type of behavior myself, I'm not going to lie, but I don't lie to myself. Actually, it's not that I take partial profits, because I never do. But sometimes I exit earlier because I "feel" something is about to happen, and then price ends up reaching the natural TP defined by the framework anyway.
Being able to withstand the turbulence between point A and point B while reducing risk is precisely what separates traders from one another. Some are masters at this and can add to winning positions or reduce risk by moving to breakeven or using a profit stop, without necessarily sacrificing their upside.
Taking partial profits has absolutely no numerical foundation unless the trader can statistically demonstrate that they improve the strategy. In practice, almost nobody does this. Most traders do it because it feels good, not because it is more profitable. If you expect someone to come forward and say, "I take partial profits because my data shows it's better", you probably won't find them, because the numbers overwhelmingly point in the opposite direction.
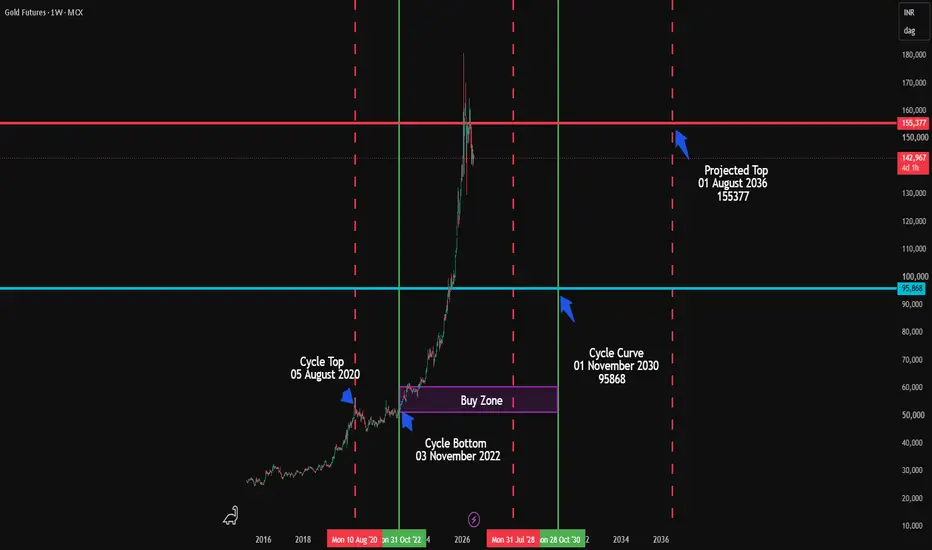
Gold Futures (MCX) Long-Term Cyclical ProjectionGold Futures (MCX) Long-Term Cyclical Projection & Macro Target Analysis (2016โ2036)
Description
This TradingView chart displays a weekly macro-cyclical analysis for Gold Futures (MCX), spanning historical data from 2016 through projected cycles up to 2036. The analysis utilizes vertical time markers and horizontal price levels to outline major cycle tops, bottoms, and long-term targets:
Asset & Timeframe: Gold Futures, 1-Week Chart (MCX), quoted in INR.
Historical Cycle Top (05 August 2020): Highlighted by a vertical dashed red line, marking a key structural high in the previous cycle.
Historical Cycle Bottom & Buy Zone (03 November 2022): Marked by a vertical solid green line around the 50,000โ60,000 price region (purple rectangle), identifying the macro consolidation and ideal accumulation zone prior to the exponential rally.
Mid-Cycle Curve (01 November 2030): Marked by a vertical solid green line pointing to a major horizontal reference level at 95,868 (cyan line).
Projected Cycle Top (01 August 2036): Indicated by a vertical dashed red line pointing to a horizontal resistance level at 155,377 (red line), outlining the macro peak target for the multi-year cycle.
Disclaimer
General Educational & Informational Purposes Only: The analysis, cycle projections, price targets, and indicators shown in this chart are for educational and informational purposes only and do not constitute financial, investment, trading, or legal advice.
Risk Warning: Trading spot commodities, foreign exchange (Forex), derivatives, and equities carries a high level of risk and may not be suitable for all investors. Past performance and historical cycle patterns are not guarantees or reliable indicators of future price performance.
No Solicitation: Nothing in this content should be construed as a buy or sell recommendation, or as a solicitation to buy or sell any financial asset or instrument. Always perform your own independent research and consult with a licensed financial advisor before making any investment decisions.
Gold โ Arc Cycle Outlook | Potential Rebound at Support ArcGold Futures (GC1!) is currently interacting with a Support Arc within the current Arc Cycle, where price is showing signs of respecting the underlying Time & Price structure.
The current market behavior suggests a potential rebound from this Support Arc. If this scenario remains valid, price is expected to continue toward the next Resistance Arc, while a failure to hold this level could shift the outlook toward the next Support Arc.
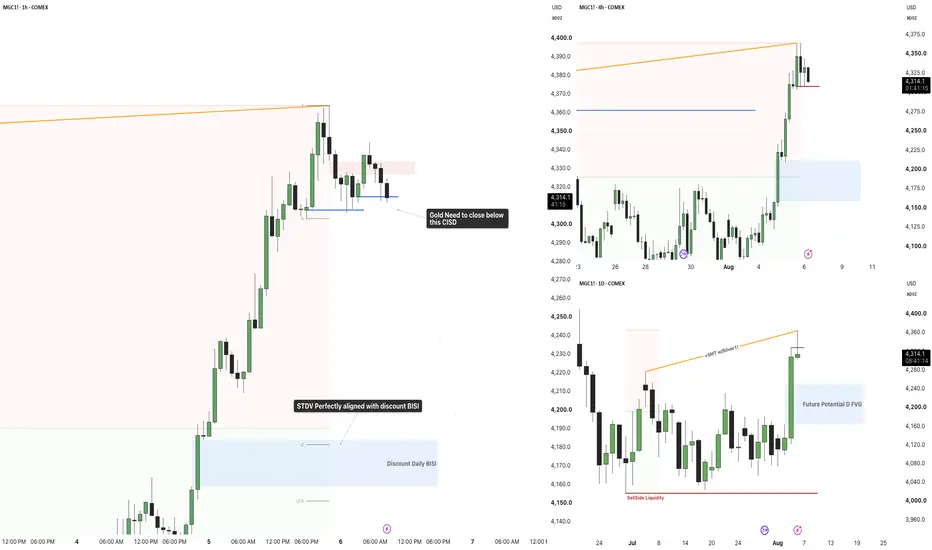
Gold Just Hit Premium Pricing, Is This Retracement Healthy?Gold remains bullish across the higher timeframes after a strong impulsive rally from discount pricing.
- Daily SMT divergence with Silver remains valid.
- Price has delivered a strong displacement from the Daily discount zone.
- The next higher-timeframe objective remains the premium liquidity overhead.
The broader trend has not changed.
What Happened?
After the impulsive rally, Gold has started to retrace from premium pricing.
This pullback is taking place after:
- Strong bullish displacement.
- Multiple higher highs and higher lows.
- Price reaching a premium dealing range.
On the 1H chart, price is now testing an important bullish CISD.
This level is likely to determine whether the current move is simply a healthy retracement or the beginning of a deeper correction.
What I'm Watching
Bullish Scenario
- H1 CISD continues to hold.
- Buyers defend the current discount area.
- Price resumes higher toward the recent highs.
Bearish Scenario
A decisive close below the H1 CISD would invalidate the current intraday bullish structure.
If that happens, I expect Gold to seek the Daily Discount BISI, which aligns closely with the -2 Standard Deviation, making it the next high-probability draw on liquidity.
๐ช๐ต๐ฎ๐ ๐ถ๐ ๐๐ผ๐น๐ฑ ๐ฑ๐ผ๐ถ๐ป๐ด?๐ช๐ต๐ฎ๐ ๐ถ๐ ๐๐ผ๐น๐ฑ ๐ฑ๐ผ๐ถ๐ป๐ด?
I don't trade gold, but I still keep an eye on it from time to time.
Since the **all-time high on January 29**, Gold has lost around **30%**.
What I find interesting is the current price action.
It follows a classic market pattern:
๐ญ. **๐ง๐ฟ๐ฒ๐ป๐ฑ ๐๐ผ๐๐ป**
๐ฎ. **๐๐
๐ต๐ฎ๐๐๐๐ถ๐ผ๐ป**
๐ฏ. **๐๐ผ๐ป๐๐ผ๐น๐ถ๐ฑ๐ฎ๐๐ถ๐ผ๐ป**
And this is exactly where Gold appears to be right now.
Since **June 21**, price has been consolidating โ moving up and down, essentially **seek and destroy**.
So what happens next?
Nobody knows.
Price could break out to the upside.
Or to the downside.
And even after the breakout, another question remains:
**Is it a Judas Swing โ or the beginning of a new trend?**
That's why, for me, this is a place to **do nothing and wait.**
No prediction.
No FOMO.
No forcing a trade.
Wait for the market to reveal its hand.
๐ฅ๐ฒ๐บ๐ฒ๐บ๐ฏ๐ฒ๐ฟ:
**Every move starts with a consolidation.**
The question isn't whether Gold will move.
**The question is which direction it will choose โ and whether the breakout is real.**
---
โ ๏ธ ๐๐ถ๐๐ฐ๐น๐ฎ๐ถ๐บ๐ฒ๐ฟ
This post documents my personal market analysis and trading observations.
It is **not financial advice, investment advice, or a recommendation to buy or sell any financial instrument**.
Trading involves substantial risk, and past performance does not guarantee future results.
๐๐ผ ๐๐ผ๐๐ฟ ๐ผ๐๐ป ๐ฟ๐ฒ๐๐ฒ๐ฎ๐ฟ๐ฐ๐ต ๐ฎ๐ป๐ฑ ๐บ๐ฎ๐ป๐ฎ๐ด๐ฒ ๐๐ผ๐๐ฟ ๐ฟ๐ถ๐๐ธ.
Gold Update [30JUL2026]wave 4 of wave C shows another peak which potentially shapes a triangle
this spike should keep below previous high of $4,171 to fit triangle's rule
The low of wave 3 as a target was eliminated as triangle would accumulate
enough bearish momentum to drop much lower
Other downside targets remain unchanged from previous update
RSI keeps Bearish position under the "waterline"
Bullish trigger is set at the bottom of wave 1 at $4,510
Trading GOLD with Volume Profile and VWAP - XAUUSD Trade IdeaIn this video, I show you how I use Volume Profile and VWAP to gain an edge when trading XAUUSD. I'll walk you through my current market analysis, explain what I'm looking for, and share a trade idea you can use as part of your own trading plan.
GC one hour hitting resistanceGC one hour is in a sideways range. The market is near the
top of the range. I am looking for one of two things.
1) The market to fall back down towards the bottom of the
range.
2) The market to break above the top of the range and
create a bullish trend.
Once the market gives the above information. I can bring
in Fibonacci to help with Entry, Stop & Limit prices
Breakout Zones MGC 15m / 28 JulyGold Range 15m
Waiting for a breakout of the current range.
- Breakout to the upside โ Long with TP at Supply Zone
- Breakout to the downside โ Short with TP at Demand Zone
Whatโs your bias on the next breakout?
Thanks to gold's volatility, a trade never lasts more than one day.
Drop a Boost if you like the idea and follow for daily setups ๐
Not financial advice โ for educational purposes only.
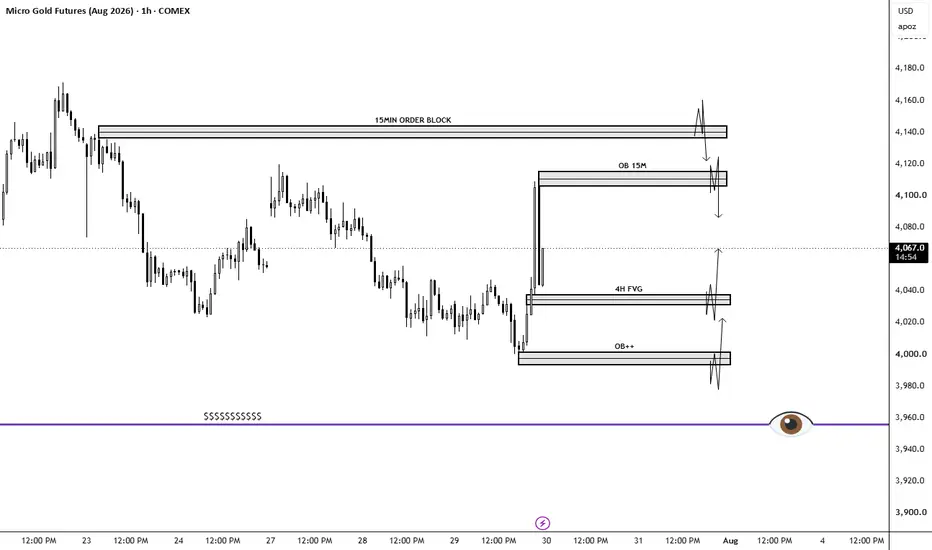
Gold Outlook: Smart Money SetupGold Outlook: Smart Money Setup
Gold has reached a major 15M Order Block, making this a key decision zone. A liquidity sweep above the highs followed by rejection could trigger a move toward the 4H Fair Value Gap and lower demand levels.
If buyers manage to hold above the supply zone with strong momentum, the bullish trend remains valid.
Bias: Bearish unless price confirms acceptance above the 15M Order Block.
Trade the confirmation, not the anticipation.
#Gold #XAUUSD #SmartMoney #SMC #ICT #TradingView #PriceAction #OrderBlock #FVG #Liquidity