HG (Copper) Continues to Favor More Upside Near TermCopper futures (HG #F) continue to trade within a bullish Elliott Wave structure, with price maintaining an incomplete three-swing sequence from the 6.2820 low. The current rally remains constructive, suggesting buyers are still in control. As long as Copper holds above the 6.2820 invalidation level, the path of least resistance remains to the upside. The broader Elliott Wave structure continues to favor higher prices before a larger corrective pullback develops.
The 60-minute Elliott Wave chart shows Copper advancing within black wave ((iii)). A push toward 6.858 should complete the current five-wave impulsive sequence in wave ((iii)). Once this move finishes, we expect a corrective pullback in at least three swings as part of wave ((iv)). This pullback should present another buying opportunity, provided it remains above the 6.479 swing low and, more importantly, above the 6.2820 invalidation level.
Looking beyond the near-term correction, the higher-timeframe Elliott Wave count continues to point higher. We expect the current advance to extend toward 6.981, which represents the equal legs target for red wave 1 within wave 3. Reaching this level would complete another important phase of the larger bullish structure before any meaningful correction takes place.
Overall, our Copper Elliott Wave forecast remains bullish. Any pullback in the coming hours is expected to find support in 3, 7, or 11 swings, keeping the broader trend intact. Until key support levels break, traders should continue to favor buying pullbacks, with 6.981 remaining the next major upside objective.
Micro Copper Futures (Sep 2029)
No trades
No trades
In-depth trading ideas
Will Copper Futures Dictate the Future of AI?Macroeconomic Signals and Market Drivers
Copper futures recently surged to fresh records, with the London Metal Exchange benchmark hitting an all-time high of $13,842 per metric ton. US COMEX pricing has pushed even higher in dollar-per-pound terms, reflecting the tariff-driven premium between the two markets. The U.S. ISM Manufacturing PMI hit 55.6 percent, its highest reading since May 2022 and a four-year high. Traders often view copper as an accurate barometer for global economic health. Rising demand drives robust market momentum across global derivatives exchanges. Investors flock to copper futures to capitalize on expanding industrial activity. The Federal Reserve, meanwhile, holds rates at an elevated 3.50 to 3.75 percent with a hawkish bias, so liquidity conditions remain tight rather than easing. Consequently, copper prices reflect strong real-world manufacturing demand worldwide despite that tighter backdrop.
Geopolitics and Critical Resource Security
Geopolitical tension heavily influences global metal markets and trade flows. The United States and China compete fiercely for critical physical metal reserves. Accelerated U.S. stockpiling tightens copper supplies in international warehouses. Simultaneously, mine disruptions in Chile and Peru restrict global output. Peru issued emergency decrees to manage severe domestic energy shortages. Nations now classify red metal supplies as critical national security assets. Tariff uncertainties further incentivize buyers to secure futures contracts early.
High-Tech Demands and Industry Trends
Hyperscalers plan over $1.1 trillion in capital expenditures for artificial intelligence. Large AI data centers require thousands of tons of high-conductivity copper. A single gigawatt AI facility consumes tens of thousands of metric tons of copper. Power distribution, cooling systems, and electrical transformers demand vast copper supplies. Electric vehicle expansion and power grid upgrades amplify this structural deficit. This massive structural shift creates highly inelastic demand across global tech industries.
Science, Cybersecurity, and Patent Innovations
Materials science drives modern innovations in copper extraction and refining processes. Recent patent filings focus on bio-leaching and advanced eco-friendly smelting techniques. These patents allow producers to extract metal efficiently from lower-grade ores. High-tech power grids depend on secure hardware connections to prevent cyber attacks. Cybersecurity architecture incorporates hardware-level protections within smart grid equipment. Conductive copper pathways power these physical defensive security modules.
Medical Applications and Biopharma Synergy
Copper plays a crucial role in modern pharmaceutical and healthcare infrastructure. The medical industry relies heavily on copper's proven natural antimicrobial properties. Hospitals install copper alloy surfaces to eliminate harmful pathogens on contact. Biopharmaceutical manufacturing facilities utilize massive copper cooling systems for precise temperature control. Precise temperature management protects delicate biological compounds during mass production. Healthcare expansion continuously drives steady baseline demand for refined copper products.
Leadership and Modern Business Models
Major mining firms like Freeport-McMoRan adapt corporate culture toward sustainability. Executives prioritize long-term capital allocation over short-term production spikes. Producers adopt new business models, securing direct supply agreements with tech giants. Leadership teams navigate complex environmental regulations while expanding operational capacity. Exploration companies like Alma Metals report consistent mineral discoveries to boost supply. Strategic management ensures copper producers remain profitable throughout volatile commodity cycles.
Copper will outperform GoldThe Copper-to-Gold ratio chart (HG1! / GC1!). Instead of looking at Copper’s price in dollars, this chart answers one simple question: Who is winning right now: industrial growth (Copper) or pure global fear (Gold)?
For the last few years, Gold has been hogging the spotlight. Central banks hoarded it, people bought it because of war and inflation fears, and Copper got left in the dust because everyone was worried about a recession. That pushed this ratio down to levels we usually only see during total economic meltdowns (really evident back in 2008 or 2020).
Why I think the tides are turning
The liquidity sweep (2025/2026)
Look at that green circle at the bottom. The ratio briefly broke below multi-decade support levels, but it immediately snapped right back up. That's a classic bear trap / Wyckoff Spring: weak hands got shaken out, and big money absorbed the selloff.
Breaking the 5-Year Downside Trend
Right now, price is banging on the front door of that solid red diagonal resistance line running all the way down from 2021. A clean weekly close above this line confirms the multi-year downtrend is officially over.
Geopolitics & Macro
For this trade to really run, we don't need the world to become a peaceful paradise again. We just need the chaos to become... more... predictable.
- Gold slows down: Once central banks finish filling their vaults with Gold and foreign tension settles into a predictable "Cold War 2.0," the panic-buying in Gold cools off. Holding Gold yields 0%, so capital naturally starts looking for growth again.
- Copper ramps up: Meanwhile, the US, China, and Europe are in an absolute arms race for AI infrastructure and power grids. Data centers and high-voltage power lines swallow unreal amounts of copper, and you can't just flip a switch to build new mines (it takes ages just to open one). The physical supply simply isn't there for what the tech dogs want to do.
So, the Game Plan
- The Trigger: Wait for a solid weekly candle close above that red diagonal trendline.
- The Confirmation: If it breaks out, comes back to kiss the ~0.0015 level, and holds it as support, that’s your green light to add to the position.
- The Invalidation: If the ratio closes back down below 0.00125, the thesis is dead (for the time being at least). Cut the losses, move on, and wait for new clarity.
- The Target: We’re riding this back up to the top band (~0.0025 - 0.0027). Target will be revised further down the line depending on how the macro story evolves.
Want in? Here are a few ways to structure it:
- Futures Pair: Long Copper / Short Gold to directly bet on the ratio outperforming without taking USD currency risk (just keep an eye on financing/carry costs).
- Miners Strategy: Buy high-quality copper mining stocks while shorting or avoiding Gold mining ETFs.
- Options (LEAPS): Long call options on Copper ETFs or miners 1–2 years out to capture a potential supply squeeze with fixed downside.
For those of you that want more meat on the bone:
The copper market is undergoing a fundamental shift from surplus to structural deficit.
The ICSG now projects a 150,000-ton deficit by 2026, driven not by demand volatility but by the mining industry's inability to deliver new supply. Global ore grades have plummeted from 1-2% to below 0.7%, while capital intensity has doubled to $15,000-20,000 per tonne of production capacity. Permitting delays averaging 3-5 years compound the challenge. Meanwhile, electrification, renewable energy, and AI infrastructure are creating unprecedented demand layers. For investors, this marks a repricing era where capital-efficient projects, high-grade discoveries in stable jurisdictions, and disciplined developers will outperform. The investment thesis has shifted from cyclical exposure to structural positioning in a scarcity-driven asset class.
AI Infrastructure squeeze
Bloomberg estimates AI data center expansion will consume an average of 400k tonnes of copper per annum, contributing to an estimated long-term deficit of 6 Mio tonnes by mid 2030s.
Spot copper concentrate treatment and refining charges fell to -$126.80 per tonne at the end of June 2026 from the annual benchmark of $0 per tonne set in January 2026, the lowest annual benchmark on record. Smelters are paying miners to secure concentrate, shifting pricing power and processing margins toward concentrate producers.
Copper Futures: Kicking off HigherCopper futures are starting the new trading week with moderate gains. We primarily expect further increases up to just below our resistance line at $6.71 in the near term. After that, copper futures should see a clearer move to the downside, but remain above our support line at $5.25. The long-term uptrend is then expected to continue. Alternatively, copper futures could drop directly below support at $5.25, which would signal that the larger (corrective) upward move has already ended (probability: 33%).
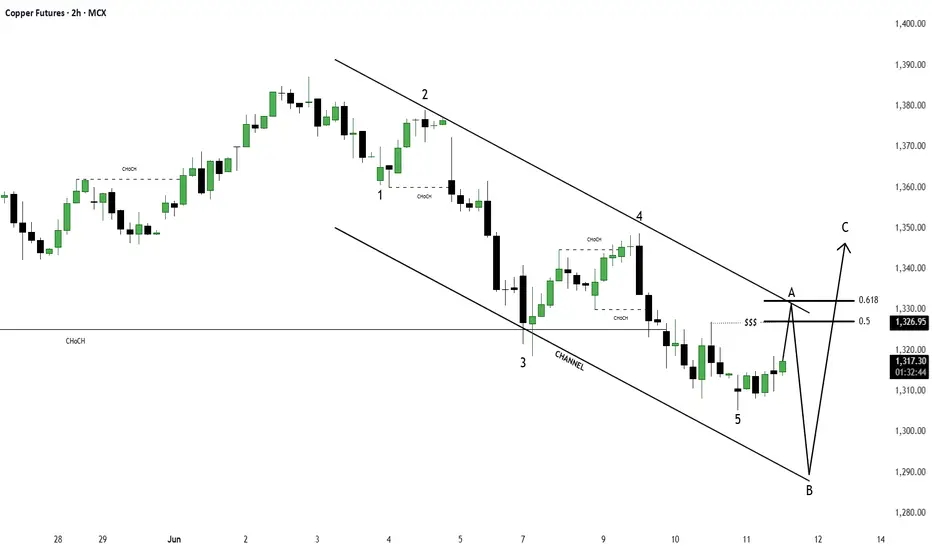
copper mcx updatecopper mcx--eyes on 1350 if sustain abvove than mkt up side possible 1365--1380--1400+++ all will dpend on breakout lvl dontmiss it.. than sl will be 1335.
where support find 1330 if stya blw will create again panic side 1318--1303+++ than sl will be 1342. over all eyes on 1350 sustain or not or rejection here ?????? than will decide path.
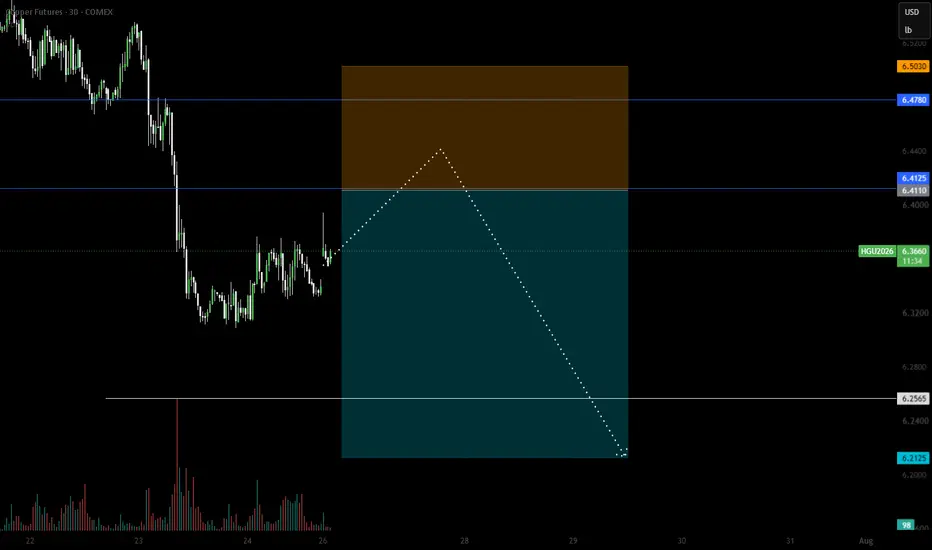
COPPER Short
COPPER SELL LIMIT ORDER : 6.4110
Stop Loss: 6.5030
Remove risk/Partials @ : 6.2565
Take profit: 6.2125
Trade Plan: Short
Bias: BEARISH short term.
Entry reason: Price will most likely retest key TPO area.
Fundamentally: The short-term valuation tool also shows temporarily overvalued against the competing index
Stop Loss: Above nearest high.
First target: 6.2565
Please refer to Copper for CFDs symbols
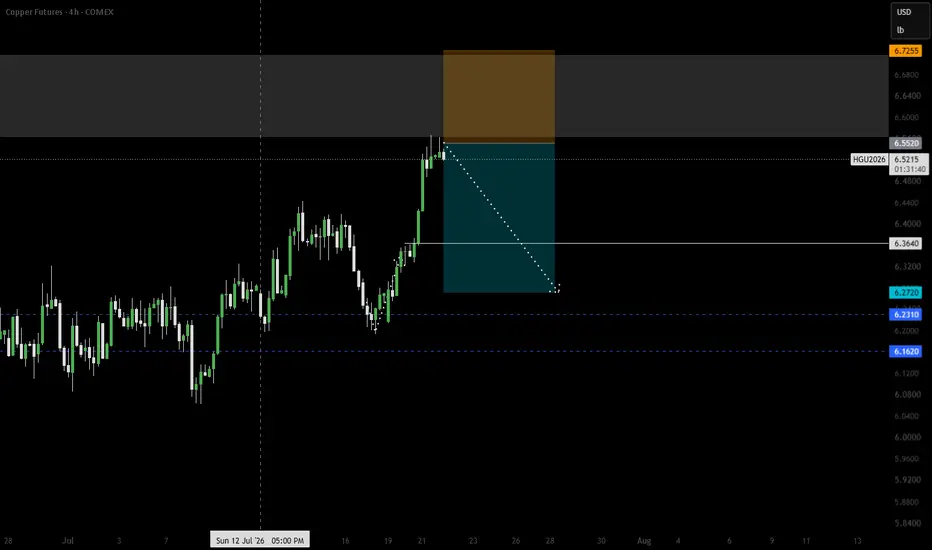
COPPER Short
COPPER SELL MARKET ORDER : 6.5520
Stop Loss: 6.7255
Remove risk/Partials @ : 6.3640
Take profit: 6.2720
Trade Plan: Short
Bias: BEARISH short term.
Entry reason: Price has tested key TPO area.
Fundamentally: The short-term valuation tool also shows temporarily overvalued against the competing index
Stop Loss: Above nearest high.
First target: 6.3640
Please refer to Copper for CFDs symbols
Copper — a six-week high, now pausing at the bundleCopper hit a six-week high this week on a mix of supply shocks — a storm disrupting Chilean mines (Codelco, Antofagasta), tightening Comex inventories on US tariff positioning, and a Chinese import premium at its highest since last May. The rally has been real, not speculative: production is genuinely down.
The bundle read here: the MA convergence has acted as support through the pullback stages of this month's rally, and price is now pausing right at it after Tuesday's peak. Whether this is a healthy pause before the next leg or the start of a real reversal is exactly the open question the structure poses.
Not financial advice — for analysis and education only. Method: Insen / OpenTraders.
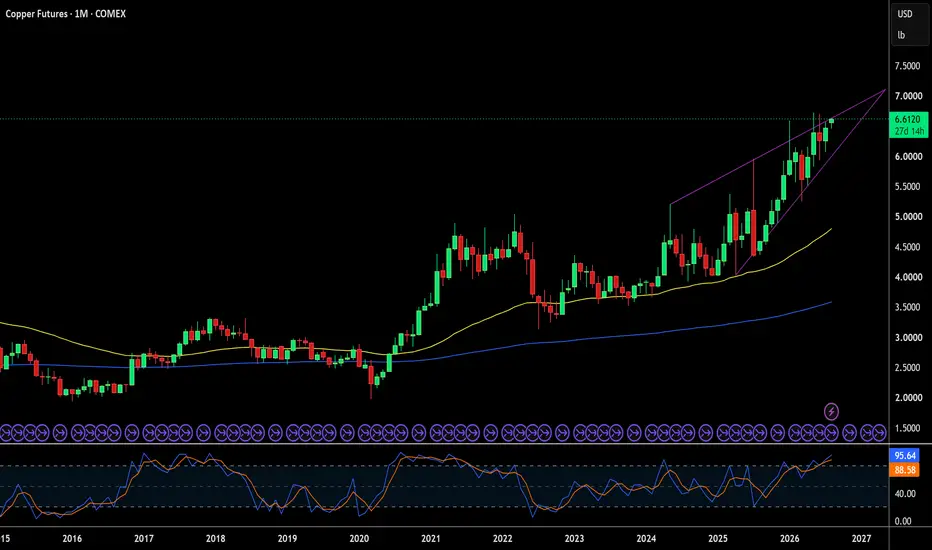
Copper PennantCopper has a huge pennant formation, if it breaks upward we're gonna see it go parabolic like silver did.
I guess all these data centers are driving a shortage in metals, it should take gold and silver with it.
Bought a few CPER Aug calls for kicks and giggles, just to check it out. Besides the calls were way cheaper than silver.
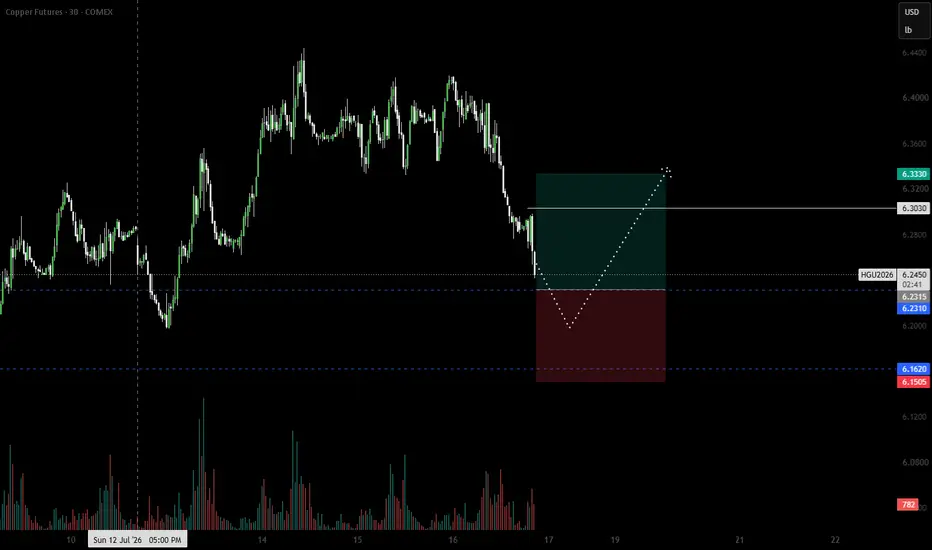
COPPER Long
COPPER BUY LIMIT ORDER : 6.2315
Stop Loss: 6.1505
Remove risk/Partials @ : 6.3030
Take profit: 6.3330
Trade Plan: Long
Bias: BULLISH short term.
Entry reason: Price has tested key TPO area. The short-term valuation tool also shows temporarily undervalued against the index
Stop Loss: Below nearest low.
First target: 6.3030
Why Can't Copper Supply Keep Up With AI?Copper spent 2026 doing something it had not done in a quarter century: setting fresh records every few weeks. The COMEX contract hit an intraday all-time high of $6.71 per pound on May 13. The reason is not mysterious. Three forces- AI infrastructure, a supply shock in Indonesia, and new US tariffs- collided at once. This is the real copper story: a structural race between demand that scales in months and supply that takes decades.
The Widening Gap: Macroeconomics and Economics
Copper earns its "Dr. Copper" nickname because it tracks global growth better than almost any other commodity. Right now it is diagnosing a genuine shortage. The International Copper Study Group forecasts a 150,000-tonne deficit for 2026. That follows years of warnings largely ignored by the market.
The Federal Reserve backdrop adds another layer. The Fed holds its policy rate at 3.50% to 3.75% under Chair Kevin Warsh, and markets still expect at least one more hike this year. Higher rates typically cool industrial demand. Copper has shrugged this off, because the demand driving this cycle is structural, not cyclical.
Goldman Sachs raised its year-end 2026 LME forecast from $12,465 to $13,735 per tonne. That is still below the metal's actual highs, a sign that even bullish banks are playing catch-up with the physical market.
| Metric | Level |
| COMEX copper (May 2026 high) | $6.71/lb |
| LME copper (2026 high) | $13,387/mt |
| ICSG 2026 deficit forecast | 150,000 tonnes |
| Goldman 2026 year-end forecast | $13,735/mt |
Geopolitics, Tariffs, and a Stockpiling Standoff
Washington reshaped the copper trade in 2025. A Section 232 proclamation imposed a 50% tariff on semi-finished and derivative copper products effective August 1, 2025. Refined copper, cathodes, and scrap stayed exempt, for now. A Commerce Department review due June 30, 2026 could trigger a phased duty on refined copper starting at 15% in January 2027, rising to 30% in 2028.
That uncertainty created a strange side effect. Traders raced to pull copper into US warehouses ahead of a tariff that has not yet arrived. COMEX inventories swelled past 650,000 tons, pulling in more than half of the world's visible copper stock. The US holds roughly 65% of visible global inventory despite consuming less than 10% of global demand.
Geography compounds the risk. The US imports about 45% of its copper, led by Mexico, China, and Canada, according to the Council on Foreign Relations. Chile alone supplies roughly half of global copper exports and contributes more than 10% of its own GDP from the metal. Renewed Middle East tensions have added a second front, disrupting sulfuric acid supply chains that feed copper cathode production, which accounts for about 20% of global refined output.
| Section 232 Copper Tariff Timeline | Rate |
| Semi-finished/derivative products (Aug 2025) | 50% |
| Refined copper, phase one (if triggered, Jan 2027) | 15% |
| Refined copper, phase two (2028) | 30% |
Industry Trends and Business Models
Miners are rewriting how they sell copper. Long-dated offtake agreements, once rare outside gold streaming, now anchor project financing for new mines. Producers increasingly lock in buyers years before first output, a direct response to a deficit that has become the default expectation rather than a temporary shock.
The tariff-driven stockpiling trade is itself a business model shift. Traders now treat the COMEX-LME price spread as a tradable arbitrage, not a rounding error. If Washington ultimately declines to tariff refined copper, UBS analysts warn that reversal could dump a large share of that 700,000-ton US inventory back onto global markets, pressuring prices lower.
Leadership Under Pressure: Freeport's Grasberg Test
No company illustrates the industry's fragility better than Freeport-McMoRan. On September 8, 2025, roughly 800,000 tonnes of wet material rushed into its Grasberg Block Cave in Indonesia. Freeport declared force majeure weeks later, an incident that cost the market about 525,000 tonnes of supply across 2025 and 2026 alone.
CEO Kathleen Quirk, a 35-year Freeport veteran who took the top role in 2024, has guided the company's response, targeting 60% of Grasberg's capacity by year-end with full production pushed back to 2028. That single mine's disruption turned a projected global surplus into a deficit almost overnight, a reminder that copper supply concentrates dangerously in a handful of assets.
Technology and Science: The AI Demand Shock
Artificial intelligence is copper's newest and most concentrated demand driver. Bloomberg Intelligence estimates AI-ready data centers consume 27 to 33 tonnes of copper per megawatt of applied power. A single hyperscale AI facility can require up to 50,000 tonnes on its own.
The mismatch in timing is copper's defining structural problem. A data center can be built in 18 to 23 months. A new copper mine takes an average of 17.9 years from discovery to production. North American AI buildout alone could add 1.1 to 2.4 million tonnes of copper demand by 2030, a volume the mine pipeline simply cannot match on that timeline.
Renewable energy compounds the squeeze. Solar and wind installations require 8 to 12 times more copper than equivalent fossil fuel generation, and electric vehicles use 3 to 4 times more copper than an internal combustion engine.
Patent Analysis and Innovation
Faced with grade decline and permitting delays, miners are patenting their way to more copper rather than waiting for new deposits. Recent filings cluster around bioleaching, using engineered bacteria to extract copper from low-grade ore, and advanced flotation techniques that recover metal from tailings once considered waste.
Recycling technology is drawing equally aggressive patent activity. Copper never degrades chemically, making it one of the few metals recoverable at near-100% purity. Companies are patenting sorting and smelting processes that cut the energy cost of recycled copper well below virgin ore production, a genuine competitive moat as ore grades keep falling worldwide.
Cybersecurity in an Automated Mining Sector
Modern mines run on the same industrial control systems that make manufacturing plants attractive ransomware targets. Autonomous haul trucks, remote block-cave sensors, and smelter automation all depend on operational technology networks that were never designed with cybersecurity as a priority.
A successful attack on a mine's control systems can halt production as effectively as a geological disaster. Major producers now run dedicated OT security programs, treating cyber resilience as core to supply continuity, not an IT afterthought layered on top of it.
Company Culture and the Decarbonization Push
Mining culture is shifting from extraction-at-any-cost toward engineered efficiency. Freeport and its peers now tie executive compensation to emissions targets alongside production volumes, a genuine change from a decade ago. Water recycling and lower-carbon smelting are becoming competitive differentiators, not just compliance checkboxes.
This cultural shift matters commercially. Copper is marketed increasingly as the enabling metal of the energy transition, and buyers, particularly automakers and utilities, now scrutinize the carbon footprint of the copper they purchase.
The Pharmaceutical Connection
Copper's industrial story overshadows a genuine medical one. Copper alloys carry EPA registration as antimicrobial surfaces, proven to continuously kill bacteria that cause healthcare-associated infections. Hospitals increasingly install copper touch surfaces on bed rails and door handles for exactly this reason.
Copper also plays a direct pharmaceutical role through copper intrauterine devices and copper supplementation for deficiency-related conditions. None of this moves copper futures meaningfully. It does mean rising extraction and recycling capacity built for industrial demand quietly benefits a completely separate, health-focused market.
Closing Thoughts
Copper's 2026 rally rests on a genuine structural mismatch, not speculative froth. AI data centers, EVs, and grid buildout are scaling in months. New mine supply takes decades, and a single disaster at Grasberg proved how little slack exists in between. Tariff policy adds a second, more volatile layer: a still-undecided Commerce Department ruling on refined copper could either validate the current US stockpiling trade or unwind it violently. Watch three signals going forward: whether Washington actually extends Section 232 tariffs to refined copper, how quickly Grasberg returns to full capacity, and whether ICSG deficit forecasts widen or narrow as AI capex plans firm up.
Copper Futures:The Structural Turning Point of a New Macro CycleHG1! | Macro Structural Convergence and Transition to a High-Velocity Expansion Phase
━━━━━━━━━━━━━━━━━━━━━━━━━━━━━━━━━━
1. Structural Hypothesis
This chart is not merely a technical analysis or a collection of price targets.
This study is based on a proprietary structural model developed to analyze the market through the convergence of price, time, structural behavior, structural compression, structural complexity, movement logic, and the framework of price-time coordination across all timeframes.
All scenarios, validations, and potential pathways presented in this report are directly derived from the interaction of these components and are built upon a coherent and measurable structure.
From the Macro Cycle Base at the price of 2.1420 in April 2020, the market initiated its first accelerated directional movement and completed the first expansion phase of the cycle by forming Pulse 1 at the 4.8095 level in April 2022.
From that point, the market did not enter a conventional correction; rather, it entered a multi-layered structural reorganization process; a process that, while preserving the integrity of the primary trend, has internally organized the required energy, time, and balance for the next stage of the cycle’s expansion.
━━━━━━━━━━━━━━━━━━━━━━━━━━━━━━━━━━
2. Dual Compression Architecture
The corrective behavior of the market throughout this cycle is not a random sequence.
This structure consists of two primary compression phases connected by an internal transition vector (Link 1), which together form the corrective architecture of the entire cycle.
Compression Phase 01 was completed over 687 days and ultimately concluded at Node 1 and the price level of 3.8370.
Following that, an intermediate expansion with an exact ratio of 2.06 developed, establishing the medium-term liquidity high around the 5.8460 region.
The market then entered Compression Phase 02; a structure that lasted exactly 345 days.
The precise 50% time ratio between the two compression phases represents one of the most important signals of temporal convergence within this model.
When symmetry between price, time, and structural behavior forms with such coherence, the market typically approaches the final zone of the reorganization process; a zone where the probability of a structural phase transition increases.
━━━━━━━━━━━━━━━━━━━━━━━━━━━━━━━━━━
3. Structural Decision Window
The market is now approaching one of the most important decision points of this cycle.
All upcoming pathways depend on price behavior relative to two key levels:
6.7160 → Trigger for the beginning of structural expansion
5.2460 → Structural invalidation boundary of the bullish structure
All scenarios within this study are defined based on how the market reacts to these two levels.
━━━━━━━━━━━━━━━━━━━━━━━━━━━━━━━━━━
4. Primary Scenario; Beginning of Macro Pulse 3 (High Probability)
If the market can break above the 6.7160 level with sufficient speed, strength, and momentum before August 5, 2026, alternative corrective structures, including triple correction scenarios, will lose their structural validity.
Under these conditions, the official beginning of Macro Pulse 3 from the current structural low will be confirmed.
The initial targets of this expansion are located within the 19.7 to 21.7 range.
If capital inflow continues, trend strength is maintained, and the structure continues its expansionary behavior, further extension toward the mathematical 261.80% coordinate at the price of 47.5 can also be evaluated within the framework of this model.
In the maximum scenario, if the market structure continues to demonstrate expansion capability, participation from major capital flows, and sustained momentum, the 361.80% level at the price of 104.1 will represent the final conceivable expansion zone for Macro Pulse 3.
This level is not a guaranteed target; rather, it represents the maximum structural expansion capacity of the model under the strongest possible conditions.
━━━━━━━━━━━━━━━━━━━━━━━━━━━━━━━━━━
5. Alternative Scenario; Extension of the Corrective Structure (Medium Probability)
If the breakout of the 6.7160 level does not occur within the initial time window and this breakout takes place near the beginning of September 2026 or later, the structure will enter the alternative pathway.
In this case, the upward movement will no longer be considered the direct beginning of Macro Pulse 3; instead, it will function as a secondary transition vector (Link 2).
This pathway may, through an extension of the corrective duration, guide the structure toward the formation of Compression Phase 03 and reaching the maximum temporal maturity boundary in April 2028.
After completion of this process, Node 3 is expected to act as the structural origin of Macro Pulse 3, with the next directional movement beginning from that region.
All possible pathways, decision branches, and validity conditions of this scenario are defined based on the temporal and price structure shown on the chart.
━━━━━━━━━━━━━━━━━━━━━━━━━━━━━━━━━━
Structural Invalidation Condition (Low-Probability Scenario)
The validity of this framework will remain intact as long as the market does not violate the defined structural requirements.
The structural invalidation scenario, although considered within the model and defined as a boundary condition, currently carries a very low probability of occurrence based on the present structural configuration.
Only if the market fails to reclaim the 6.7160 level with sufficient strength within the defined timeframe and subsequently loses the structural level of 5.2460 to the downside, will the bullish framework of this model enter a state of invalidation.
However, the convergence of spatial compression, temporal symmetry, geometric relationships, structural complexity, and the coherence of price behavior in the current state indicates that the market is positioned within a zone where the probability of completing the reorganization process and initiating a new expansion phase has increased
━━━━━━━━━━━━━━━━━━━━━━━━━━━━━━━━━━
Conclusion
This study presents a structural framework for examining major market cycles; a framework designed to identify the relationships between price, time, structural behavior, and movement logic.
The purpose of this model is not to provide a conventional market narrative or create certainty about the future; rather, it is to define conditions in which actual market behavior can be evaluated against predefined structural formations.
Each scenario presented in this report will only remain valid if the market fulfills the structural requirements associated with it.
The validity of this framework is not measured by absolute prediction, but by the degree of alignment between actual market behavior and the structural logic of the model.
Ultimately, it is the market that reveals its own path; however, whichever path is chosen, it must remain explainable and verifiable within the framework of the structural relationships defined by this model.
━━━━━━━━━━━━━━━━━━━━━━━━━━━━━━━━━━
Research Signature
“Each market cycle is formed across a set of structural degrees; degrees that interact with one another hierarchically, where the coordination between them, from the highest degree to the lowest degree, shapes the final structure of movement. Within this architecture, higher degrees determine the dominant structure, while lower degrees organize themselves within the same governing structure and logic. Every movement is the result of the convergence of price, time, structural complexity, structural behavior, and movement logic across all of these degrees. This framework is the result of studying and modeling these relationships; relationships that describe the path of the market rather than impose it upon the market.”
━━━━━━━━━━━━━━━━━━━━━━━━━━━━━━━━━━
✍🏻 Mohsen Nirumand
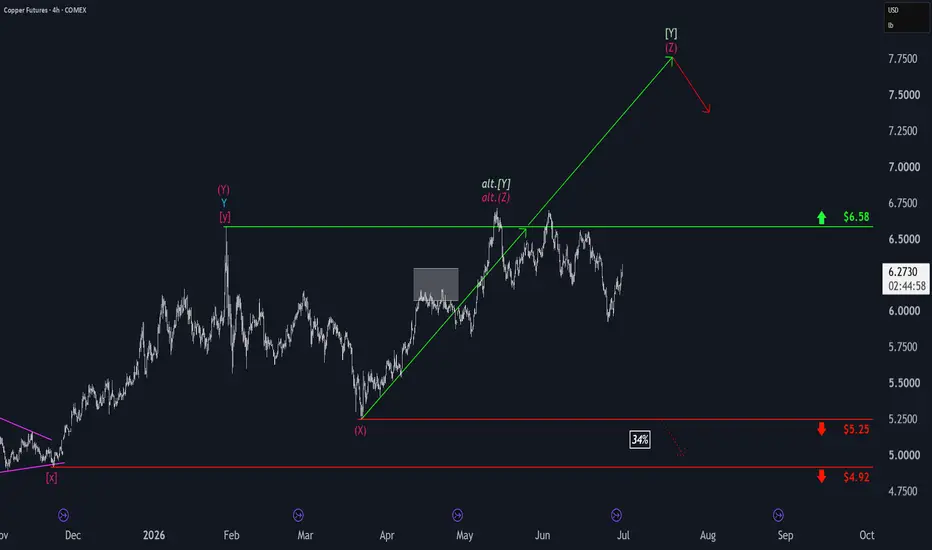
Copper Futures: Dip, Then ReboundCopper futures started the week with modest gains before slipping back. Early in today’s session, prices moved higher again. Our main outlook is that price should continue climbing well above resistance at $6.58 before eventually turning lower. Alternatively, copper futures could drop straight below support at $5.25, signaling that the corrective upswing has already ended (probability: 34%).
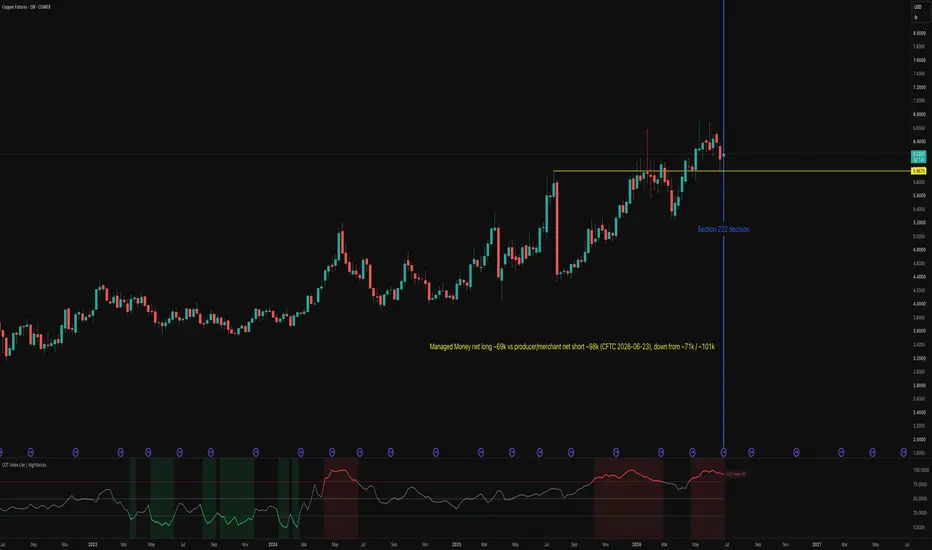
The record long starts to unwind into the June 30 tariff callQuick follow-up to last week's copper positioning read, because the new data changed the shape of the setup right before the catalyst.
What changed. The US Section 232 copper review still reaches its decision point on June 30. The fresh CFTC report dated June 23, the last one before that date, shows the crowded long starting to come off the boil. Front-month COMEX copper is holding near 6.14 per pound, roughly where it sat a week ago, so the move this week is in positioning rather than in price.
The numbers. Managed Money, the speculative crowd, trimmed its net long from about 71,000 contracts to about 69,000 in the week to June 23, while the producer and merchant hedgers who handle the physical metal covered part of their short, from about 101,000 net short to about 98,000. On a standardised basis the speculative long is still historically stretched, a COT Index up in the mid-90s out of 100 and a z-score near plus 1, just off the near-record high it printed the prior week. Open interest fell by roughly 6,000 contracts, so this reads as two sides trimming risk into the event, not fresh money piling in.
Why it matters. This is the early shape of the asymmetry the first post flagged. A long that was sitting near a record had little dry powder left to chase a bullish headline, and the first thing that tends to happen into a binary catalyst is a quiet unwind rather than a violent one. The book is lighter than it was, but with the COT Index still in the mid-90s it is nowhere near neutral, so the risk of a sharper unwind on a disappointing or already-priced outcome is still very much on the table.
How to read it on the chart. Watch the June 30 reaction against the same range support near the recent lows that held last week. A continued bleed in the speculative net long while price holds is the constructive reset that sets up a cleaner continuation later. A price break while the long is still this crowded is the version where positioning, not fundamentals, does the damage.
Context. The COT Index and z-score come from standardising the CFTC data, which is what the free COT Index Lite indicator plots directly in a pane on this chart, and what the COTInsight dashboard scores across 475 plus markets every Friday. Data via the CFTC Commitments of Traders report dated June 23 2026. Nothing here is investment advice, and futures carry substantial risk.
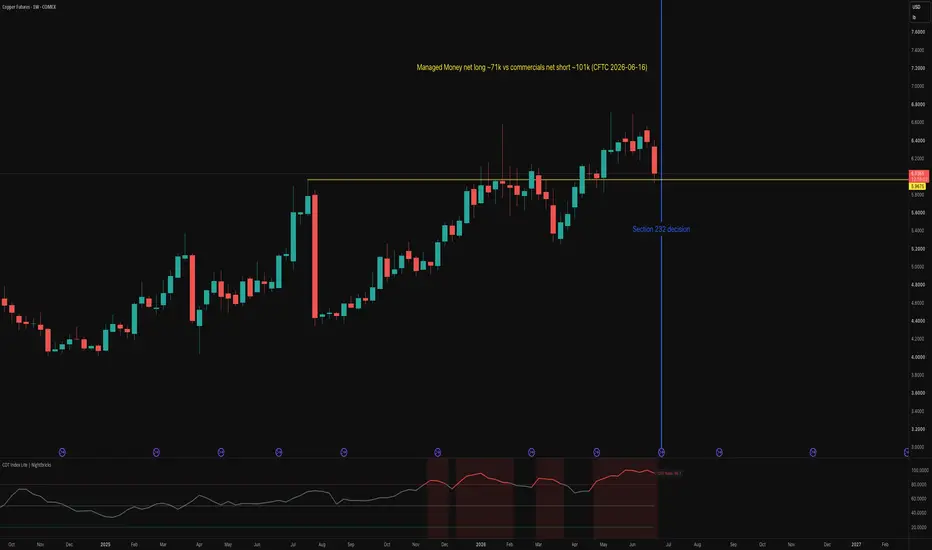
Copper: speculators near record long into June 30 tariff callCopper is sitting on a rare combination heading into a binary policy event, and the positioning data is the part most charts miss.
The setup. The US Section 232 copper review reaches a decision point on June 30, when the Commerce Secretary updates the President on the copper market and duties on refined copper can be determined. Commerce has recommended a 15 percent tariff on copper raw material imports from January 2027, stepping up to 30 percent in 2028, on top of the existing 50 percent tariff on semi-finished and derivative copper that has run since August 2025. Front-month COMEX copper is near 6.1 per pound in late June, off its highs as a firmer dollar weighs on the move.
What positioning says. In the CFTC report dated June 16, Managed Money (the speculative crowd) is net long about 71,000 contracts in COMEX copper, and the commercial hedgers who trade the physical metal are net short about 101,000 against them. On a standardised basis that speculative net long sits near the very top of its multi-year range, a COT Index reading around 96 out of 100 and a z-score near plus 1.2. In plain terms, almost everyone who wanted to be long is already long, and the smart money is taking the other side.
Why it matters here. A crowded long is not a sell signal by itself, an extreme can persist for weeks. What it does is change the risk around a known catalyst. Into a binary tariff decision, the speculative side has little dry powder left to push price higher on a bullish outcome, while a disappointing or already-priced outcome leaves a stretched long to unwind. That asymmetry, crowded one way into an event, is exactly what the COT z-score is built to flag.
How to read it on the chart. Watch the June 30 reaction against recent range support near the 7-week lows. A failure to hold on a bullish headline would confirm that positioning, not fundamentals, was the constraint. A flush that resets the speculative long back toward neutral is the more constructive setup for a continuation later.
Context. The COT Index and z-score above come from standardising the CFTC data, which is what the free COT Index Lite indicator plots directly in a pane on this chart, and what the COTInsight dashboard scores across 475 plus markets every Friday. Data via the CFTC Commitments of Traders report. Nothing here is investment advice, and futures carry substantial risk.
HG Short — $HG copper fading from the 6.385 rejection — bearish On the 4-hour chart, copper posted a clean all-time high near 6.67 in early June, then reversed sharply — making a sequence of lower highs and lower lows since that peak. The most recent 4h bounce stalled around 6.38–6.40, well below the prior swing high near 6.55, confirming a bearish structure of lower highs. Price is now consolidating near 6.33, sitting inside a band that acted as minor support in mid-May and early June (roughly 6.28–6.35). The HTF bias is clearly down from the record high.
On the 1-hour chart, the Jun 17 flush from 6.50 to 6.28 was the structural break. The subsequent bounce from the 6.27 low on Jun 18 was limited and rejected sharply, with the Jun 19 morning bars showing a failed attempt to reclaim 6.38 (high 6.385 on the 06:00 bar) before fading back to 6.33. The LTF structure is making lower highs: 6.385 → 6.374 → 6.348 → 6.341, with the current 10:00 bar closing at 6.333. This is a textbook pullback into the broken 6.35–6.38 zone, now acting as resistance, with the bounce exhausting into that overhead supply. The micro-rejection off 6.385 and the rolling lower highs confirm the trigger.
Stop is placed above the morning high of 6.385, adding roughly 0.5× ATR clearance, at 6.385. Target is the Jun 18–19 swing low region near 6.27, with the target set slightly in front at 6.21 — a zone that was tested as major support in mid-June prior to the bounce. The hawkish Warsh Fed pivot, stronger USD, and the reversal from the all-time high at 6.67 all reinforce the near-term downside thesis. Structural long-term supply deficits are a multi-year factor and do not alter the current short-term bearish positioning off the record high. The market regime is short-leaning with broad commodity weakness, adding modest directional alignment. Invalidation is a decisive close back above 6.39 on the 1-hour chart.
📍 Entry: 6.3335
🛑 Stop: 6.3850
🎯 Target: 6.2100
⚖️ R:R: 2.40
Short Idea Copper Future (HG1!)We are currently near the all-time high.
We have marked a supply zone here in blue that has already been tested. According to my backtests, these zones tend to work at least as well the second time around. Importantly, the hit rate depends on where exactly price arrives inside the zone. Reaching the zone from the current level would currently imply a hit rate of around 67%.
These are only my backtest results and no guarantee for this trade. Make your own decisions. Below you can see the data for this.
Is Copper’s Record Rally Scarcity or Speculation?Copper is trading near record highs around $6.50 a pound, and the catalysts are real. In the past week alone, protesters blockaded Rio Tinto's Oyu Tolgoi mine in Mongolia on June 17, choking concentrate flows to China, and US Customs issued a Withhold Release Order on June 16 barring copper from Serbia Zijin over forced labor. Layered on top is Washington's tariff policy, with 50% duties already on semi-finished copper and a refined-copper decision pending in 2026, which has pulled metal into US warehouses and distorted global flows. The result is a market that feels acutely tight, with supply shocks and trade friction colliding at once.
The durable part of the bull case is demand, specifically electrification and artificial intelligence. Data centers, power grids, and electric vehicles are structurally copper-hungry, and that demand is largely inelastic because builders need the metal regardless of price. JPMorgan expects data-center copper consumption alone to jump from about 110,000 tonnes in 2025 to 475,000 tonnes in 2026, while S&P Global projects total demand rising from 28 million tonnes today to 42 million by 2040, against a potential 10-million-tonne shortfall. This is the genuine long-term story, and it is why copper increasingly trades as an AI and energy-transition asset rather than a simple construction input.
The harder question is whether today's price reflects that story or has run ahead of it. Bulls point to a structural deficit, with Jefferies modeling an average annual shortfall of 491,000 tonnes through 2030 and the International Copper Study Group flagging a return to deficit. Goldman Sachs takes the other side, estimating a 2026 surplus of roughly 300,000 tonnes, pegging fair value near $11,500 a tonne, and arguing the rally has overshot on tariff front-running and record speculative positioning. Both can be partly true. The long-term scarcity is credible, but a meaningful slice of the current record price is a tariff-arbitrage and speculation artifact rather than pure physical shortage.
The honest verdict is that copper is a strong structural long wrapped in a stretched near-term price. The electrification demand is real, supply is genuinely constrained by aging mines and rising political risk in places like Mongolia and Serbia, and the metal's strategic weight is only growing. But "guaranteed tightness" overstates a market Goldman sees in surplus this year, and the real swing factor is the US refined-copper tariff decision, not the geopolitical headlines. Clarity on that ruling could end the stockpiling that has inflated prices and trigger a correction. Treat copper as a core long-term holding, but size the entry for a market that is part fundamentals and part froth.
HG Long — $HG Copper pulling back cleanly into 6.498 support aftHTF (4h): HG printed an ATH near 6.67 in late May, sold off sharply to 6.19 by early June (structurally a corrective swing), then staged a strong recovery leg — series of higher lows from 6.19 through 6.39 to the current 6.49–6.50 zone. The most recent 4h structure shows HH/HL sequence re-establishing with the Jun 11 impulsive thrust off the 6.19 low. Price is now consolidating just under the 6.55–6.56 supply zone (Jun 14 high 6.562, prior 4h resistance cluster). The pullback off 6.562 into the 6.48–6.50 shelf is orderly — candles are small, wicks balanced. LTF (1h): After tagging 6.562 on Jun 14 20:00, price has drifted lower in a controlled shallow pullback through Jun 15 morning, bottoming near 6.471 (Jun 15 08:00 low) and now lifting back to 6.487–6.498. The micro-structure shows a HL forming at 6.471 with the 06:00–09:00 candles failing to make new lows and the 10:00 bar recovering to 6.498 — a clean LTF trigger (micro-BOS off the pullback low). Entry at quote 6.498. Stop placed below the Jun 15 intraday swing low at 6.471 minus 0.5× ATR (0.014) = 6.457, using 6.458. Target is the Jun 14 swing high / supply cluster at 6.56, placing target just in front at 6.598 — the next structural objective is the 6.60–6.62 area which has been tested before; 6.598 keeps the target realistic and in front of that supply. R/R: |6.598−6.498| / |6.498−6.458| = 0.10 / 0.040 = 2.50. Gate cleared. Regime is long_lean — aligned with LONG. Scan hint is Pullback/LONG 75 — agrees on strategy and side. Research: structural multi-year supply deficit, ATH momentum, Grasberg/Quebrada Blanca disruptions, China sulfuric acid halt, and Jefferies/JPM constructive coverage all reinforce LONG bias (T2 sources); countervailing headwinds (elevated inventories near 1.5Mt, $110 oil macro risk) noted but do not flip side. Base 68; hint +4; regime +5; research net +3 (T2 aligned, headwinds partially offset) → 80.
📍 Entry: 6.4980
🛑 Stop: 6.4580
🎯 Target: 6.5980
⚖️ R:R: 2.50
Chart Pattern Analysis Of Copper.
K4 and K5 is a strong bullish engulfing pattern,
It verified a valid break up of K1.
I was expecting a bear run started from K2,
But actually, I was wrong.
So, I bought back at K6.
Besides,K5 verified a fact that Copper is stronger than Gold Or silver.
I will buy less Gold or Silver.
I am expecting a 5-6 months bull market from K5.
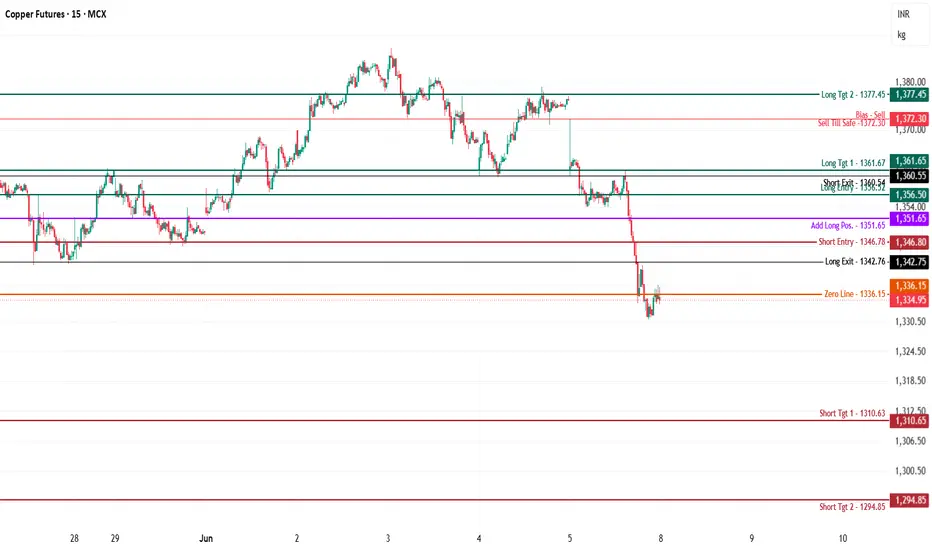
Copper MCX Future Intraday Analysis for 8th June, 26MCX:COPPER1!
Copper Futures — Intraday Structure Outlook (15-min | MCX)
(If these levels support your preparation or execution, a quick boost or comment helps maintain structured updates.)
Copper is trading around 1,334.95, currently hovering just below the Zero Line – 1,336.15. The commodity enters the June 8th session following a massive technical breakdown and liquidation cascade over the weekend, dropping from its high-level distribution bands above 1,360.
The primary driver behind this sharp drop is the blockbuster US Non-Farm Payrolls (NFP) report released on Friday. The hotter-than-expected data has supercharged the US Dollar Index, putting severe downward pressure on the entire dollar-denominated base metals pack. At the same time, traders are digesting expanding warehouse inventories on global exchanges, leading to immediate long liquidation. Price is currently trying to stabilize at its lower structural bounds; a clean breakout or breakdown away from this key pivot zone will dictate the next leg of expansion.
Bullish Structure
Longs activate above 1,356.52 (Long Entry) sustained acceptance (confirmed further only if price manages a substantial recovery to break and hold back above the 1,336.15 Zero Line).
Targets:
1,361.67 – first upside objective
1,377.45 – extended expansion zone
Control:
Intraday bullish structure weakens below 1,351.65 (Add Long Pos.)
Sustained trade below 1,342.76 (Long Exit) cancels aggressive counter-trend longs
Bearish Structure
Shorts activate below 1,346.78 (Short Entry), especially as the price remains structurally heavy and capped beneath the 1,336.15 Zero Line overhead resistance.
Targets:
1,310.63 – first downside objective
1,294.85 – extended breakdown zone
Control:
Immediate short covering required above 1,360.54 (Short Exit)
Bias remains structurally protected below the 1,372.30 (Sell Till Safe) distribution wall
Neutral Zone
1,342.76 – 1,356.52 is the decision band.
Inside this pocket, expect highly rotational, choppy price action and deceptive liquidity hunts as domestic currency dynamics absorb the global dollar shock. Given the fierce bearish momentum completely dominating the 15-minute timeframe in image_30ba43.png, avoid anticipating bottoms. Wait for a clean candle close acceptance outside this cluster before deploying capital.
Structure first. Confirmation next. Execution last.
No anticipation. No emotional bias. Let price confirm intent.