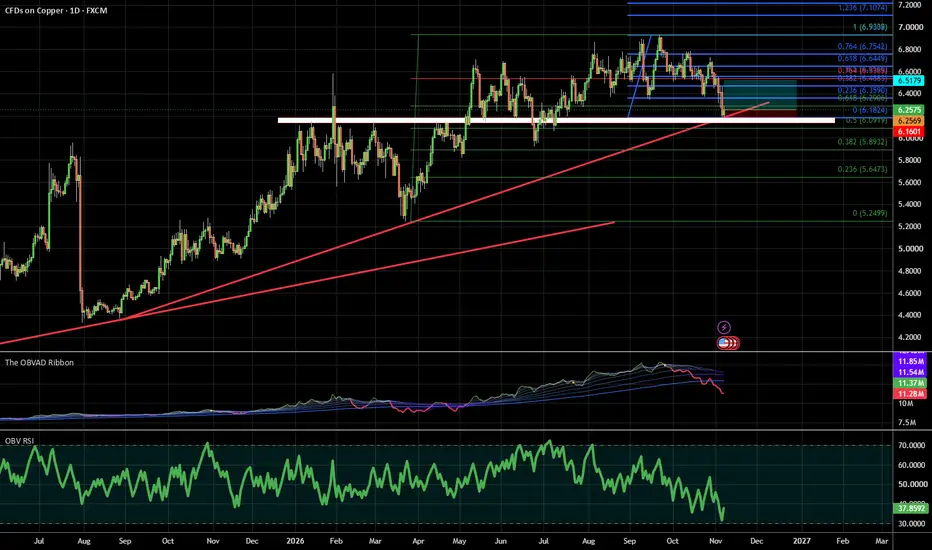
Copper Long SetupBias: Long
Timeframe: DailySetup:
Copper is currently testing a strong confluence zone at 6.20 – 6.26, which includes the ascending trendline and the 0.5 Fibonacci retracement.This area has acted as support previously and offers a favorable risk-reward for a long position, especially considering the broader intermarket context of physical tightness in the copper market.Entry Zone: 6.20 – 6.26Stop Loss: Below 6.10Target:
TP1: 6.50 (0.764 Fibonacci)
TP2: 6.65 – 6.70 (optional extension)
Rationale:
Clear t
In-depth trading ideas
Copper Catching Its Breath? A Penny for your Thoughts.Price rise on CAPITALCOM:XCUUSD may have stalled out temporarily after this miraculous rally made contact with a Fibonacci Extension level leading me to believe we are in an Elliot Wave, lets break it down!
Here on the 3 Month CAPITALCOM:XCUUSD chart, we can clearly see:
- a strong Wave 1
- a steep Wave 2
- an explosive Wave 3
Now based on the Low and High of Wave 1 and the Low of Wave 2, the Fibonacci Extension tool gives us a 1.618 Extension level @ 6.95416 where we see price touched an
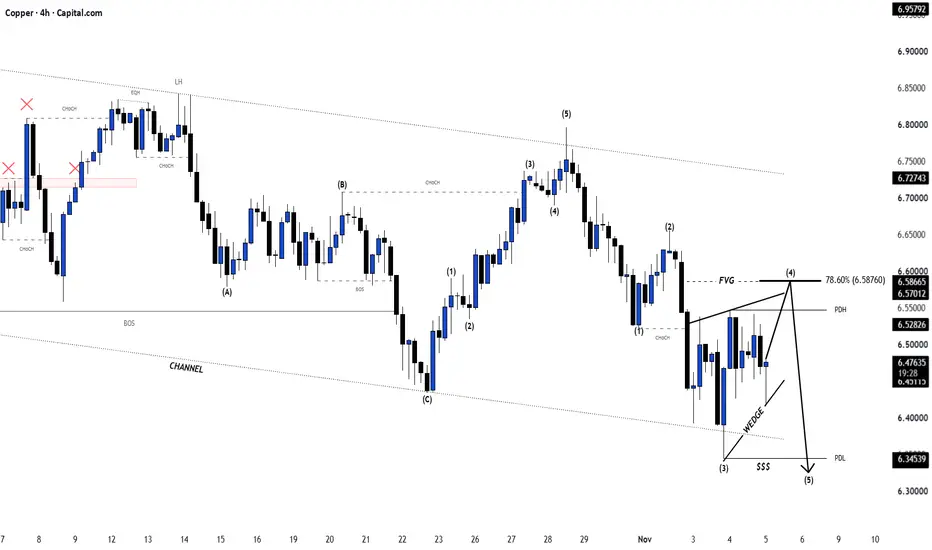
Copper: Watching 6.630–6.660 for a Bearish RejectionCopper’s conditional short scenario depends on how price behaves on a rebound into the 6.630–6.660 zone marked by the white box. The recent decline makes the response to that rebound the key area of interest.
The preferred sequence is a push into the zone, a rejection, and then a lower-high retest. If sellers regain control after that sequence, 6.522 is the first support level to watch. The solid yellow path illustrates this possibility; the shape and spacing of the drawing are schematic.
A br
Copper: conditional intraday short from 6.728–6.73328 October 2026 — conditional intraday scenario on CAPITALCOM:XCUUSD.
Weekly MACD shows bearish divergence markers, but daily/4h momentum is recovering. Hourly momentum is rolling over and 15m price rejected its latest high. This is a tactical pullback short against the 4h recovery, not full bearish alignment. The publication chart omits private indicators; the observations refer to my working charts.
Watch 6.728–6.733 supply. Require a bounce into that zone, a 15m close back below it, then a
Bearish momentum to continue?Copper has rejected off the resistance level, which is a pullback resistance and could drop from this level to our take profit.
Entry: 6.2632
Why we like it:
There is a pullback resistance level.
Stop loss: 6.3910
Why we like it:
There is an overlap resistance level that aligns with the 50% Fibonacci retracement.
Take profit: 6.0312
Why we like it:
There is a support level at the 145% Fibonacci extension and the 61.8% Fibonacci projection.
Enjoying your TradingView experience? Review us!
Copper gearing up to blast through all time highs! The last two months have seen the markets go risk off and retracements across commodities noticeably gold and silver, along with the wider stock market, seeing huge losses. During this period, copper has held strong with a sideways retracement, putting it in a strong position from a technical’s perspective.
Given the strong Fundamentals that have increased the global appetite for copper with the expansion of AI and data centres, this seems an obvious trade to take to the upside!
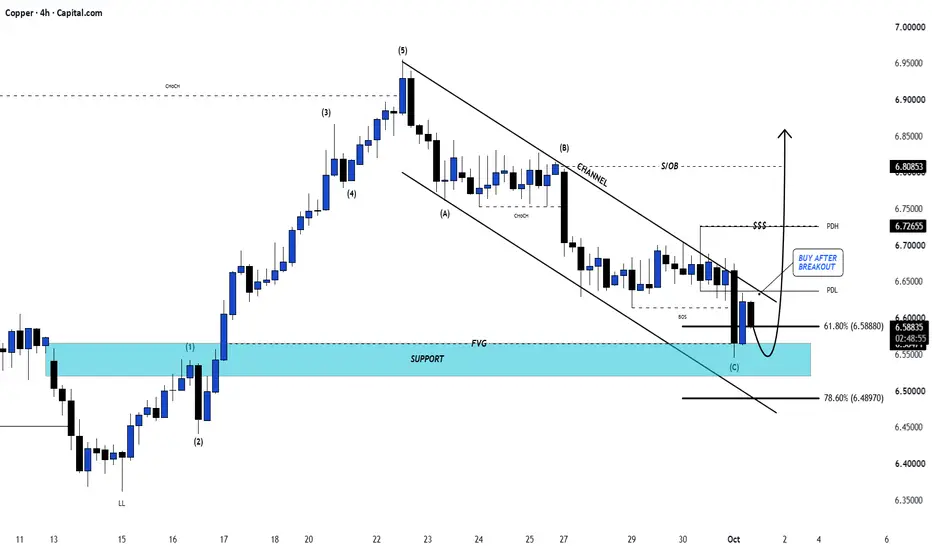
Copper Reclaimed Its Q4 Pivot. Is 6.745 the Next Stop?Copper had a shaky October. The quarter started strong, then two red weeks dragged it down to 6.30, and last week closed at 6.425, a hair under its quarterly pivot.
This week the buyers came back. Copper reclaimed the pivot at 6.426 and pushed as high as 6.658. Today it gave some of that back and is sitting around 6.53.
My forecast for the rest of the quarter: back above 6.548 and on to 6.745. In the closest historical quarters on the same grid, about two out of three got back above 6.548 befo
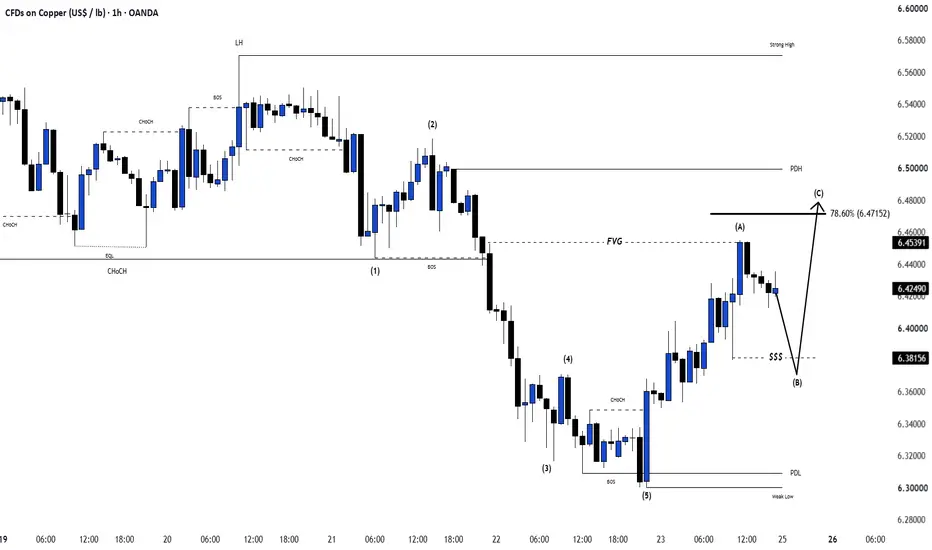
Copper (XCU): Shot-term Correction to a Larger Upside TargetMarket Overview
Copper is trading near $6.45/lb after several weeks of volatile, range-bound price action. The market has repeatedly moved between the $6.30 area and the upper $6.70s without establishing a sustained directional trend.
The current Elliott Wave count suggests that the recent decline may be approaching a potential bottom, but confirmation is still required. A short-term rebound could develop from the current area before price makes a more decisive move.
The key distinction is b
Pullback resistance ahead?COPPER is rising toward the resistance level, which is a pullback resistance, and could reverse from this level to our take profit.
Entry: 6.5200
Why we like it:
There is a pullback resistance level.
Stop loss: 6.5736
Why we like it:
There is a pullback resistance level.
Take profit: 6.4276
Why we like it:
There is a pullback support.
Enjoying your TradingView experience? Review us!
Please be advised that the information presented on TradingView is provided to Vantage (‘Vantage Global L
Tighter supply supports copper (XCUUSD) despite uneven demandTighter supply supports copper (XCUUSD) despite uneven demand
Fundamental Analysis
1. Chilean mine strike adds supply risk: Centinela’s strike could affect output within two weeks, though plants remain supplied and guidance is unchanged. A quick settlement could reduce the risk premium.
2. Chinese smelters face feedstock limits and maintenance: China's refined copper output is expected to grow just 3-3.4% this year, down from 10.4%, constrained by both concentrate and scrap.
3. Inventories
Copper After the Record High: AI Supercycle or Tariff Mirage?Copper After the Record High: AI Supercycle or Tariff Mirage?
Artificial intelligence is usually traded through semiconductors, cloud companies and data-centre operators.
But every GPU rack stands at the end of a physical chain: power generation, substations, transformers, transmission lines, cooling systems and backup infrastructure.
That chain cannot be built without copper.
The market is now facing a collision between three very different clocks:
AI electricity demand can accelerate wit
Concerning Candles @ the HTF 1:2.272COPPER - Monthly candle closing soon and it looks like it could be another spinning top here.
Price currently wicking at a HTF 1:2.272; a ratio where pivots commonly occur. If a correction occurs here, it could be some where in the realm of a super cycle correction.
Daily Chart
We have what appears to be fractal ending diagonals that continue to print slightly higher highs which can signal exhaustion, along with plenty of RSI bearish divergence.
If XCU slumps, could this be treated as an
Potential XCUUSD (Copper/USD) Reversal Ahead XCUUSD remains in a strong bullish trend on the 1 day timeframe, supported by a sequence of Higher Highs and Higher Lows. However, price is now approaching a potential resistance or exhaustion zone. At the same time, RSI is forming bearish divergence, as price moves toward a fresh Higher High while RSI fails to reach a corresponding peak. This divergence indicates weakening bullish momentum and raises the possibility of a short-term pullback or reversal.
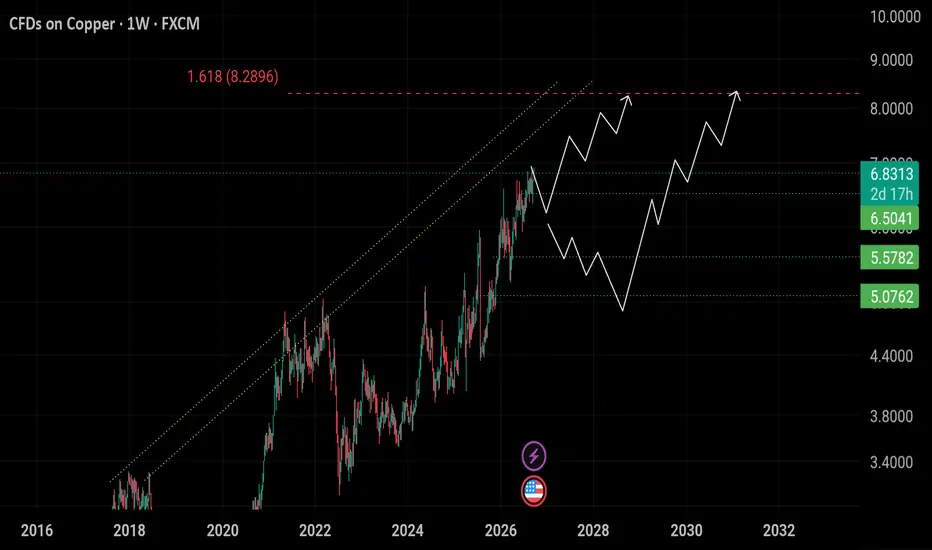
Copper Ending Diagonal Suggests Upside May Be LimitedCopper has recently reached new highs, but one of the wave counts we are tracking suggests that the upside could become limited. We are observing a potential ending diagonal, which is a pattern that typically shows that bulls are still in control, but are gradually losing strength. This is also reflected by the increasing number of overlaps since the beginning of this year.
You can clearly see the difference between the strong and steep advance from the August 2025 lows into the January 2026 hi
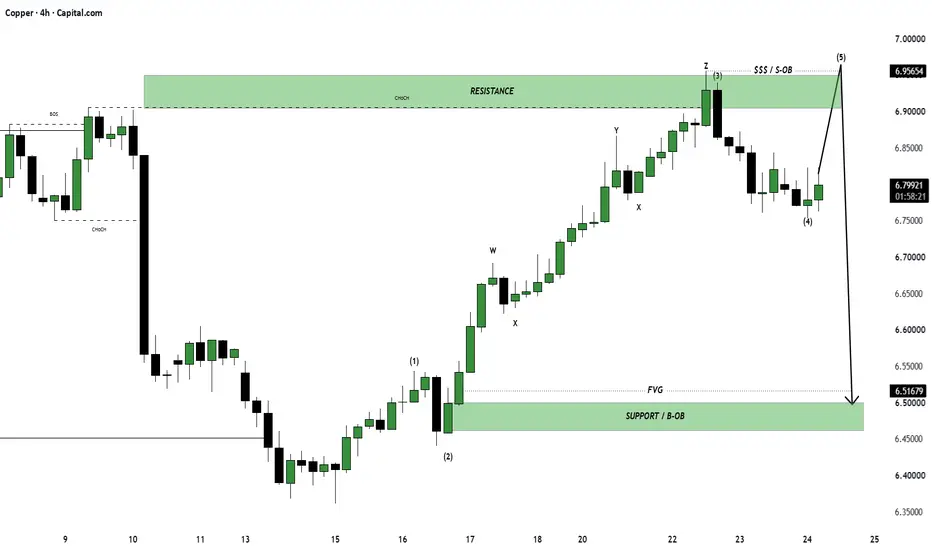
COPPER: The Exhaustion Is Still There — But There’s No TradeSince my previous Copper post, the structure has continued to show exactly what originally caught my attention:
Exhaustion.
Price continues to grind higher, repeatedly sweeping highs while leaving significant lows untouched underneath.
That behavior still keeps me interested in a potential bearish expansion.
However, there is an important distinction:
There is currently NO tradable model according to my schematics.
The range has effectively developed a 4th tap, and 4-tap models simply do n
Copper:The saucer is building,$6.89 Is the line!Here is my analysis of Copper futures and the trade setup I've made as of 21 September 2026, when Copper saw its 11th gain out of 12 weeks after the Yangshan premium the best real-time indicator of Chinese import demand,hit its highest level since November 2022 at $121 per tonne, while the Chinese refineries are expected to be undergoing maintenance from October to November, taking out supply at the very point when Golden September and Silver October start their consumption period. The treatment
COPPER | XCUUSD COPPER | XCUUSD
⚡ AI, Data Centers & Electrification | Can a Breakout Trigger the Next Bullish Leg?
Hello everyone, and welcome to another market analysis on TradingView! 👋📊
Today we are looking at Copper, one of the most important industrial metals in the global economy — and increasingly an important component of the AI, data-center and electrification cycle. 🤖⚡
🧠 Fundamental Outlook
Copper is essential for power grids, electrical cables, motors, industrial equipment, EVs, renewable energy