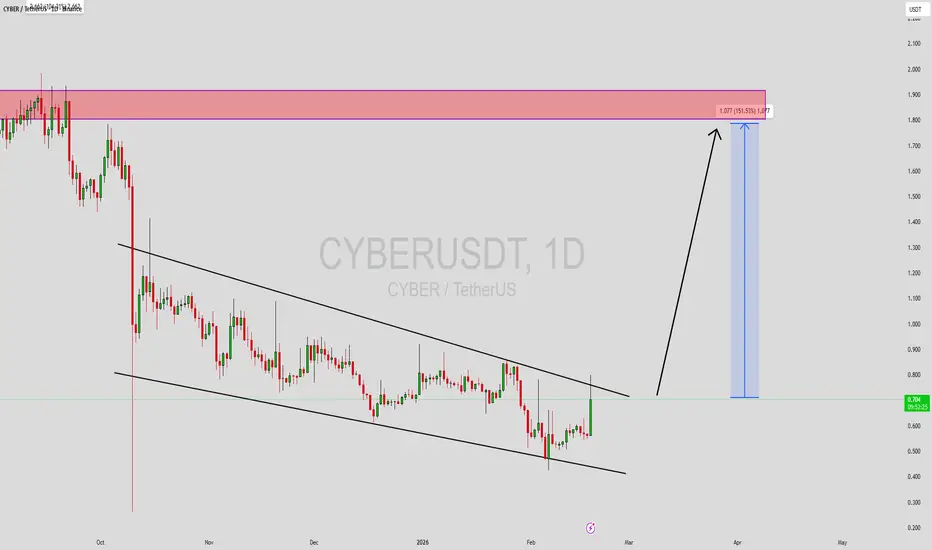
#CYBERUSDT Forming Bullish Continuation ?#CYBER
The price is moving within a descending channel on the 1-hour timeframe; it has reached the lower boundary and is poised for a rebound. A retest of this boundary is expected, supporting some upward movement.
The Relative Strength Index (RSI) indicates a bearish trend, but an upward breakout is likely due to oversold conditions on the 1-hour timeframe.
An orange trend line supports an upward rebound.
There is initial support at 0.295, acting as a preliminary support zone.
A key suppor
In-depth trading ideas
#CYBERUSDT Forming Bullish Continuation ?#CYBER
The price is moving within a descending channel on the 1-hour timeframe and has reached the lower boundary. It is now poised for a bounce and is expected to retest this boundary.
The Relative Strength Index (RSI) indicates a downward trend, which is likely to continue given the overbought conditions.
A key support zone (in green) has been identified at 0.282. The price has bounced off this zone several times, making it a strong support level.
The price is trending towards the 100-peri
CYBERUSDT 1D#CYBER is trading within a descending channel on the daily timeframe and is on the verge of breaking out above the channel resistance, the Ichimoku Cloud, and the daily EMA50. In case of a confirmed breakout above these levels, the potential upside targets are:
🎯 $0.379
🎯 $0.480
🎯 $0.600
🎯 $0.697
🎯 $0.794
🎯 $0.932
🎯 $1.108
⚠️ Always remember to use a tight stop-loss and maintain proper risk management.
#CYBERUSDT Forming Bullish Continuation ?#CYBER
The price is moving within a descending channel on the 1-hour timeframe and has reached the lower boundary. It is now poised for a bounce and is expected to retest this boundary.
The Relative Strength Index (RSI) indicates a downward trend, which is likely to continue given the overbought conditions.
There is a key support zone in green at 0.319, and the price has bounced off this zone several times, making it a strong support level.
The price is trending towards the 100-period moving
#CYBERUSDT Forming Bullish Continuation ?#CYBER
The price is moving within a descending channel on the 1-hour timeframe and has reached the lower boundary. It is now poised for a bounce and is expected to retest this boundary.
The Relative Strength Index (RSI) indicates a downward trend, which is likely to continue given the overbought conditions.
A key support zone (in green) has been identified at 0.280. The price has bounced off this zone several times, making it a strong support level.
The price is trending towards the 100-peri
#CYBERUSDT Forming Bullish Continuation ?#CYBER
The price is moving within a descending channel on the 1-hour timeframe and has reached the lower boundary. It is now poised for a bounce and is expected to retest this boundary.
The Relative Strength Index (RSI) indicates a downward trend, which is likely to continue given the overbought conditions.
A key support zone (in green) has been identified at 0.320. The price has bounced off this zone several times, making it a strong support level.
The price is trending towards the 100-peri
#CYBERUSDT Forming Bullish Continuation ?#CYBER
The price is moving within a descending channel on the 1-hour timeframe and has reached the lower boundary. It is now poised for a bounce and is expected to retest this boundary.
The Relative Strength Index (RSI) indicates a downward trend, which is likely to continue given the overbought conditions.
There is a key support zone in green at 0.313, and the price has bounced off this zone several times, making it a strong support level.
The price is trending towards the 100-period moving
#CYBERUSDT Forming Bullish Continuation ?#CYBER
The price is moving within a descending channel on the 1-hour timeframe and has reached the lower boundary. It is now poised for a bounce and is expected to retest this boundary.
The Relative Strength Index (RSI) indicates a downward trend, which is likely to continue given the overbought conditions.
There is a key support zone in green at 0.330. The price has bounced off this zone several times, making it a strong support level.
The price is trending towards the 100-period moving ave
CYBERUSDT - Bear Flag: Breakdown Ahead Toward Lower?On the 8H timeframe, CYBER/USDT remains in a dominant downtrend structure after experiencing a sharp decline from above the $0.50 region. Price is currently trading within a Bear Flag 🐻🚩 formation, a classic continuation pattern that often develops after a strong bearish impulse.
A Bear Flag forms when price enters a temporary upward consolidation channel following a significant decline (the flagpole). This structure is often interpreted as a distribution phase before the next leg lower begins.
#CYBERUSDT Forming Bullish Continuation ?#CYBER
The price is moving within a descending channel on the 1-hour timeframe and has reached the lower boundary. It is now poised for a bounce and is expected to retest this boundary.
The Relative Strength Index (RSI) indicates a downward trend, which is likely to continue given the overbought conditions.
There is a key support zone in green at 0.444. The price has bounced off this zone several times, making it a strong support level.
The price is trending towards the 100-period moving ave
CYBERUSDT | Long-Term Downtrend Compression → BreakoutCYBERUSDT | Long-Term Downtrend Compression → Breakout → Multi-Stage Expansion 🚀
CYBERUSDT has been trading under a prolonged bearish structure, forming consistent lower highs within a descending trendline. However, recent price action shows signs of trend exhaustion and a shift toward accumulation at the lows.
━━━━━━━━━━━━━━━
📊 Market Structure Breakdown
• Extended downtrend with strong trendline respect
• Gradual compression near base → reduced volatility
• Formation of a tight ra
#CYBERUSDT Forming Bullish Continuation ?#CYBER
The price is moving within a descending channel on the hourly timeframe. It has reached the lower boundary and is trending towards a bounce. A retest of this boundary is expected.
The Relative Strength Index (RSI) indicates a downward trend, and this trend is likely to continue due to the overbought condition.
A key support zone (in green) has been identified at 0.500. The price has bounced off this zone several times, making it a strong support level.
The price is trending towards th
#CYBER/USDT Forming Bullish Continuation ?#CYBER
The price is moving within a descending channel on the hourly timeframe. It has reached the lower boundary and is trending towards a bounce. A retest of this boundary is expected.
The Relative Strength Index (RSI) indicates a downward trend, and this trend is likely to continue due to the overbought condition.
There is a key support zone in green at 0.568, and the price has bounced off this zone several times, making it a strong support level.
The price is trending towards the 100-per
#CYBERUSDT Forming Bullish Continuation ?#CYBER
The price is moving within a descending channel on the 1-hour timeframe and has reached the lower boundary. It is now poised for a bounce and is expected to retest this boundary.
The Relative Strength Index (RSI) indicates a downward trend, which is likely to continue given the overbought conditions.
There is a key support zone (in green) at 0.500. The price has bounced off this zone several times, making it a strong support level.
The price is trending towards the 100-period moving a
#CYBERUSDT Forming Bullish Continuation ?#CYBER
The price is moving within a descending channel on the hourly timeframe. It has reached the lower boundary and is trending towards a bounce. A retest of this boundary is expected.
The Relative Strength Index (RSI) indicates a downward trend, and this trend is likely to continue due to the overbought condition.
There is a key support zone in green at 0.500, and the price has bounced off this zone several times, making it a strong support level.
The price is trending towards the 100-per
#CYBER/USDT Forming Bullish Continuation ?#CYBER
The price is moving within a descending channel on the hourly timeframe. It has reached the lower boundary and is trending towards a bounce. A retest of this boundary is expected.
The Relative Strength Index (RSI) indicates a downward trend, and this trend is likely to continue due to the overbought condition.
A key support zone (in green) was found at 0.530, and the price has bounced off this zone several times, making it a strong support level.
The price is trending towards the 100-
CYBER Showing Weakness at Resistance–Bearish Reversal Incoming?#$CYBER is currently in a strong uptrend with high volume, but price action is now flashing early warning signs on the 30-minute timeframe.
What I’m Seeing:
Strong bullish structure (HH & HL)
Multiple rejections at a key resistance zone
Bearish Divergence on RSI
Clear Double Top Formation
Despite the bullish momentum, price failed to break resistance, which suggests buyers are losing strength.
Trade Plan (Bearish Scenario)
I’m not entering early — waiting for confirmation.
Clear support break
CYBERUSDT 1D#CYBER is trading within a falling wedge pattern on the daily timeframe. Volume has increased significantly, and the price is currently facing resistance at the wedge resistance and the daily SMA50. In case of a breakout above both levels, the potential upside targets are:
🎯 $0.950
🎯 $1.097
🎯 $1.245
🎯 $1.455
🎯 $1.722
⚠️ Always use tight stop-losses and maintain strict risk management.
CYBERUSDT Forming Falling WedgeCYBERUSDT is forming a clear falling wedge pattern, a classic bullish reversal signal that often indicates an upcoming breakout. The price has been consolidating within a narrowing range, suggesting that selling pressure is weakening while buyers are beginning to regain control. With consistent volume confirming accumulation at lower levels, the setup hints at a potential bullish breakout soon. The projected move could lead to an impressive gain of around 140% to 150% once the price breaks above
#CYBER/USDT Forming Bullish Continuation ?#CYBER
The price is moving within a descending channel on the hourly timeframe. It has reached the lower boundary and is heading towards a breakout, with a retest of the upper boundary expected.
The Relative Strength Index (RSI) is showing a downward trend, approaching the lower boundary, and an upward bounce is anticipated.
There is a key support zone in green at 0.494, and the price has bounced from this level several times. Another bounce is expected.
The RSI is showing a trend towards co
#CYBER/USDT Forming Bullish Continuation ?#CYBER
The price is moving within a descending channel on the hourly timeframe. It has reached the lower boundary and is heading towards a breakout, with a retest of the upper boundary expected.
The Relative Strength Index (RSI) is showing a downward trend, approaching the lower boundary, and an upward bounce is anticipated.
There is a key support zone in green at 0.500, and the price has bounced from this level several times and is expected to bounce again.
The indicator is showing a trend