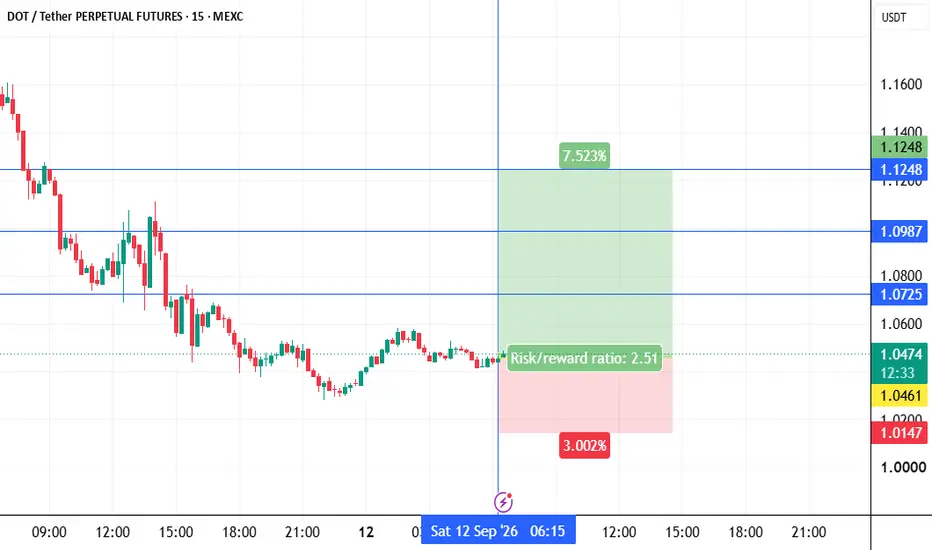
#DOTUSDT Ready to go higher#DOT
The price is moving within a descending channel on the 1-hour timeframe and has reached the lower boundary. It is now poised for a bounce and is expected to retest this boundary.
The Relative Strength Index (RSI) indicates a downward trend, which is likely to continue due to overbought conditions.
A key support zone (in green) has been identified at 0.782. The price has bounced off this zone several times, making it a strong support level.
The price is trending towards the 100-period moving average, which we are approaching. This trend supports an upward move.
Entry Price: 0.819
Target 1: 0.829
Target 2: 0.842
Target 3: 0.858
You can close at the second target or wait for the third target to be reached. The choice is yours.
Stop Loss: At the resistance zone (in green).
Remember this simple rule: Money Management.
Any questions? Please leave a comment.
Thank you.
In-depth trading ideas
๏ปฟDOT at macro floor: base recovery toward $0.9790The Macro Picture ๐บ๏ธ
DOT ground down from the $1.4380 high all the way to the $0.7950 macro floor and has flattened into a base right on it at $0.8206. The steady selling has given way to a sideways grind on the support โ exhaustion rather than continuation.
The Setup โ๏ธ
The Accumulation Zone ๐ข
$0.7950โ0.8206 is where the selling has dried up. Macro Support has held on retest, and this is the demand shelf a recovery would build from.
The Decision Point ๐ด
$1.4380 (Local High) is the structural gate far above. Before it, the $0.9790 measured-move target is the first objective โ reclaiming it proves buyers are stepping back in.
The Roadmap ๐ฃ๏ธ
Hold the $0.7950 floor โ recover toward $0.9790 as the first leg up. Invalidation is a clean daily close below $0.7950 โ that voids the accumulation thesis.
This is a textbook DCA Accumulation Zone setup: scale in across the $0.7950โ0.8206 band and let the base do the work.
More setups in profile.
#DOT #Polkadot #crypto #trading #TA #3Commas #DCA
DOT USDT LONG SIGNAL#106 DOT/USDT โ Trade Setup (LONG)
๐ Position Type: LONG
๐ Timeframe: 1H
๐ Market: Futures
๐ฐ Entry Zone:
0.8385
0.8275
๐ Stop-Loss:
0.8150
๐ฏ Take-Profit Targets:
โข TP1: 0.8547
โข TP2: 0.8758
โข TP3: 0.8950
โข TP4: 0.9158
โ๏ธ Leverage:
5 *10
โซ๏ธ After TP1, move SL to Entry + 0.2%.
โช๏ธ Exit Plan:
โข 40% at TP1
โข 20% at TP2
โข 20% at TP3
ย 20% at. TP4
๐ Risk Management:
Risk only 1โ2% of your capital per trade.
โ ๏ธ Always check and confirm the setup on your chart before entering the trade.
#DOTUSDT Ready to go higher#DOT
The price is moving within a descending channel on the 1-hour timeframe and has reached the lower boundary. It is now poised for a bounce and is expected to retest this boundary.
The Relative Strength Index (RSI) indicates a downward trend, which is likely to continue given the overbought conditions.
There is a key support zone in green at 0.800, and the price has bounced off this zone several times, making it a strong support level.
The price is trending towards the 100-period moving average, which we are approaching. This trend supports an upward move.
Entry Price: 0.830
Target 1: 0.842
Target 2: 0.853
Target 3: 0.865
Stop Loss: At the resistance zone in green
Remember this simple rule: Money management.
Any questions? Please leave a comment.
Thank you.
DOT USDT LONG SIGNAL#131. DOT/USDT โ Trade Setup (LONG)
๐ Position Type: LONG
๐ Timeframe: 1H
๐ Market: Futures
๐ฐ Entry Zone:
0.8115
๐ Stop-Loss:
0.7780
๐ฏ Take-Profit Targets:
โข TP1:ย 0.8434
โข TP2: 0.8723
โข TP3: 0.91
โข TP4
โ๏ธ Leverage:
5 *10
โซ๏ธ After TP1, move SL to Entry + 0.2%.
โช๏ธ Exit Plan:
โข 50% at TP1
โข 25% at TP2
โข 25% at TP3
ย
๐ Risk Management:
Risk only 1โ2% of your capital per trade.
โ ๏ธ Always check and confirm the setup on your chart before entering the trade.
DOT Remains Under Bearish Pressureโฆ!Yello Paradisers! Are you prepared for a potential sharp downside move on #DOT, or are you still calling this โjust a healthy pullbackโ while smart money quietly distributes above you? At first glance, the structure may look harmless. But when we remove emotions and read the chart objectively, the story changes completely. This is not a random retracement. This is a high-risk zone where discipline matters more than opinions.
๐#DOT formed a buying climax followed by a climactic action bar. This combination typically shows distribution. In simple terms, institutions use these aggressive spikes to offload positions into retail enthusiasm. When the crowd feels confident, smart money distributes quietly.
๐#DOT swept the upper trigger line of the buying climax but failed to sustain higher levels. This was followed by a candle breaking below the lower trigger line, which is a major probability that supply is taking control. We have also seen an upthrust test, adding even more weight to the bearish scenario. If bearish momentum continues, the next major downside target sits around 765, and it could be reached sooner than many traders expect.
๐#DOT has clearly respected the descending resistance trend-line and failed to break above it. This rejection is a key probability of ongoing structural weakness. At the same time, Overall structure is bearish and price has respected the order block zone of 4H time-frame during the retracement.
๐As long as price holds momentum within the order block zone the probability favours continuation lower. The immediate minor support sits around 798, which now acts as the first downside magnet if selling pressure persists.
๐If #DOT manages to break above the key resistance at 910 with a strong momentum candle, this whole bearish probability would be invalidated, and we could instead see a bullish continuation. As always, we do not force a bias. We allow price to confirm the next move before taking action.
Discipline is key, Paradisers! The charts may look volatile, but this is where professionals thrive and amateurs panic. Donโt let emotions guide your trades. Wait for clear confirmation and manage risk like a pro. Strive for consistency, not quick profits. Treat the market as a businessman, not as a gambler.
MyCryptoParadise
iFeel the success๐ด
DOTUSDT - Bear Flag Pattern โ Breakdown or Reversal?๐ช DOTUSDT on the 8H timeframe is currently forming a ๐ฉ Bear Flag, a classic bearish continuation pattern that develops after a sharp decline (๐ Flagpole), followed by a temporary upward consolidation within a slightly rising channel (๐ Rising Flag).
โ ๏ธ As long as the price remains inside the Bear Flag, selling pressure continues to dominate the market.
๐ The lower trendline support is the key level to watch. A decisive ๐ breakdown below this support could trigger another leg lower, following the projected Bear Flag target.
---
๐ฉ Pattern: Bear Flag
๐ The Bear Flag is a well-known bearish continuation pattern that typically appears after a strong downward impulse.
๐ Pattern Characteristics:
๐ป ๐ Begins with a sharp decline (Flagpole).
๐ Followed by an upward consolidation that forms a rising channel or flag.
โ ๏ธ A breakdown below the lower trendline confirms the bearish continuation.
๐ฏ The downside target is commonly measured by projecting the height of the Flagpole from the breakout point.
๐ Unless the price breaks above the upper resistance trendline, the bearish trend remains the dominant scenario.
---
๐ข Bullish Scenario
โ
A bullish scenario will only gain confirmation if the price can:
๐ข Break above the Bear Flag resistance with a strong and valid breakout candle.
๐ Hold above the breakout zone and successfully turn previous resistance into new support.
๐ Be supported by increasing trading volume, confirming buyer strength.
๐ If these conditions are met, the Bear Flag could become invalid (Bearish Invalidation), opening the door for a move toward the next resistance levels.
---
๐ด Bearish Scenario
โ ๏ธ As long as the price remains inside the Bear Flag, the bearish outlook continues to be the primary focus.
๐ Bearish confirmation occurs if:
๐ป Price breaks down below the lower trendline support.
๐ A candle closes below support with increasing selling volume.
๐จ The $0.800 support level fails to hold.
๐ฏ If the breakdown is confirmed, selling pressure could accelerate, driving the price lower in line with the Bear Flag projection.
---
๐ฏ Key Levels
๐ข Resistance: ๐ Upper Trendline of the Bear Flag.
๐ด Support: ๐ Lower Trendline of the Bear Flag.
โ ๏ธ Major Support: ๐ก $0.800 is a critical psychological support level. A confirmed breakdown below this area could strengthen the bearish momentum and lead to further downside.
---
๐ Conclusion
๐งฉ The ๐ฉ Bear Flag formation on DOTUSDT suggests that the current upward movement may simply be a ๐ corrective pullback within a larger downtrend.
๐ The market's reaction around the lower trendline support will be crucial.
๐ข A breakout above the flag resistance would invalidate the bearish setup and increase the probability of a bullish reversal.
๐ด A breakdown below support would confirm the continuation of the bearish trend, consistent with the characteristics of the Bear Flag pattern.
---
> โ ๏ธ Disclaimer: This analysis is provided for educational purposes only and should not be considered financial advice. Always conduct your own research (DYOR) and apply proper risk management before making any trading decisions.
#DOTUSDT #DOT #Crypto #Cryptocurrency #TechnicalAnalysis #TradingView #BearFlag #BearishContinuation #PriceAction #Support #Resistance #Altcoins #CryptoTrading
#DOTUSDT Ready to go higher#DOT
The price is moving within a descending channel on the 1-hour timeframe and has reached the lower boundary. It is now poised for a bounce and is expected to retest this boundary.
The Relative Strength Index (RSI) indicates a downward trend, which is likely to continue given the overbought conditions.
There is a key support zone in green at 0.800. The price has bounced off this zone several times, making it a strong support level.
The price is trending towards the 100-period moving average, which we are approaching. This trend supports an upward move.
Entry Price: 0.832
Target 1: 0.846
Target 2: 0.856
Target 3: 0.870
Stop Loss: At the resistance zone in green
Remember this simple rule: Money management.
Any questions? Please leave a comment.
Thank you.
DOT 4H โ Symmetrical Triangle Tightening Toward ApexDOT on the 4H timeframe is currently trading around 0.945 after oscillating inside a symmetrical triangle for nearly four weeks, with the descending upper trendline and rising lower trendline continuing to converge as price grinds toward the apex with diminishing range on each swing.
The chart shows a symmetrical triangle formed by a descending upper trendline originating from the June 22 high near 0.960, connecting through the July 5 high near 0.900 and the July 10 high near 0.890, while the rising lower trendline connects the June 29 low near 0.796 through the July 8 low near 0.818 and the July 12 low near 0.826, now climbing into the 0.832โ0.836 area. Each swing inside the triangle has been visibly shorter than the prior one, with the July 10 recovery reaching only 0.880โ0.890 before rolling over compared to the early July push toward 0.900. Two horizontal reference levels define the internal structure โ one near 0.855โ0.860 and a second near 0.840โ0.845 โ both of which have been crossed repeatedly without holding, confirming the compression is tightening around both. The descending upper trendline is now declining into 0.865โ0.870 while the lower trendline rises toward 0.832โ0.836, leaving a narrow band of roughly 35 points before the structure forces a resolution.
Price is currently sitting in the middle of that narrowing band near 0.845โ0.850, with both trendlines closing in and neither horizontal level providing any meaningful directional bias.
Key Levels To Watch
โ 0.950โ0.960 โ June high, major resistance above
โ 0.920โ0.930 โ Prior recovery high, resistance
โ 0.865โ0.870 โ Descending upper trendline, current overhead resistance (dynamic)
โ 0.855โ0.860 โ Horizontal pivot, upper internal reference
โ 0.840โ0.845 โ Horizontal support, lower internal reference
โ 0.832โ0.836 โ Rising lower trendline, dynamic support (climbing)
โ Below 0.796 โ Triangle breakdown, extended downside
A confirmed break above the descending upper trendline near 0.865โ0.870 and a close above 0.920โ0.930 would signal a bullish resolution, opening a move toward 0.950โ0.960 and potentially above the June high on continuation.
A confirmed break below the rising lower trendline near 0.832โ0.836 and a loss of 0.796 would signal a bearish resolution, removing the upward structure built since the June 29 low and opening downside below the triangle with no clear support visible beneath.
Triangle tightening with each swing shorter than the last, resolution imminent. Break above 0.865โ0.870 โ bullish resolution, eyes on 0.950โ0.960. Break below 0.832โ0.836 โ bearish resolution, downside toward 0.796 and below. Bias neutral inside compression. Direction confirmed only on a decisive close outside either trendline.
DOT USDT LONG SIGNALDOT/USDT โ 4H Analysis ๐
DOT is currently moving inside a triangle pattern on the 4-hour timeframe.
A confirmed breakout above the triangle, followed by price stabilization, could open the way for a bullish move toward the $0.90 target.
It is important to wait for breakout confirmation before entering a position.
โโโโโโโโโโโโโโ
Polkadot Nears Weekly SupportPolkadot (DOT) is approaching a major weekly support around $0.80, a level that could play a significant role in determining the next directional move. Price has been consolidating within a defined trading range, allowing liquidity to build on both sides of the market as buyers and sellers await a catalyst.
From a technical perspective, the current structure suggests that a liquidity sweep of the recent lows remains a possibility before any meaningful recovery begins. If price briefly breaks below the major swing low and quickly reclaims the weekly support, it would form a Swing Failure Pattern (SFP). This type of setup often traps late sellers and signals that buyers are stepping back into the market.
A confirmed SFP would strengthen the probability of an oversold bounce, with the first upside objective sitting around the $0.88 high-timeframe resistance. Reclaiming the weekly support after a liquidity sweep would also reinforce the broader range structure and improve the outlook for a rotational move higher.
However, if DOT fails to reclaim the support after taking out the lows, it would invalidate the bullish setup and increase the likelihood of a deeper correction.
For now, DOT is approaching a critical technical zone. Traders should watch closely for a potential liquidity sweep and reclaim, as this could provide the catalyst for the next bullish rotation from an oversold condition.
DOT 4H โ Symmetrical Triangle Compressing Into ApexDOT on the 4H timeframe is currently trading around 0.964 after oscillating inside a symmetrical triangle since late June, with the descending upper trendline and rising lower trendline now converging tightly as price approaches the apex of the structure.
The chart shows a symmetrical triangle formed by a descending upper trendline originating from the June 22 high near 0.980, connecting through the July 5 high near 0.910 and the July 10 high near 0.890, while the rising lower trendline connects the June 29 low near 0.801 through the July 9 low near 0.820 and continues to climb into the 0.830โ0.835 area. Price has respected both boundaries consistently, with recoveries capped by the descending trendline and pullbacks supported by the rising trendline each time. Two horizontal reference levels sit inside the triangle โ one near 0.850โ0.855 and a second near 0.840โ0.845 โ both of which have acted as pivots through the compression and are currently being tested as price sits just above them. The descending upper trendline is now declining into 0.880โ0.890 while the lower trendline rises toward 0.830โ0.835, leaving a narrow band remaining before a breakout is forced.
Price is currently sitting at the 0.845โ0.855 horizontal zone inside the triangle with both
trendlines converging rapidly, and the structure on the 4H timeframe gives the approaching resolution significant weight.
Key Levels To Watch
โ 0.960โ0.980 โ June high, major resistance above
โ 0.920โ0.930 โ Prior recovery high, resistance
โ 0.880โ0.890 โ Descending upper trendline, current overhead resistance (dynamic)
โ 0.850โ0.855 โ Horizontal pivot, upper reference inside triangle
โ 0.840โ0.845 โ Horizontal support, lower reference inside triangle
โ 0.820โ0.830 โ Rising lower trendline, dynamic support (climbing)
โ Below 0.801 โ Triangle breakdown, extended downside
A confirmed break above the descending upper trendline near 0.880โ0.890 and a close above 0.920โ0.930 would signal a bullish resolution out of the triangle, opening a move toward 0.960โ0.980 and potentially above the June high on continuation.
A confirmed break below the rising lower trendline near 0.820โ0.830 and a loss of 0.801 would signal a bearish resolution, removing the upward structure built since the June 29 low and opening downside with no clear support visible beneath.
Triangle apex approaching on the 4H, breakout direction will define the next significant move. Break above 0.880โ0.890 trendline โ bullish resolution, eyes on 0.960โ0.980. Break below 0.820โ0.830 โ bearish resolution, downside toward 0.801 and below. Bias neutral inside compression. Direction confirmed only on a decisive close outside either trendline.
#DOTUSDT#DOT
The price is moving within a descending channel on the 1-hour timeframe and has reached the lower boundary. It is now poised for a bounce and is expected to retest this boundary.
The Relative Strength Index (RSI) indicates a downward trend, which is likely to continue given the overbought conditions.
There is a key support zone in green at 0.786. The price has bounced off this zone several times, making it a strong support level.
The price is trending towards the 100-period moving average, which we are approaching. This trend supports an upward move.
Entry Price: 0.833
Target 1: 0.843
Target 2: 0.860
Target 3: 0.879
Stop Loss: At the resistance zone in green
Remember this simple rule: Money management.
Any questions? Please leave a comment.
Thank you.
DOT: failing bounce targets the $0.80 floorThe Macro Picture ๐บ๏ธ
DOT has been in a relentless descending structure since the $1.42 peak, and the June breakdown carried it straight down to the $0.82 low. Buyers managed a reflex bounce toward $0.90, but that relief rally is already unravelling โ RSI has rolled back under 40 and price is fading toward the $0.84 equilibrium, unable to reclaim the ground it lost. In a trend this heavy, a bounce that fails to reclaim its breakdown level is a continuation signal, not a reversal. The path of least resistance still points lower until bulls prove they can defend and reclaim overhead structure.
The Setup โ๏ธ
The Rejection: The bounce stalled well below the $0.95 local decision (red dashed), the level that flipped from support to resistance on the breakdown. As long as price stays capped beneath it, sellers keep the upper hand.
The Floor: The $0.80 macro support (solid green) stacks under the $0.82 local low to form the last high-confluence shelf. This is the battleground โ a break here opens fresh downside, while a firm defense is the only thing that sets up a base.
The Reaction: RSI fading back under 40 after the bounce signals the relief rally is exhausting, favoring another test of the floor over an immediate trend reversal.
The Roadmap: Primary target sits at $0.80 โ the red projection points toward a retest of the macro floor as the bounce fails. Invalidation: a sustained 1D close back above $0.95 would flip the structure and open the path toward the $1.20 macro ceiling.
More setups in profile.
dotusdt short Roddy01-SIGNALSPROVIDERInstructions:
Entry point: yellow
Stop loss: red
Take profit: green
๐Leverage x 5-10-20 for crypto
๐Leverage x 20-50-100 for commodities, stocks, indices, and forex
๐Margin 1-5% max.
Always practice risk and money management.
Invest a maximum of 5% on any trade or across all your trades.
Invest only what you can afford to lose, as no one is in control of the market.
๐Our analyses are primarily based on:
breakouts: two trend lines (ascending and descending) and a line indicating a horizontal breakout.
chart patterns: shoulders and head, triangle parttern,ย elliott impulse, etc etc.
We don't always have the time to track them at all times or to represent them visibly, given the numerous signals, the number of channels to manage, and especially because of the often rapid pace of market movements.
indicators: We associate at least two indicators with this technique.
๐Depending on the circumstances, we use specific indicators, often setting 3 or more take profit levels.
๐Indeed, there are good days in trading and also bad days. No one can promise to win every trade, and like all traders worldwide, we also experience stop-loss orders. However, we win more than we lose and remain positive.
๐You can close the position before or after the take profit orders indicated by the green lines if you are personally satisfied; the same applies to stop loss orders.
๐We must stay positive, clear-headed, and humble.
we cannot provide all instructions or all trades here on this channel.
Good luck to us all, and may God guide us. Amen
DOT 4H โ Channel Bounce Into Horizontal ResistanceDOT on the 4H timeframe is currently trading around 0.933 after dropping from the mid-June high near 1.030 through the lower boundary of a descending channel near 0.792โ0.800, then bouncing sharply back into the structure and pressing into the 0.880โ0.890 horizontal resistance zone.
The chart shows a descending channel forming from the June 17 high near 1.030, with the upper trendline connecting that high through the June 19 lower high near 0.980 and continuing to slope down into the 0.890โ0.900 area currently. The lower trendline caught the June 29 low near 0.792 before price reversed and recovered back inside the channel. Two horizontal levels define the key reference points in the post-drop structure โ one near 0.880โ0.890 which has acted as a pivot across multiple sessions in late June and early July, and a second near 0.855โ0.860 just below it that has been tested repeatedly since the bounce began. Price has recovered from the lower boundary and is now pressing directly into the 0.880โ0.890 zone with the descending upper trendline sitting just overhead.
The 0.880โ0.890 horizontal and the descending upper trendline are now converging at nearly the same level, creating a tight resistance cluster that price is pressing into from below.
Key Levels To Watch
โ 1.020โ1.030 โ June high, major resistance above
โ 0.960โ0.980 โ Prior consolidation zone, resistance
โ 0.920โ0.930 โ Minor resistance, recent range high
โ 0.880โ0.890 โ Descending upper trendline and horizontal resistance, current test
โ 0.855โ0.860 โ Horizontal pivot, immediate support below
โ 0.820โ0.830 โ Mid-channel support zone
โ 0.792โ0.800 โ Lower channel boundary, recent bounce low
A confirmed break above the 0.880โ0.890 resistance cluster and the descending upper trendline would signal a bullish resolution out of the channel, opening a move toward 0.920โ0.930 and potentially 0.960โ0.980 on continuation with the prior June high at 1.020โ1.030 as the broader target.
A rejection at the 0.880โ0.890 resistance cluster and a return below 0.855โ0.860 would keep the descending channel structure intact, leaving price exposed to another leg toward the lower boundary near 0.792โ0.800 and a potential breakdown below it on a confirmed close.
Bounce off lower boundary now pressing into converging resistance. Break above 0.880โ0.890 and trendline โ channel breakout, eyes on 0.960โ0.980. Reject here โ back toward lower boundary near 0.792โ0.800. Bias neutral inside channel. Shift bullish only on confirmed close above descending upper trendline.
DOT USDT SHORT SIGNAL#17 DOT/USDT โ Trade Setup (SHORT)
๐ Position Type: SHORT
๐ Timeframe: 1 H
๐ Market: Futures
๐ฐ Entry Zone:
0.868
๐ Stop-Loss:
0.893
๐ฏ Take-Profit Targets:
โข TP1:ย 0.854
โข TP2:ย 0.839
โข TP3:ย 0.826
โข TP4:ย 0.811
TP5:ย
TP6:ย
โ๏ธ Leverage:
5- 10
โ ๏ธ After reaching TP1, move Stop-Loss to Entry Price.
๐ Risk Management:
Risk only 1โ2% of your capital per trade.
Always confirm the setup on your chart before entry
#DOTUSDT Ready to go higher#DOT
The price is moving within a descending channel on the 1-hour timeframe and has reached the lower boundary. It is now poised for a bounce and is expected to retest this boundary.
The Relative Strength Index (RSI) indicates a downward trend, which is likely to continue given the overbought conditions.
There is a key support zone (in green) at 0.760. The price has bounced off this zone several times, making it a strong support level.
The price is trending towards the 100-period moving average, which we are approaching. This trend supports an upward move.
Entry Price: 0.814
Target 1: 0.826
Target 2: 0.842
Target 3: 0.864
Stop Loss: At the resistance zone (in green)
Remember this simple rule: Money management.
Any questions? Please leave a comment.
Thank you.
DOT USDT LONG SIGNALDOT /USDT โ Trade Setup LONG)
๐ Position Type: LONG
๐ Timeframe: 1 H
๐ Market: Futures
๐ฐ Entry Zone:
0.821
0.808
๐ Stop-Loss:
0.793
๐ฏ Take-Profit Targets:
โข TP1:ย 0.840
โข TP2:ย 0.864
โข TP3:ย ย 0.890
โข TP4:ย 0.910
TP5:ย
TP6:ย
โ๏ธ Leverage:
5- 10
โ ๏ธ After reaching TP1, move Stop-Loss to Entry Price.
๐ Risk Management:
Risk only 1โ2% of your capital per trade.
Always confirm the setup on your chart before entry
DOTUSDT at structural low: bullish reversal formingThe Macro Picture ๐บ๏ธ
DOT delivered on the post-breakdown thesis from June 6 โ price tagged the $0.85 capitulation target, the reactive RSI-driven bounce carried it to $1.05, supply at the broken floor rejected the move exactly where the prior idea said it would, and now price is testing $0.85 a second time. That's the textbook post-breakdown structure: first leg down, reactive bounce, retest. With price back at the structural low and RSI printing 22 alongside what looks like early bullish divergence, the chart sits at the exact pocket where post-flush reversals get built โ or where continuation traps the last bulls.
The Setup โ๏ธ
The Demand Pocket: The $0.80โ$0.85 zone has now been tested twice, with the second test holding above the early-June impulse low. RSI on this leg is printing shallower than its June capitulation read, opening the door to a bullish divergence that often precedes structural reversals after capitulation legs.
The Mid-Range Pivot: The $0.95 level is the first reclaim that confirms buyers are absorbing supply โ it sat as resistance on the way down and now becomes the gate price needs to flip to validate the reversal mechanic.
The Supply Zone: The $1.00โ$1.10 band capped the mid-June bounce and remains the wall that defines the trend. A clean daily close above $1.10 flips the post-breakdown read into a fresh range build, with the $1.20 failed range floor as the next magnet overhead.
The Roadmap: Primary target sits at $1.05 โ as indicated by the white projection, a reclaim of $0.95 opens the path back to the supply zone where the mid-June bounce stalled. Invalidation: a sustained 1D close below $0.80 would invalidate this reversal thesis and extend the breakdown into the next demand pocket beneath.
#DOTUSDT Ready to go higher#DOT
The price is moving within a descending channel on the 1-hour timeframe and has reached the lower boundary. It is now poised for a bounce and is expected to retest this boundary.
The Relative Strength Index (RSI) indicates a downward trend, which is likely to continue given the overbought conditions.
There is a key support zone in green at 0.860. The price has bounced off this zone several times, making it a strong support level.
The price is trending towards the 100-period moving average, which we are approaching. This trend supports an upward move.
Entry Price: 0.907
Target 1: 0.919
Target 2: 0.935
Target 3: 0.953
Stop Loss: At the resistance zone in green
Remember this simple rule: Money management.
Any questions? Please leave a comment.
Thank you.