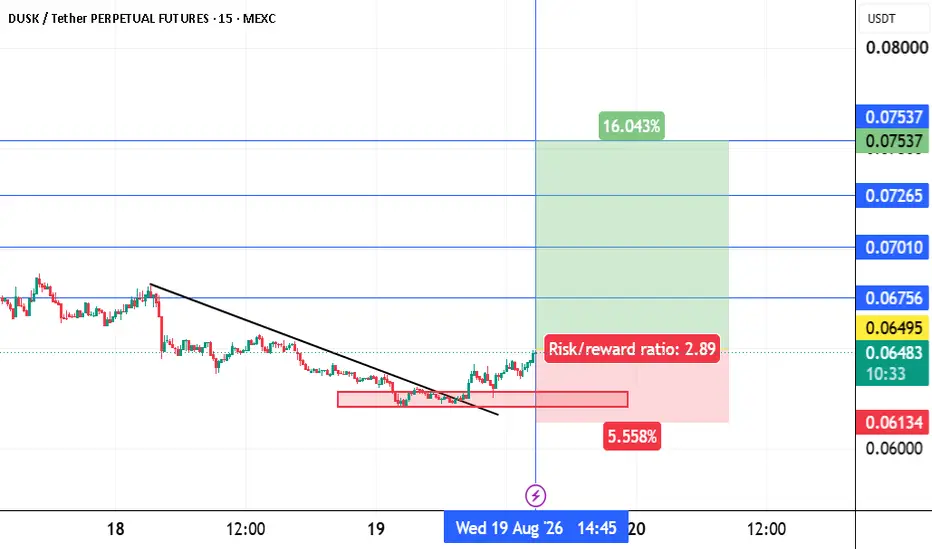
DUSKUSDT LONGInstructions:
Entry point: yellow
Stop loss: red
Take profit: green
👉Leverage x 5-10-20 for crypto
👉Leverage x 20-50-100 for commodities, stocks, indices, and forex
👉Margin 1-5% max.
Always practice risk and money management.
Invest a maximum of 5% on any trade or across all your trades.
Invest on
DUSKUSDT - Major Weekly Demand Zone – Rebound or Breakdown?📊 Technical Analysis
💵 Coin: CRYPTOCAP:DUSK #DUSK
⏳ Time Frame: 1W (Weekly)
📈 Pattern: Long-Term Horizontal Support (Major Demand Zone)
---
🟨 Key Support Zone
Yellow Block: $0.045 – $0.034
📌 This area represents a major historical demand and support zone that has triggered multiple price reve
DUSKUSDT 1D#DUSK may retest the support zone and the daily SMA100 once more before the next leg up. Keep an eye on it. In case of a successful bounce, the potential upside targets are:
🎯 $0.1632
🎯 $0.1840
🎯 $0.2135
🎯 $0.2512
⚠️ Always remember to use a tight stop-loss and maintain proper risk management.
DUSKUSDT Forming Bullish MomentumDUSKUSDT is forming a clear bullish momentum pattern, a classic bullish reversal signal that often indicates an upcoming breakout. The price has been consolidating within a narrowing range, suggesting that selling pressure is weakening while buyers are beginning to regain control. With consistent vo
DUSK Macro Accumulation With Breakout PotentialDUSK is currently trading in the middle of a long-term descending channel, which places price in a neutral equilibrium zone rather than at extreme support or resistance.
After a strong bounce from the lower boundary, price has shifted into a short-term ascending structure, showing early signs of st
The drawing will be a roadmap if the currency is only rising As you can see from this chart, this is a roadmap for you to keep.
You will find all the upward trend lines. Which of these lines represents resistance? Note that the currency is preparing to return to above 70 cents again.
I put a lot of effort into drawing the lines. Don't forget to follow me and
DUSK is still in a bearish structure (4H)From the point where we placed the red arrow on the chart, the corrective phase in DUSK began. Since that level, price action has developed within a clear corrective structure, and based on the current wave count, it appears that wave D has now completed.
With wave D likely finished, the market may
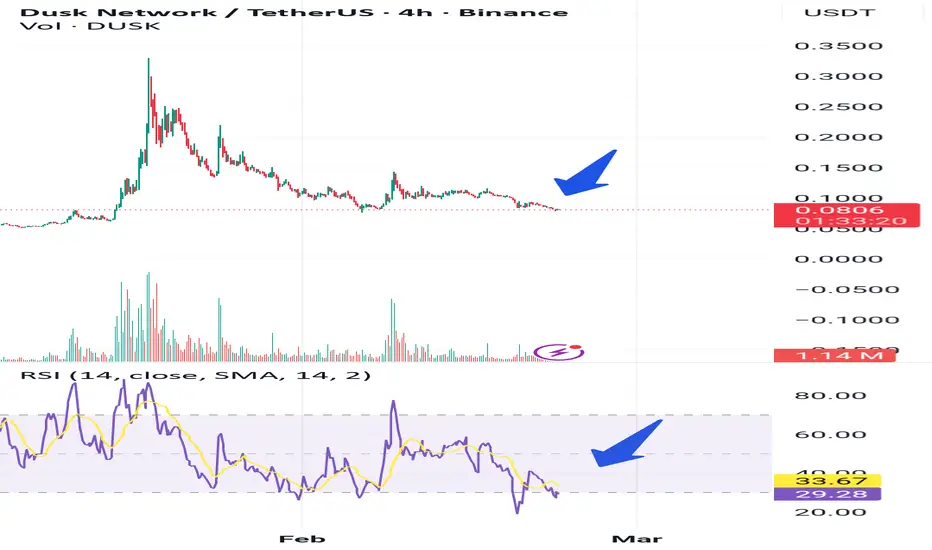
Buy the blood sell the greedWe've literally bottomed out at this level multiple times from a macro perspective. Had our ABC correction and are in consolidation now. Perfect time to buy. When its boring. RSI looks excellent for a long position as well.
Dusk has better EU compliance and institutional backing when compared to X
See all ideas
Summarizing what the indicators are suggesting.
Oscillators
Neutral
SellBuy
Strong sellStrong buy
Strong sellSellNeutralBuyStrong buy
Oscillators
Neutral
SellBuy
Strong sellStrong buy
Strong sellSellNeutralBuyStrong buy
Summary
Neutral
SellBuy
Strong sellStrong buy
Strong sellSellNeutralBuyStrong buy
Summary
Neutral
SellBuy
Strong sellStrong buy
Strong sellSellNeutralBuyStrong buy
Summary
Neutral
SellBuy
Strong sellStrong buy
Strong sellSellNeutralBuyStrong buy
Moving Averages
Neutral
SellBuy
Strong sellStrong buy
Strong sellSellNeutralBuyStrong buy
Moving Averages
Neutral
SellBuy
Strong sellStrong buy
Strong sellSellNeutralBuyStrong buy
Displays a symbol's price movements over previous years to identify recurring trends.