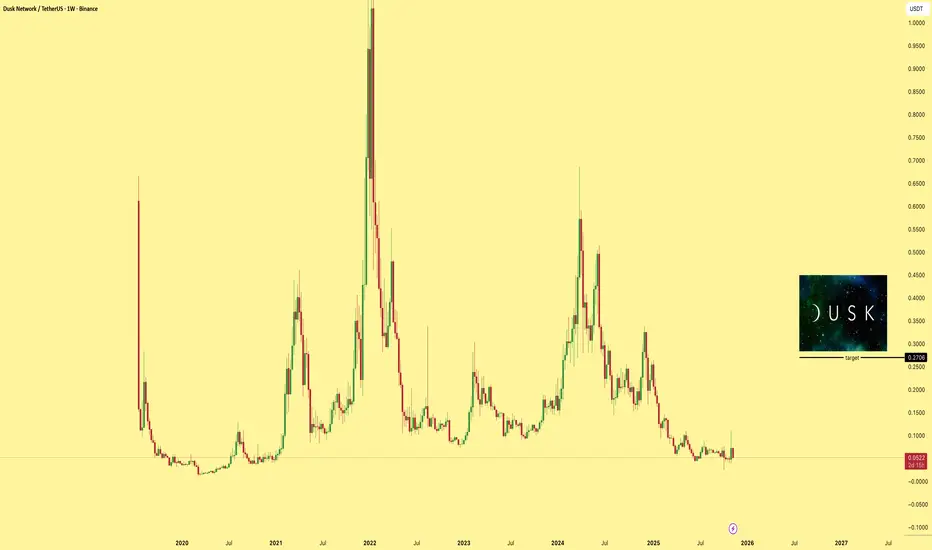
DUSKUSDT LONGInstructions:
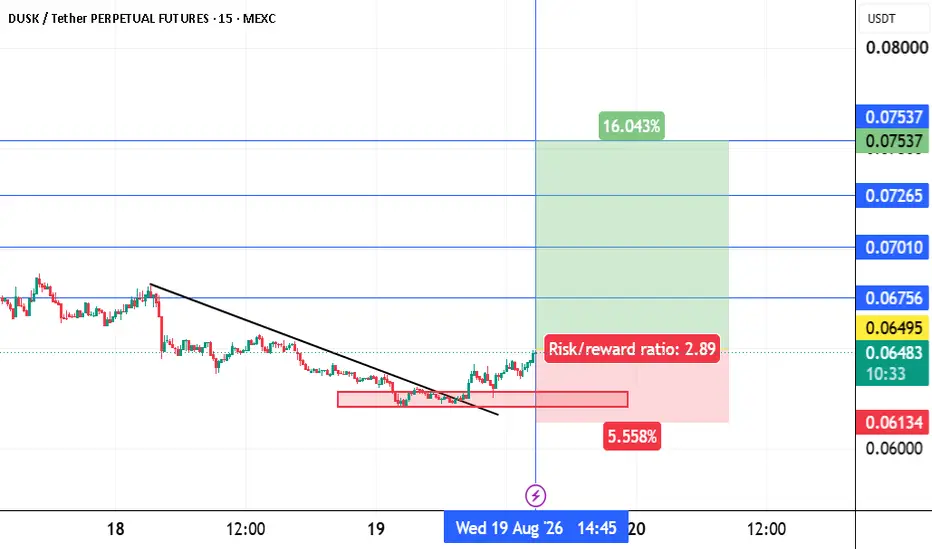
Entry point: yellow
Stop loss: red
Take profit: green
👉Leverage x 5-10-20 for crypto
👉Leverage x 20-50-100 for commodities, stocks, indices, and forex
👉Margin 1-5% max.
Always practice risk and money management.
Invest a maximum of 5% on any trade or across all your trades.
Invest only what you can afford to lose, as no one is in control of the market.
👉Our analyses are primarily based on:
breakouts: two trend lines (ascending and descending) and a line indicating a horizontal breakout.
chart patterns: shoulders and head, triangle parttern, elliott impulse, etc etc.
We don't always have the time to track them at all times or to represent them visibly, given the numerous signals, the number of channels to manage, and especially because of the often rapid pace of market movements.
indicators: We associate at least two indicators with this technique.
👉Depending on the circumstances, we use specific indicators, often setting 3 or more take profit levels.
👉Indeed, there are good days in trading and also bad days. No one can promise to win every trade, and like all traders worldwide, we also experience stop-loss orders. However, we win more than we lose and remain positive.
👉You can close the position before or after the take profit orders indicated by the green lines if you are personally satisfied; the same applies to stop loss orders.
👉We must stay positive, clear-headed, and humble.
we cannot provide all instructions or all trades here on this channel.
Good luck to us all, and may God guide us. Amen.
In-depth trading ideas
DUSKUSDT - Major Weekly Demand Zone – Rebound or Breakdown?📊 Technical Analysis
💵 Coin: CRYPTOCAP:DUSK #DUSK
⏳ Time Frame: 1W (Weekly)
📈 Pattern: Long-Term Horizontal Support (Major Demand Zone)
---
🟨 Key Support Zone
Yellow Block: $0.045 – $0.034
📌 This area represents a major historical demand and support zone that has triggered multiple price reversals since 2020.
🔹 Price is now approaching this critical region once again, making the buyers' reaction here crucial for determining the next major market direction.
---
📊 Pattern Analysis
🔸 🟨 Long-Term Horizontal Support
Price has bounced from the $0.045 – $0.034 zone multiple times.
This indicates strong historical buying interest within this range.
As long as this support holds, the possibility of a relief rally remains intact.
🔸 📉 Primary Trend Remains Bearish
The market structure continues to print Lower Highs and Lower Lows.
Until DUSK establishes a Higher High, the broader trend remains bearish.
🔸 ⚡ Major Decision Zone
This support area is a key decision point for the market.
A strong bounce or a confirmed breakdown here will likely determine DUSK's medium- to long-term direction.
---
🟢 Bullish Scenario (≈65%)
✅ Price successfully holds above the $0.045 – $0.034 demand zone.
📈 If buyers regain control, the potential upside targets are:
🎯 Target 1: $0.07 (Nearest Resistance)
🎯 Target 2: $0.10
🎯 Target 3: $0.14 – $0.16
🚀 If bullish momentum continues to strengthen, DUSK could potentially revisit even higher resistance levels on the weekly timeframe.
---
🔴 Bearish Scenario (≈35%)
❌ If the weekly candle closes below $0.034, then:
⚠️ The major historical support would be considered broken.
📉 This could trigger another wave of selling pressure as buyers lose their primary defensive zone.
🔻 A breakdown accompanied by strong selling volume would provide stronger confirmation that bears remain in control.
---
👀 Key Things to Watch
👁️ Monitor the weekly candle reaction as price enters the demand zone.
📊 Increasing buying volume would strengthen the bullish outlook.
⚠️ Avoid FOMO before a confirmed bullish reversal is established.
🎯 The $0.045 – $0.034 range is a high-probability reaction zone, but waiting for clear price action confirmation remains the safest approach.
---
📝 Conclusion
📌 DUSK is currently testing a major weekly demand zone that has historically acted as a strong reversal area.
🟢 As long as the $0.045 – $0.034 support holds, the probability of a rebound toward higher resistance levels remains favorable.
🔴 However, if this zone is decisively broken with a convincing weekly close, the bearish trend would likely strengthen, increasing the risk of further downside.
#DUSK #DUSKUSDT #Crypto #Cryptocurrency #TechnicalAnalysis #PriceAction #Support #DemandZone #WeeklyChart #Altcoins #CryptoTrading #Binance #MarketAnalysis #SwingTrading #Bullish #Bearish #CryptoSignals
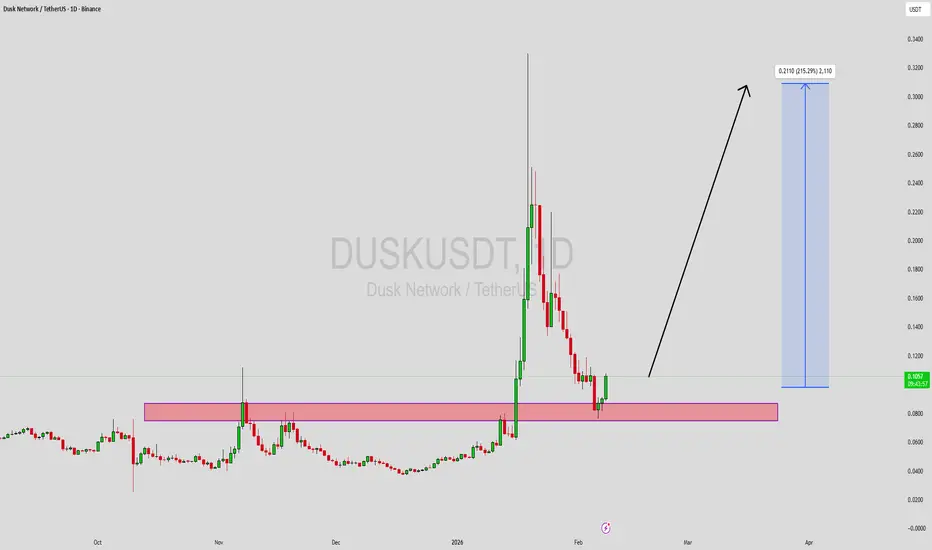
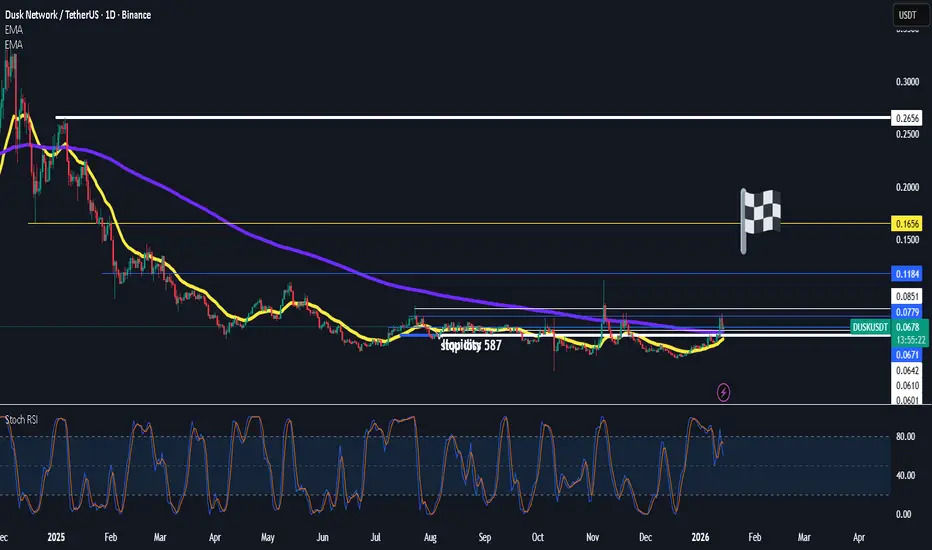
DUSKUSDT 1D#DUSK may retest the support zone and the daily SMA100 once more before the next leg up. Keep an eye on it. In case of a successful bounce, the potential upside targets are:
🎯 $0.1632
🎯 $0.1840
🎯 $0.2135
🎯 $0.2512
⚠️ Always remember to use a tight stop-loss and maintain proper risk management.
DUSKUSDT Forming Bullish MomentumDUSKUSDT is forming a clear bullish momentum pattern, a classic bullish reversal signal that often indicates an upcoming breakout. The price has been consolidating within a narrowing range, suggesting that selling pressure is weakening while buyers are beginning to regain control. With consistent volume confirming accumulation at lower levels, the setup hints at a potential bullish breakout soon. The projected move could lead to an impressive gain of around 190% to 200% once the price breaks above the wedge resistance.
This bullish momentum pattern is typically seen at the end of downtrends or corrective phases, and it represents a potential shift in market sentiment from bearish to bullish. Traders closely watching DUSKUSDT are noting the strengthening momentum as it nears a breakout zone. The good trading volume adds confidence to this pattern, showing that market participants are positioning early in anticipation of a reversal.
Investors’ growing interest in DUSKUSDT reflects rising confidence in the project’s long-term fundamentals and current technical strength. If the breakout confirms with sustained volume, this could mark the start of a fresh bullish leg. Traders might find this a valuable setup for medium-term gains, especially as the pattern completes and buying momentum accelerates.
✅ Show your support by hitting the like button and
✅ Leaving a comment below! (What is your opinion about this Coin?)
Your feedback and engagement keep me inspired to share more insightful market analysis with you!
DUSK Macro Accumulation With Breakout PotentialDUSK is currently trading in the middle of a long-term descending channel, which places price in a neutral equilibrium zone rather than at extreme support or resistance.
After a strong bounce from the lower boundary, price has shifted into a short-term ascending structure, showing early signs of strength. However, it is now consolidating around the mid-channel region (~0.07–0.12), which often acts as a decision point in trending markets.
The highlighted 0.06 – 0.08 zone remains a key demand area, and the current pullback looks like a healthy retracement within a developing recovery, not a confirmed breakdown.
Key levels to watch
• 0.10 – 0.12: Mid-channel resistance / decision zone
• 0.20 – 0.27: Upper channel resistance
• 0.06 – 0.08: Demand / higher low zone
• 0.030: Major support (channel low)
Scenario outlook
• Bullish case:
If DUSK holds above the mid-zone and maintains higher lows, price could continue the recovery toward 0.20 – 0.27, eventually testing the upper boundary of the channel.
• Bearish case:
If price fails to hold structure and loses momentum, it could rotate back toward the 0.06 – 0.08 demand zone, keeping price range-bound inside the channel.
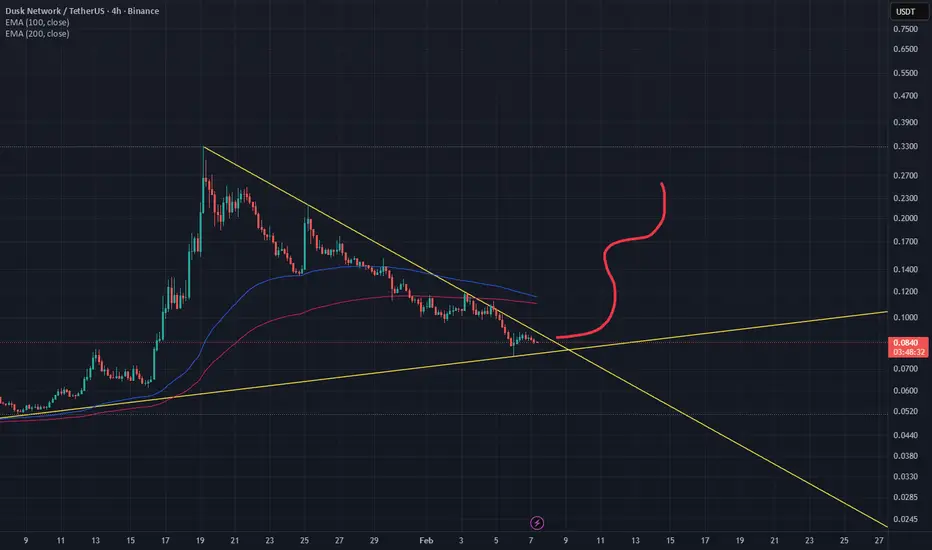
The drawing will be a roadmap if the currency is only rising As you can see from this chart, this is a roadmap for you to keep.
You will find all the upward trend lines. Which of these lines represents resistance? Note that the currency is preparing to return to above 70 cents again.
I put a lot of effort into drawing the lines. Don't forget to follow me and like the post.
DUSK is still in a bearish structure (4H)From the point where we placed the red arrow on the chart, the corrective phase in DUSK began. Since that level, price action has developed within a clear corrective structure, and based on the current wave count, it appears that wave D has now completed.
With wave D likely finished, the market may now be preparing to form wave E, which is typically the final leg of this corrective pattern and is expected to move to the downside. If this scenario plays out, wave E could present a bearish opportunity.
The preferred strategy is to look for short positions on pullbacks, rather than chasing price at lows. Any retracement into the highlighted red zone can be considered a potential entry area, provided that bearish confirmation appears on lower timeframes. This zone represents our planned sell area based on structure and resistance alignment.
The downside targets are clearly marked on the chart and align with key support levels and projected wave completion areas. These levels can be used for partial profit-taking or full position exits depending on your risk management plan.
Risk management remains essential. A daily candle close above the invalidation level will invalidate this analysis and suggest that the wave count is no longer valid. In that case, the bearish scenario should be reconsidered.
As always, wait for confirmation, manage risk carefully, and avoid overexposure
If you have a coin or altcoin you want analyzed, first hit the like button and then comment its name so I can review it for you.
This is not a trade setup, as it has no precise stop-loss, stop, or target. I do not publish my trade setups here
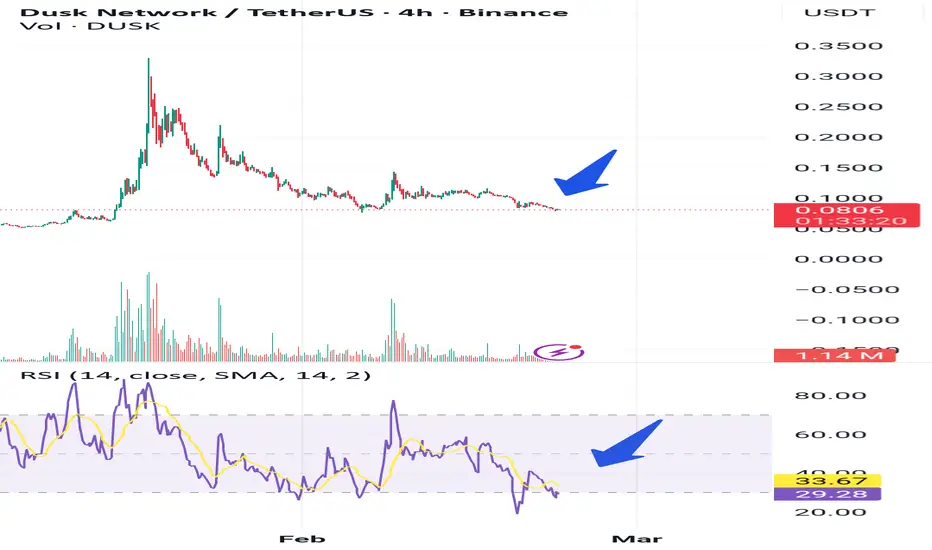
Buy the blood sell the greedWe've literally bottomed out at this level multiple times from a macro perspective. Had our ABC correction and are in consolidation now. Perfect time to buy. When its boring. RSI looks excellent for a long position as well.
Dusk has better EU compliance and institutional backing when compared to XMR, far less risky. I believe this project is solid & will do another 10-20X as long as big daddy BTC don't shi* the bed.
Dusk Network bull market active, new all-time high possible soonWe've been looking at many altcoins in order to show a, and support our, marketwide bullish bias. Yes, indeed we saw a correction but that's the end of it.
Some projects are certainly more advanced than others. Some projects leave no room for doubt as they already produced outstanding growth.
Some have been producing higher lows and higher highs for a prolonged time, while others produced a very strong bullish breakout just to cement and confirm their 2025 bear market bottom.
Dusk Network hit bottom mid-December 2025. An entire group bottomed in December last year and the market always moves in groups.
A group bottomed in October 2025 and never looked back. Another group in November, then another one in December and finally, another group in February. Strong variations like this will continue to happen.
DUSKUSDT. It has been four weeks since the major high last month. Needless to say, DUSKUSDT is preparing to resume through positive momentum. A higher high is the most likely scenario. A market advance comes next.
This chart has all the classic signals: A bullish lower low, a very strong breakout with the highest volume ever and now, the classic retrace ending in a higher low. This combination all leads to additional bullish action. And this confirms what I've been saying to you, the Cryptocurrency market is set to grow next.
Thank you for reading, your continued support is highly appreciated.
Namaste.
DUSKUSDT Forming Bullish ContinuationDUSKUSDT is forming a clear bullish continuation pattern, a classic bullish wave signal that often indicates an upcoming breakout. The price has been consolidating within a narrowing range, suggesting that selling pressure is weakening while buyers are beginning to regain control. With consistent volume confirming accumulation at lower levels, the setup hints at a potential bullish breakout soon. The projected move could lead to an impressive gain of around 190% to 200% once the price breaks above the wedge resistance.
This bullish continuation pattern is typically seen at the end of downtrends or corrective phases, and it represents a potential shift in market sentiment from bearish to bullish. Traders closely watching DUSKUSDT are noting the strengthening momentum as it nears a breakout zone. The good trading volume adds confidence to this pattern, showing that market participants are positioning early in anticipation of a reversal.
Investors’ growing interest in DUSKUSDT reflects rising confidence in the project’s long-term fundamentals and current technical strength. If the breakout confirms with sustained volume, this could mark the start of a fresh bullish leg. Traders might find this a valuable setup for medium-term gains, especially as the pattern completes and buying momentum accelerates.
✅ Show your support by hitting the like button and
✅ Leaving a comment below! (What is your opinion about this Coin?)
Your feedback and engagement keep me inspired to share more insightful market analysis with you!
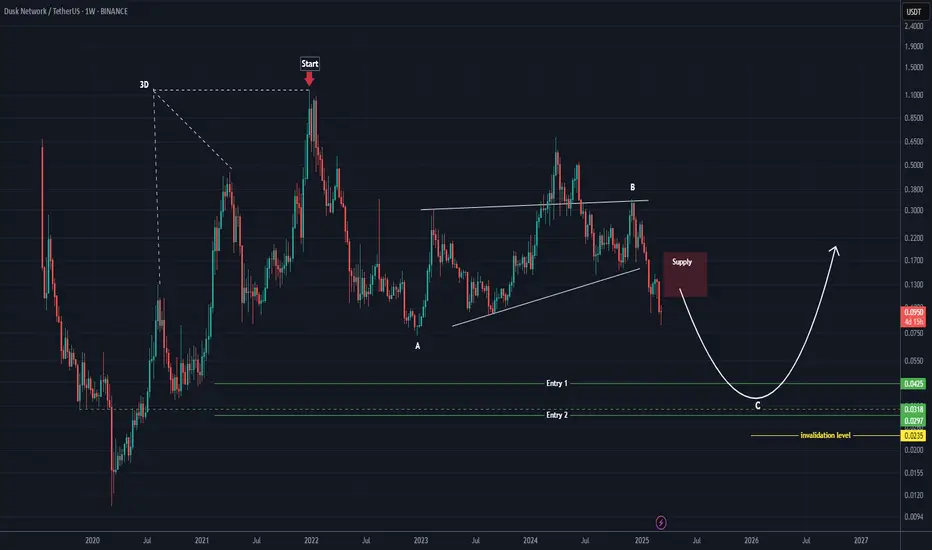
DUSK ANALYSIS (1W)It seems that after forming the 3D structure, the price has entered a corrective ABC pattern or a more complex one.
It appears that wave B has now ended, and the price has entered wave C.
Wave C has a long correction ahead in terms of time, and in terms of price, the best area for the end of wave C is the green zone.
Let’s wait and see what happens.
For risk management, please don't forget stop loss and capital management
When we reach the first target, save some profit and then change the stop to entry
Comment if you have any questions
Thank You
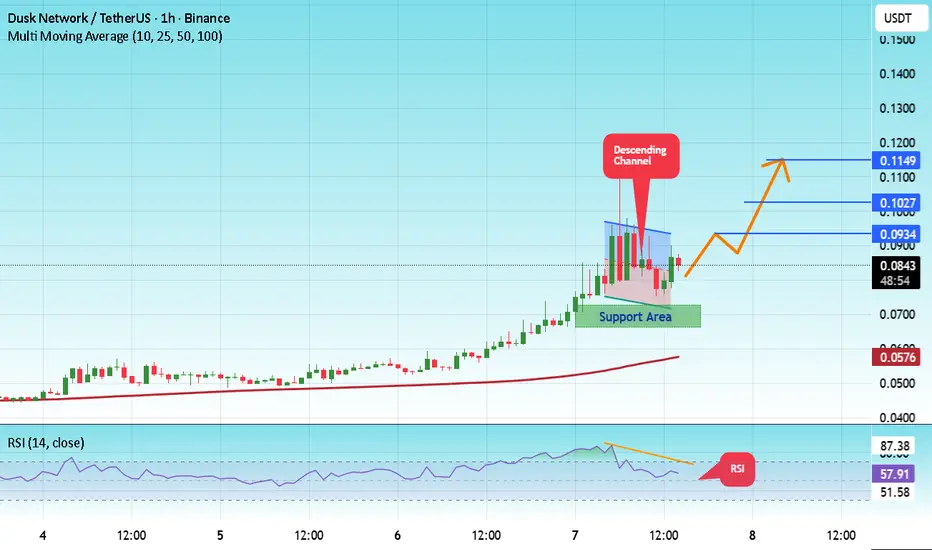
#DUSK/USDT Forming Falling Wedge#DUSK
The price is moving in a descending channel on the 1-hour timeframe and is expected to break out and continue upwards.
We have a trend to stabilize above the 100-period moving average again.
We have a downtrend on the RSI indicator, which supports an upward move if it breaks above it.
We have a key support zone in green that pushed the price higher at 0.0700.
Entry price: 0.0823
First target: 0.0934
Second target: 0.1027
Third target: 0.1150
For risk management, don't forget your stop-loss and capital management.
The stop-loss is below the support zone in green.
Upon reaching the first target, take some profits and then change your stop-loss order to an entry order.
For any questions, please comment.
Thank you.
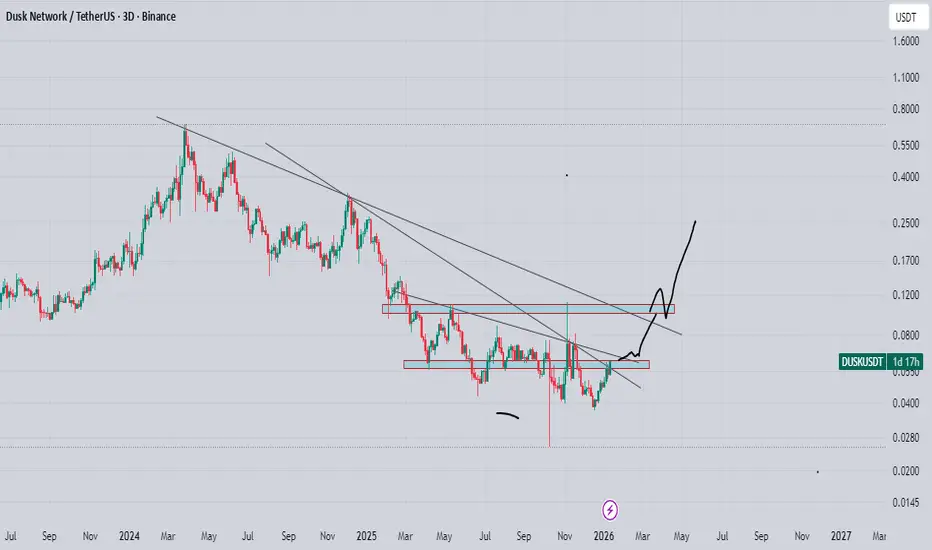
dusk can give good bullish rally overall in downtrend from long time, but now showing signs of recovery, price is not dropping as it dropped earlier, and testing descending trend line again and again, trendline getting weaker on every test, its does not mean we are bullish on dusk, still need confirmation/breakout, waiting for trend line plus horizontal resistance breakout, after successful breakout it can give more than 2x
DUSK/USDT — Decision Zone: Trendline Break or Rejection?DUSK/USDT on the 5-Day timeframe remains in a medium-to-long-term downtrend structure, characterized by a series of lower highs and lower lows since the peak around the 0.68 area. However, price is currently showing a strong reaction from a historical demand zone and is now testing the primary descending trendline, making this area a critical decision zone for the next major move.
---
Price Structure & Pattern
1. Descending Trendline (Primary Downtrend)
The descending trendline connects lower highs from 2024 to 2026
Price is currently retesting the trendline
This area acts as a major dynamic resistance
2. Demand Zone / Strong Support
Yellow zone: 0.077 – 0.064
This zone represents:
Long-term accumulation area
Multiple price reactions
Confluence with Fibonacci 0.5 – 0.618
Serves as the base structure before a potential reversal
3. Current Structure
Price is forming:
Short-term higher lows
A bullish impulse from the demand zone
This suggests an early reversal attempt, but it is not confirmed without a breakout
---
Key Technical Levels
Resistance:
0.105, 0.130, 0.166, 0.252, 0.307, 0.446, 0.570
Support:
0.077 – 0.064 (yellow zone / primary demand), 0.043, 0.025 (historical low)
---
Bullish Scenario
Bullish scenario is valid if:
Price breaks and closes strongly above the descending trendline
Followed by a successful retest around 0.076 – 0.080 as new support
Bullish Targets (Step-by-Step):
0.105
0.130
0.166
0.252
0.307
Implications:
Trendline breakout = end of distribution phase
Potential transition from bear market to recovery phase
Structure shifts from lower highs to higher highs
---
Bearish Scenario
Bearish scenario if:
Price fails to break the descending trendline
Strong rejection followed by a daily/5D close below 0.064
Downside Targets:
0.043
0.025 (historical low)
Implications:
Failure of the yellow demand zone
Downtrend continuation
Risk of entering a capitulation phase
---
Conclusion
DUSK/USDT is currently positioned at the most critical technical zone in its cycle.
The 0.077 – 0.064 area is the key level to watch.
Trendline breakout → high-probability reversal
Trendline rejection → downtrend continuation
This setup is ideal for swing and positional trading, offering an asymmetric risk–reward profile if a breakout is confirmed.
#DUSK #DUSKUSDT #AltcoinAnalysis #CryptoChart #TechnicalAnalysis #DescendingTrendline #DemandZone #TrendReversal #SwingTrading
DUSKUSDT UPDATE#DUSK
UPDATE
PUMP Technical Setup
Pattern: Falling Wedge Pattern
Current Price: 0.23$
Target Price: 0.48$
Target % Gain: 110.24%
Technical Analysis: PUMP is breaking out of a falling wedge pattern on the 1D chart, indicating bullish potential. The price has recently surged above the resistance trendline, supported by an increase in volume. The setup is validated as the price approaches the key resistance areas.
Time Frame: 1D
Risk Management Tip: Always use proper risk management.
DUSK Buy/Long Signal (4H)Considering the liquidity sweep at the bottom, followed by the formation of a large bearish candle and then its engulfment with the formation of a bullish CH, we can look for buy/long positions on the pullback to the support zones.
We have marked two entry points on the chart, which should be entered using DCA.
The targets are also marked on the chart.
Do not enter the position without capital management and stop setting
Comment if you have any questions
thank you
DUSK/USDT: Bullish Reversal & Breakout SetupHey traders!
DUSK has successfully bounced from the 0.067–0.069 USDT support zone on the 1H/4H timeframes. The price has reclaimed the local Moving Average, accompanied by strong impulse candles, suggesting a shift in momentum.
We are currently stabilizing after the breakout, looking for a retest of the support zone to confirm the uptrend.
Trade Setup:
Entry Zone: $0.0675 – $0.0690 (Retest of breakout level)
Stop Loss: $0.0625 – $0.0630 (Below market structure)
Targets (Based on Fib Extensions):
TP1: $0.0780
TP2: $0.0845
TP3: $0.0950 – $0.1000
Moonbag: $0.112+
Risk Management: Move SL to breakeven after hitting TP1. If the price loses the $0.067 support, the setup is invalidated.