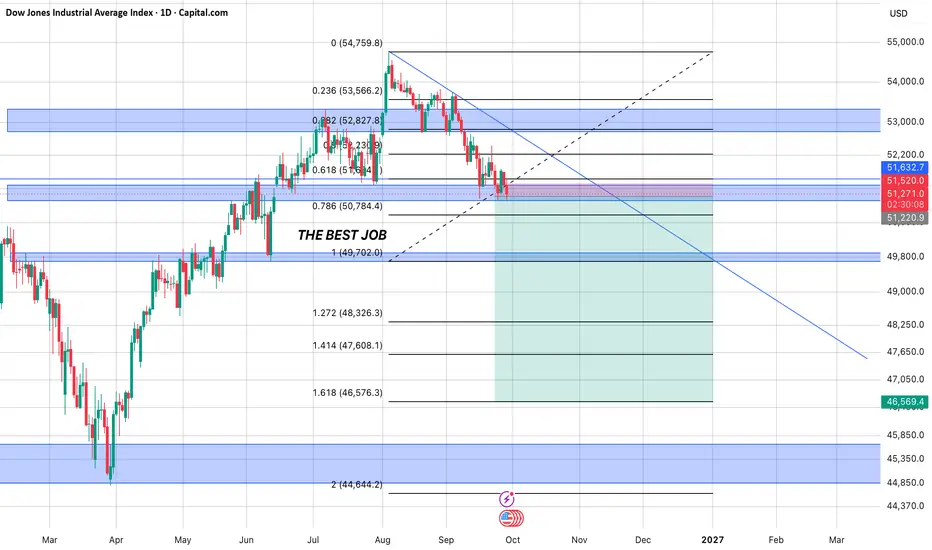
Is this finally the bottom?US30 low may be in with todays doji on daily there is a good chance for green friday tomorrow.
Daily overall looks quite interesting as there is a chance for manipulation move and sweep of the lows today.
As long as tomorrow doesnt close red next week could finally be the end of overnight pump and N
US30 My Opinion! SELL!
My dear subscribers,
US30 looks like it will make a good move, and here are the details:
The market is trading on 51828 pivot level.
Bias - Bearish
My Stop Loss - 51924
Technical Indicators: Both Super Trend & Pivot HL indicate a highly probable Bearish continuation.
Target - 51670
About Use
US30 Will Go Up From Support! Buy!
Take a look at our analysis for US30.
Time Frame: 9h
Current Trend: Bullish
Sentiment: Oversold (based on 7-period RSI)
Forecast: Bullish
The market is approaching a significant support area 51,212.9.
The underlined horizontal cluster clearly indicates a highly probable bullish movement with ta
DOW JONES 2-month Channel Down targets the 1D MA200.Dow Jones (DJIA) has been trading within a Channel Down since August 04 and is currently under successive rejections on its 4H MA50 (blue trend-line). Those are on the middle of the pattern (0.5 Fibonacci level), with the 4H MA100 (green trend-line) just coming off the Channel's Sell Zone.
As long
Bullish divergence is actively forming at US30 A textbook bullish divergence is actively forming on US30 (Dow Jones Industrial Average) 4-hour chart.
While the price action is making a lower low (sloping downward along the white trendline), the RSI indicator is creating a clear higher low (sloping upward near the oversold 20-30 territory). This
DOW JONES: Strongest correction since March. 48600 minimum TP.Dow Jones is bearish on its 1D technical outlook (RSI = 39.212, MACD = -353.020, ADX = 36.742) and has largely confirmed the bearish bias after the 4H Death Cross formation 3 weeks ago. The pattern is identical to February-March 2026 and very soon should test the 1W MA75 (TP = 48,600), which remains
DOW JONES INDEX (US30): Important Breakout
As I predicted yesterday, US30 broke through an important daily support cluster.
We see a confirmed breakout with a daily candle close below.
It opens up the potential for a further decline.
The next strong support is 50200.
โค๏ธPlease, support my work with like, thank you!โค๏ธ
I am part of Trad
See all ideasย
Displays a symbol's value movements over previous years to identify recurring trends.
Frequently asked questions
๏ปฟDow Jones Cash Index / US Dollar reached its highest quote on Aug 5, 2026 โ 54,743ย USD. See more data on the Dow Jones Cash Index / US Dollar chart.
The lowest ever quote of Dow Jones Cash Index / US Dollar is 31,417ย USD. It was reached on Mar 15, 2023. See more data on the Dow Jones Cash Index / US Dollar chart.
Dow Jones Cash Index / US Dollar is just a number that lets you track performance of the instruments comprising the index, so you can't invest in it directly. But you can buy Dow Jones Cash Index / US Dollar futures or funds or invest in its components.