In-depth trading ideas
Is this finally the bottom?US30 low may be in with todays doji on daily there is a good chance for green friday tomorrow.
Daily overall looks quite interesting as there is a chance for manipulation move and sweep of the lows today.
As long as tomorrow doesnt close red next week could finally be the end of overnight pump and NY dump.
Lets see
US30 My Opinion! SELL!
My dear subscribers,
US30 looks like it will make a good move, and here are the details:
The market is trading on 51828 pivot level.
Bias - Bearish
My Stop Loss - 51924
Technical Indicators: Both Super Trend & Pivot HL indicate a highly probable Bearish continuation.
Target - 51670
About Used Indicators:
The average true range (ATR) plays an important role in 'Supertrend' as the indicator uses ATR to calculate its value. The ATR indicator signals the degree of price volatility.
Disclosu
US30 Will Go Up From Support! Buy!
Take a look at our analysis for US30.
Time Frame: 9h
Current Trend: Bullish
Sentiment: Oversold (based on 7-period RSI)
Forecast: Bullish
The market is approaching a significant support area 51,212.9.
The underlined horizontal cluster clearly indicates a highly probable bullish movement with target 51,866.2 level.
P.S
The term oversold refers to a condition where an asset has traded lower in price and has the potential for a price bounce.
Overbought refers to market scenarios where the in
DOW JONES 2-month Channel Down targets the 1D MA200.Dow Jones (DJIA) has been trading within a Channel Down since August 04 and is currently under successive rejections on its 4H MA50 (blue trend-line). Those are on the middle of the pattern (0.5 Fibonacci level), with the 4H MA100 (green trend-line) just coming off the Channel's Sell Zone.
As long as this continues, it is more likely to see the current Bearish Leg completing a new -3.50% total decline (like the previous two Bearish Legs), targeting 50550. That would be directly above the 1D MA2
Bullish divergence is actively forming at US30 A textbook bullish divergence is actively forming on US30 (Dow Jones Industrial Average) 4-hour chart.
While the price action is making a lower low (sloping downward along the white trendline), the RSI indicator is creating a clear higher low (sloping upward near the oversold 20-30 territory). This indicates that the downward selling momentum is exhausting, increasing the probability of an upward trend reversal toward your targets.
📊 Trade Setup & Target Levels
Based on your chart layout, the st
DOW JONES: Strongest correction since March. 48600 minimum TP.Dow Jones is bearish on its 1D technical outlook (RSI = 39.212, MACD = -353.020, ADX = 36.742) and has largely confirmed the bearish bias after the 4H Death Cross formation 3 weeks ago. The pattern is identical to February-March 2026 and very soon should test the 1W MA75 (TP = 48,600), which remains our medium term target.
See how our prior idea has worked out:
## If you like our free content follow our profile to get more daily ideas. ##
## Comments and likes are greatly appreciated. ##
DOW JONES INDEX (US30): Important Breakout
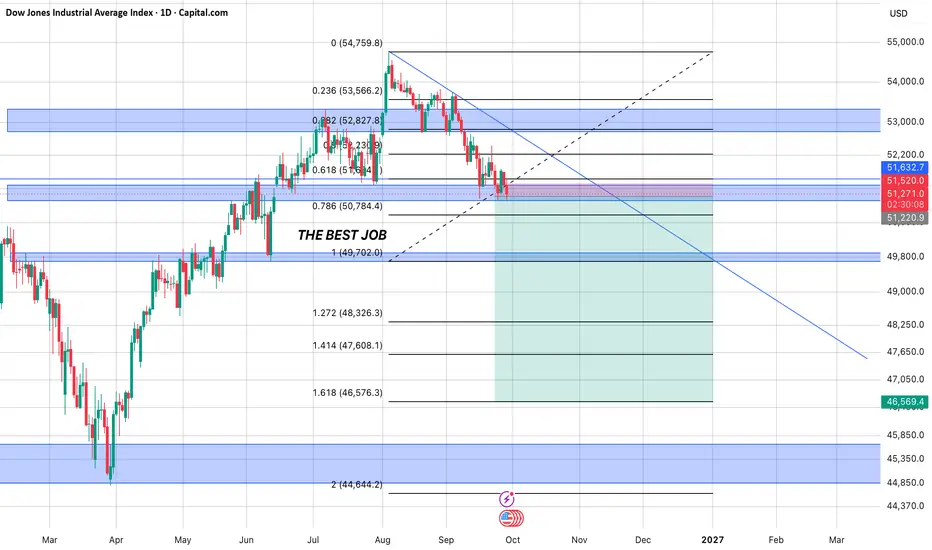
As I predicted yesterday, US30 broke through an important daily support cluster.
We see a confirmed breakout with a daily candle close below.
It opens up the potential for a further decline.
The next strong support is 50200.
❤️Please, support my work with like, thank you!❤️
I am part of Trade Nation's Influencer program and receive a monthly fee for using their TradingView charts in my analysis.
US30 | Bearish Below 51,600 — 51,080 in FocusUS30 | Bearish Below 51,600 — 51,080 in Focus
US30 remains under bearish pressure after stabilizing below the 51,600 pivot.
While the index trades below this level, the next downside target remains 51,080
A confirmed break below 51,080 would extend the bearish move toward 50,470
On the bullish side, stability back above 51,600 would weaken the bearish structure and support a recovery toward 52,040 → 52,400
Geopolitical tensions remain a major source of volatility, while today’s PCE and GDP
Dow Jones: Potential Recovery Takes Shape on the 4H ChartThe Dow Jones is rebounding after a prolonged decline, with the highlighted projection outlining a potential bullish recovery. The anticipated path suggests an initial push higher, followed by a pullback and a further advance towards 52,400.
A higher low during the pullback would strengthen this scenario, while a move below the recent low would weaken it. For now, the projected rise remains a potential recovery within the broader downtrend.
Disclosure: We are part of Trade Nation's Influencer
US30 H4 | Downtrend Likely to ExtendThe price could rise to our sell entry level at 52,017.58, which is a pullback resistance.
Our stop loss is set at 52,520.45, which is a pullback resistance level.
Our take profit is set at 51,195.31, which is a pullback support level.
High Risk Investment Warning
65% of retail investor accounts lose money when trading CFDs with this provider. You should consider whether you understand how CFDs work and whether you can afford to take the high risk of losing your money.
The path ahead for the Dow Jones Index! How far can it fall?
In the upward movement we had, the valid upward trend line was broken after 4 collisions and we are witnessing a downward movement. To examine the corrective movement, 3 descending channels were drawn to witness the price collision with the support levels ahead.
Do you think the Dow Jones will go up? Or do we have more declines ahead?
Dow Jones (US30) Buyers Defending SupportUS30 is testing the 51,500 support area after a bearish move on the 1H chart.
Price has bounced from this zone before, and I'm watching to see if buyers defend it again.
The plan is a short-term buy, but I want to see a bullish CHoCH/BOS and a break above the recent lower high before looking for continuation toward 52,289.
US30 H4 | Potential Bullish ReversalThe price has bounced off our buy entry level at 51,211.45, which is a pullback support.
Our stop loss is set at 50,521.62, which is a pullback support level.
Our take profit is set at 52,043.99, which is a pullback resistance.
High Risk Investment Warning
65% of retail investor accounts lose money when trading CFDs with this provider. You should consider whether you understand how CFDs work and whether you can afford to take the high risk of losing your money.
Dow Jones: Is this the turning point?Dow Jones chart shows a big rally at end of July, and a subsequent deflation of that move in the ensuing weeks. Now, we have broken the low that started that last up move at around 51500. So far, there hasn't been much in the way of proper downside follow through in the last few bearish attempts to move decisively below this level. But with the bond markets imploding, the risks of a correction for equity markets are rising. If there is now real acceptance below that level, then we could see some
MarketBreakdown | NZDCHF, US30, BITCOIN, DOLLAR INDEX
Here are the updates & outlook for multiple instruments in my watch list.
1️⃣ #NZDCHF daily time frame 🇳🇿🇨🇭
The price violated a resistance line of a huge falling wedge pattern.
It opens up a potential for a bullish continuation.
2️⃣ #US30 Dow Jones Index daily time frame 🇺🇸
I see a bearish accumulation on a major daily support cluster.
We may see another test of that and its breakout attempt.
A daily candle close below it will confirm a bearish continuation.
3️⃣ #BITCOIN #BTCUSD d
Bearish move extends lower?Dow Jones (US30) is rising towards the pivot, which has been identified as a pullback resistance and could reverse towards the 1st support.
Pivot: 51,228.80
1st Support: 50,385.10
1st Resistance: 51,843.30
Disclaimer:
The opinions given above constitute general market commentary and do not constitute the opinion or advice of IC Markets or any form of personal or investment advice.
Any opinions, news, research, analyses, prices, other information, or links to third-party sites contained on t
Descending Channel Liquidity Sweep & Reclaim Setup US30 1H: (Long Plan)
1. Market Context
On the 1H chart, US30 (Dow Jones) has been respecting a steep red descending channel from the 53,728.2 peak down to the 50,570 region. After breaking below the key horizontal support at 51,215.0 ("Buyer Out") and sweeping bottom liquidity, price is mounting a recovery to reclaim 51,215.0 and break out of the channel structure.
2. Sentiment & House Trap Analysis
• Where Traders Place Orders: Retail shorters, emboldened by the breakdown below 51,215.0 ("