Ethereum Classic (ETC) 4-Profits, Classic Signals (MACD & RSI) Let's look at ETCUSDT (Ethereum Classic) while focusing on the basics. Every now and then we go back to the basics just to make sure we are giving the right interpretation to the chart.
Is everything truly bullish? Let's us see together.
ETCUSDT Weekly MACD:
The MACD hit bottom in 2022, 2026 produced a long-term higher low and this is also a bullish divergence with ETCUSDT.
The MACD can be seen rising since March 2026, now moving straight up with plenty of room to continue higher. This is a long-term timeframe so this signal is specially powerful, it cannot be reversed in a matter of weeks or months, it works truly for years.
ETCUSDT Weekly RSI:
The RSI moved below the June 2022 low just to recover. The current reading is happening within the bullish zone. A downtrend has been broken. The RSI supports additional growth on the ETCUSDT trading pair.
These are the main two oscillators, both show bullish signals and growth potential.
Present on the chart is a falling wedge pattern that already broke bullish. Support was found within a consolidation range from 2020-2021 that led to a strong bull-market—the same level worked as support last month (August 2026).
The current bullish breakout is supported by rising volume. Additional growth on ETC can also be supported based on what is happening across the market, the fact that some projects are growing, not hitting new all-time highs, and are more advanced than this one shows what is coming to those that are yet to move. Projects like NEAR and BTC.
We can see how a similar setup; the end of a downtrend, the establishment of support followed by a bullish breakout, is ending with a continuation and confirmation of a new uptrend. The market is turning bullish all around, ETCUSDT is also bullish; we only need to predict additional growth.
Ethereum Classic will continue growing based on this chart.
We are aiming for targets at $27 and $94 mid- to long-term. Mid-term would be within this year, and prices can go much higher of course. Long-term can happen next year at anytime. The market can produce massive growth in just four weeks, for example. The market can produce an entire bullish cycle in six months.
There are very strong variations to consider. So far, everything points to long-term growth. A gradual rise with the usual upward-burst. An extended staircase rising high toward the sky. An elevator going hundreds of stories high. The Cryptocurrency market up 2-4 years just to start.
Namaste.
In-depth trading ideas
ETC Descending Channel, Potential Bullish Reversal?Ethereum Classic (ETC/USDT) on the 1W (Weekly) timeframe appears to be moving within a clearly defined Descending Channel.
🔴 Main Resistance Trendline — formed by the descending red trendline, which has repeatedly acted as a rejection area.
🟡 Channel Support — the yellow lower boundary forms the bottom of the channel and represents an area where price has previously received buying interest.
🟢 Internal Trendline — the green trendline represents the internal price structure and should be monitored for potential changes in momentum.
📍 Price is currently around $9.51, making this an important area to watch as ETC attempts to recover or faces renewed selling pressure.
---
🔻 PATTERN: DESCENDING CHANNEL
📐 A Descending Channel is formed when price moves between two parallel trendlines that both slope downward.
Within this structure:
🔴 Lower Highs → price peaks continue to form at progressively lower levels.
🟡 Lower Lows → price bottoms also tend to move lower.
📉 Overall, the structure indicates that bearish pressure remains dominant as long as price stays below the upper channel resistance.
However, if price repeatedly tests the upper resistance without experiencing a significant decline, attention may shift toward a potential breakout.
---
🟢 BULLISH SCENARIO — CHANNEL BREAKOUT
🚀 The bullish scenario becomes more interesting if ETC manages to break above the red descending resistance trendline and achieve a weekly close above it.
The breakout would be stronger if:
✅ A weekly candle closes above resistance.
📈 Price holds above the channel.
🔄 The previous resistance is successfully retested as support.
📊 Trading volume increases alongside the breakout.
🎯 Bullish Target Areas
If the breakout is confirmed, the following resistance levels shown on the chart may become areas of interest:
🥇 $12.80 — First resistance / initial target
🥈 $16.60 — Next resistance
🥉 $19.90 — Intermediate major resistance
👑 $24.80 — Major resistance / extended target
If bullish momentum strengthens and these resistance levels are successfully broken, ETC could potentially expand toward higher resistance areas.
⚠️ Note: These levels are technical areas shown on the chart and are not guarantees that price will reach the targets.
---
🔴 BEARISH SCENARIO — REJECTION FROM RESISTANCE
If ETC fails to break the red descending resistance trendline and experiences another rejection:
📉 Price could continue moving within the descending channel.
🔻 Price may then retest:
➡️ $9.51 — Current price area / nearby support
➡️ $7.00–$6.50 — Previous price-action support area
➡️ $6.02 — Marked low on the chart and an important support level
🚨 If $6.02 loses support significantly, bearish pressure could increase further.
---
⚔️ KEY LEVELS TO WATCH
Level Function
🟢 $9.51 Current price area / nearby support
🔴 $12.80 First important resistance
🔴 $16.60 Next resistance
🔴 $19.90 Major resistance
🔴 $24.80 Key resistance on the chart
🟡 $6.02 Important support / marked low
---
🧠 TECHNICAL CONCLUSION
📉 Structurally, ETC remains inside a Descending Channel on the weekly timeframe.
🔴 As long as price remains below the red descending resistance trendline, the bearish structure has not been fully invalidated.
🚀 On the other hand, a weekly breakout and close above the channel resistance could provide an early indication that the structure is changing and potentially open the way toward $12.80 → $16.60 → $19.90 → $24.80.
⚠️ Therefore, the two key confirmations to watch are a breakout above resistance or a rejection from resistance before determining the next directional move.
🎯 KEY LEVELS:
Bullish: Break & Weekly Close Above Descending Channel 🔥
Bearish: Rejection From Channel Resistance 📉
Major Support: $6.02 🟡
Major Resistance: $24.80 🔴
#EthereumClassic #ETC #ETCUSDT #Crypto
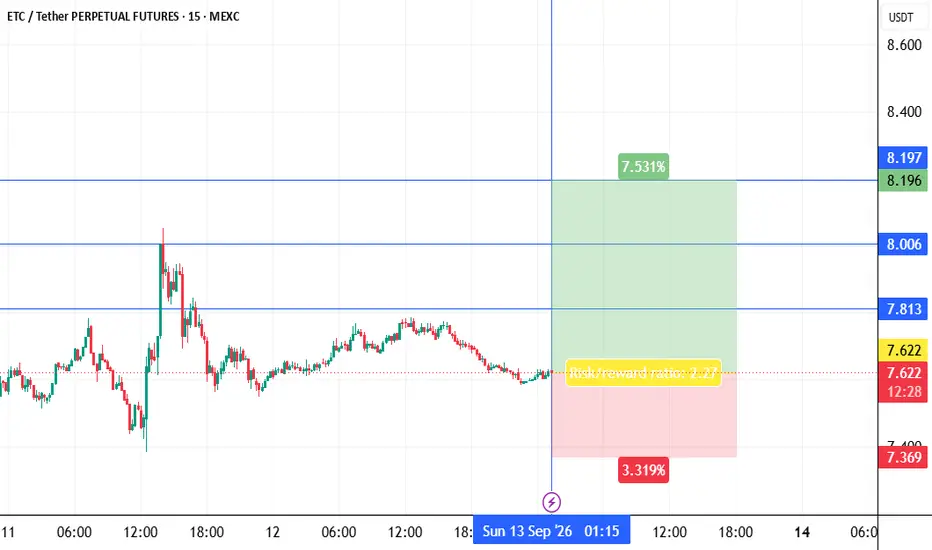
etcusdt longInstructions:
Entry point: yellow
Stop loss: red
Take profit: green
👉Leverage x 5-10-20 for crypto
👉Leverage x 20-50-100 for commodities, stocks, indices, and forex
👉Margin 1-5% max.
Always practice risk and money management.
Invest a maximum of 5% on any trade or across all your trades.
Invest only what you can afford to lose, as no one is in control of the market.
👉Our analyses are primarily based on:
breakouts: two trend lines (ascending and descending) and a line indicating a horizontal breakout.
chart patterns: shoulders and head, triangle parttern, elliott impulse, etc etc.
We don't always have the time to track them at all times or to represent them visibly, given the numerous signals, the number of channels to manage, and especially because of the often rapid pace of market movements.
indicators: We associate at least two indicators with this technique.
👉Depending on the circumstances, we use specific indicators, often setting 3 or more take profit levels.
👉Indeed, there are good days in trading and also bad days. No one can promise to win every trade, and like all traders worldwide, we also experience stop-loss orders. However, we win more than we lose and remain positive.
👉You can close the position before or after the take profit orders indicated by the green lines if you are personally satisfied; the same applies to stop loss orders.
👉We must stay positive, clear-headed, and humble.
we cannot provide all instructions or all trades here on this channel.
Good luck to us all, and may God guide us. Amen.
etcusdt shortINSTRUCTIONS TO READ AND TO FOLLOW:
Entry point: yellow
Stop loss: red
Take profit: green or blue
👉Leverage x 5-10-20 for crypto
👉Leverage x 20-50-100 for commodities, stocks, indices, and forex
👉Margin 1-5% max:
This limits your maximum loss to 5% and guarantees that you retain 95% of your portfolio in the event of a stop-loss.
🔥🔥🔥🔥🔥🔥🔥🔥🔥🔥🔥🔥🔥🔥
ALWAYS PRACTICE RISK AND MONEY MANAGEMENT:
🔥🔥🔥🔥🔥🔥🔥🔥🔥🔥🔥🔥🔥🔥
👉Invest a maximum of 5% on any trade or across all your trades.
Invest only what you can afford to lose, as no one is in control of the market.
👉I repeat: this limits your maximum loss to 5% and guarantees—or rather, allows you to retain—95% of your portfolio in the event of a stop-loss.
👉I’m sending out several signals so you can pick the ones that look convincing to you—not all of them. Taking fewer positions certainly means lower gains, but it also means fewer losses. If you follow the instructions, we’ll either win together or crash and burn together. But rest assured, we win a lot more than we lose.
🎖️🎖️🎖️🎖️🎖️🎖️🎖️🎖️🎖️🎖️🎖️🎖️🎖️🎖️🎖️🎖️🎖️
LEARNING REMAINS THE BEST SOLUTION
🎖️🎖️🎖️🎖️🎖️🎖️🎖️🎖️🎖️🎖️🎖️🎖️🎖️🎖️🎖️🎖️
👉Learning from professionals remains the best solution: it enables you to understand signals, question them, and form your own opinion, as well as plan ahead should the signal provider be absent or inactive. In short, learning to trade grants you freedom and autonomy, making you responsible for both your gains and your losses.
👉Our analyses are primarily based on:
breakouts: two trend lines (ascending and descending) and a line indicating a horizontal breakout.
chart patterns: shoulders and head, triangle parttern, elliott impulse, etc etc.
We don't always have the time to track them at all times or to represent them visibly, given the numerous signals, the number of channels to manage, and especially because of the often rapid pace of market movements.
indicators: We associate at least two indicators with this technique.
👉considering the potential market risks and the likely short-term and long-term profits, we use specific indicators, often setting 3 or more take profit levels
👉depending on your psychological state, your beliefs, your goals or intuitions, you can close the position before or after the take profit orders indicated by the green lines if you are personally satisfied; the same applies to stop loss orders
👉Indeed, there are good days in trading and also bad days. No one can promise to win every trade, and like all traders worldwide, we also experience stop-loss orders. However, we win more than we lose and remain positive.
👉We must stay positive, clear-headed, and humble.
We need to proceed step by step—without rushing, without being overly timid, and without being too greedy either.We need to pull ourselves together and regain our confidence after hitting a stop-loss.
We must stay courageous and, above all, prudent regarding market reversals that no one can control
👉we cannot provide all instructions or all trades here on this channel.
such as:
⚡Move your stoploss
⚡Put B.E (break even)
⚡Add an additional take-profit
⚡Add a trailing stop
⚡re-entering the trade at the same entry point or lower.
⚡recovery signals provided in the event of—or following—a stop-loss (SL) hit.
⚡personalized discussions, instructions, and answers.
⚡revealing our high-performance indicators and teaching you how to configure and use them.
Good luck to us all, and may God guide us. Amen.
ETCUSDT Long Idea _ 15 Min TFETCUSDT Long Idea
Price broke bearish structure and shifted bullish (MSS) after likely sweeping the recent low for liquidity. Looking to buy on a pullback into the zone that caused the shift, targeting the buy-side liquidity resting above recent highs.
Bias: Bullish after structure shift
Entry: Retracement into order block/FVG from the breakout move
Stop: Below the low that caused the shift
Target: Buy-side liquidity above recent swing highs
Quick note, not financial advice: confirm with volume/timeframe before sizing up — liquidity setups can fake out.
ETC - Trendline Broken — Pullback Before the Next Major Rally?📊 Ethereum Classic (ETC/USDT) — 2D Timeframe
ETC is showing an interesting technical development after successfully breaking above the descending trendline that had been limiting price movement for several months.
This breakout suggests that bearish pressure is beginning to weaken and opens the possibility of a new bullish structure developing.
However, after a strong breakout, the price may first perform a pullback/retest before continuing higher.
---
📐 TECHNICAL STRUCTURE
🔻 Previously, ETC was trading within a long-term downtrend, characterized by lower highs and lower lows.
📉 The descending trendline acted as dynamic resistance and repeatedly pushed price lower.
🚀 The trendline has now been broken to the upside, indicating a potential shift in momentum.
🔄 After a breakout, a pullback is normal as the market may retest previous support before determining its next direction.
The structure to watch is therefore:
📉 Downtrend → 🚀 Breakout → 🔄 Pullback/Retest → 🟢 Bullish Continuation
---
🟨 KEY ZONE — $6.70–$7.20
The $6.70–$7.20 area is the most important zone in this setup.
This area previously acted as a consolidation and support zone. Following the breakout, it could potentially become a retest/support zone if price undergoes a correction.
🎯 The ideal scenario:
ETC pulls back → enters $6.70–$7.20 → buyers defend the zone → Higher Low forms → price resumes its upward movement.
🟢 As long as this zone holds, the pullback can be viewed as a healthy correction following the breakout, rather than a bearish reversal.
---
🟢 BULLISH SCENARIO
If ETC pulls back toward $6.70–$7.20 and receives a strong buyer reaction:
🟢 Support holds
🟢 Selling pressure weakens
🟢 A Higher Low forms
🟢 Price breaks through the nearest resistance
Then the probability of bullish continuation increases.
🎯 $8.03 → First major resistance to reclaim
🚀 $9.20 → Next resistance
🚀 $9.95 → Major resistance
🔥 $11.50 → Major recovery target
🔥 $13.30 → Major resistance / higher target
If bullish momentum strengthens significantly, the $11.50–$13.30 area could become an important testing zone for ETC.
---
🔴 BEARISH SCENARIO
Although the breakout provides a positive signal, a false breakout remains a risk.
⚠️ The bullish scenario would weaken if ETC:
🔴 Fails to maintain post-breakout momentum
🔴 Moves back below and remains under the descending trendline
🔴 Breaks strongly below $6.70
🔴 Loses the entire $6.70–$7.20 demand zone
If these conditions occur, the previous breakout could develop into a bull trap / false breakout.
📉 The next major support to watch is:
$6.02 — Previous Low
A loss of $6.02 would suggest that the long-term bearish structure is regaining control.
---
🧠 MARKET INTERPRETATION
The most important aspect of this chart is not simply the trendline breakout, but how price reacts after the breakout.
📌 Breakout = Initial momentum shift
📌 Pullback = Test of buyer strength
📌 $6.70–$7.20 = Bullish validation zone
📌 Higher Low = Additional confirmation
📌 Breakout above $8.03 = Stronger bullish momentum
Therefore, a correction toward the yellow zone should not automatically be interpreted as bearish.
If buyers successfully defend $6.70–$7.20, the correction could become part of a retest before bullish continuation.
---
🎯 KEY LEVELS TO WATCH
🟨 $6.70–$7.20 — Key Demand / Retest Zone
🔵 $6.02 — Critical Support / Previous Low
🔴 $8.03 — First Major Resistance
🟡 $9.20 — Resistance
🟡 $9.95 — Major Resistance
🚀 $11.50 — Major Bullish Target
🚀 $13.30 — Major Resistance / Higher Target
---
🔥 CONCLUSION
ETC is showing potential structural change from bearish to bullish after successfully breaking above the descending trendline.
However, the breakout alone is not enough to fully confirm bullish continuation.
👀 The key area to watch is $6.70–$7.20.
If the price follows:
🚀 Breakout → 🔄 Pullback → 🟨 Hold $6.70–$7.20 → 📈 Higher Low → 🚀 Continuation
then the bullish structure becomes increasingly stronger, with potential upside toward $8.03 → $9.20 → $9.95 → $11.50 → $13.30.
Conversely, losing $6.70 would be a warning that the breakout needs to be questioned, while a breakdown below $6.02 could invalidate the bullish thesis for this setup.
⚠️ This is a technical analysis based on chart structure, not a guarantee of future price movement. Always use proper risk management and conduct your own research.
#ETC #EthereumClassic #ETCUSDT #Crypto #CryptoAnalysis #TechnicalAnalysis #Altcoins #CryptoTrading #PriceAction #Breakout #BullishContinuation
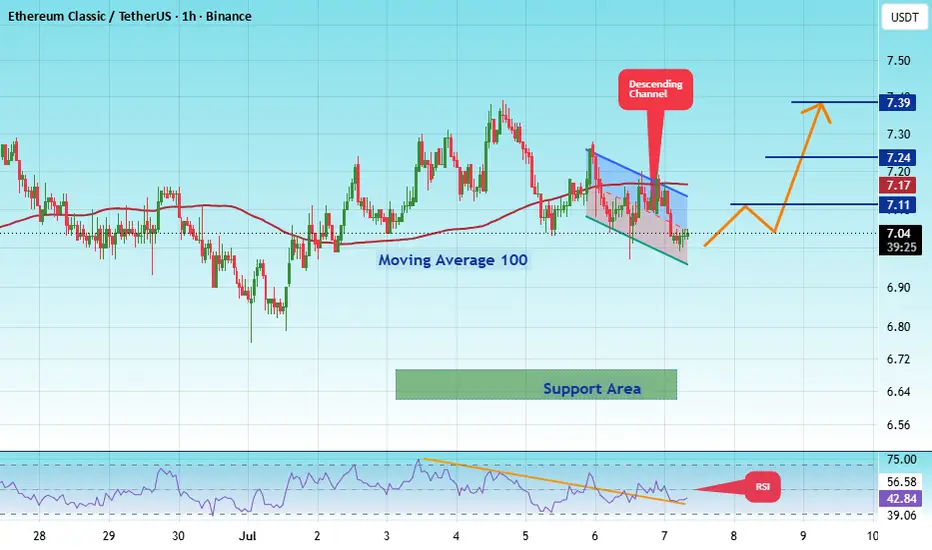
#ETCUSDT#ETC
The price is moving within a descending channel on the 1-hour timeframe and has reached the lower boundary. It is now poised for a bounce and is expected to retest this boundary.
The Relative Strength Index (RSI) indicates a downward trend, which is likely to continue given the overbought conditions.
There is a key support zone (in green) at 6.62, and the price has bounced off this zone several times, making it a strong support level.
The price is trending towards the 100-period moving average, which we are approaching. This trend supports an upward move.
Entry Price: 7.04
Target 1: 7.11
Target 2: 7.24
Target 3: 7.39
Stop Loss: At the resistance zone (in green)
Remember this simple rule: Money Management.
Any questions? Please leave a comment.
Thank you.
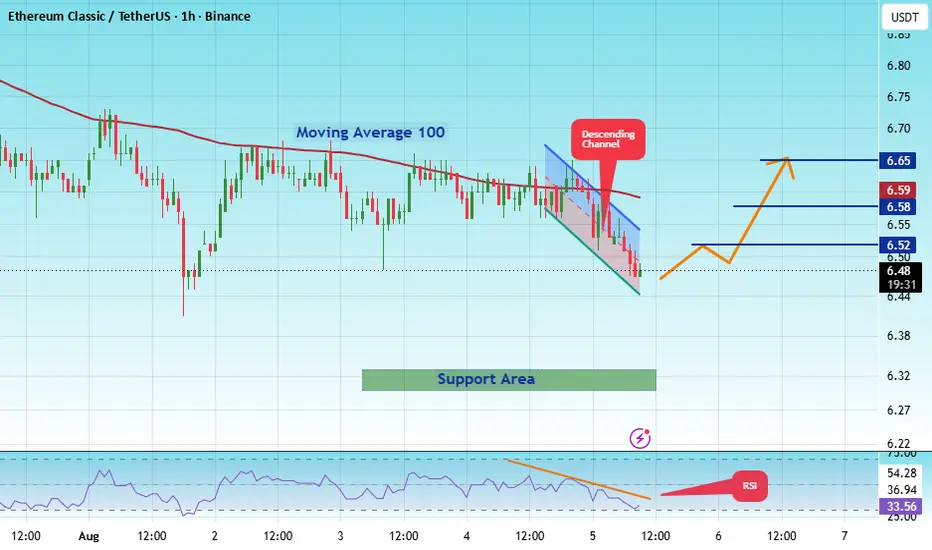
#ETCUSDT The price is moving within an ascending channel#ETC
The price is moving within a descending channel on the 1-hour timeframe and has reached the lower boundary. It is now poised for a bounce and is expected to retest this boundary.
The Relative Strength Index (RSI) indicates a downward trend, which is likely to continue given the overbought conditions.
There is a key support zone in green at 6.30, and the price has bounced off this zone several times, making it a strong support level.
The price is trending towards the 100-period moving average, which we are approaching. This trend supports an upward move.
Entry Price: 6.40
First Target: 6.52
Second Target: 6.58
Third Target: 6.65
Stop Loss: At the resistance zone in green
Remember this simple rule: Money Management.
Any questions? Please leave a comment.
Thank you.
ETCUSDTFrom history, the second half of the year has a lot of activity creating volatility across major asset classes.A weaker dollar due to bond buy backs by the fed has propped the crypto markets. Shift in market structure has created medium term buy opportunities.
ETCUSDT Buy limit 6.345
TP-14.7
Disclaimer; this does not constitute financial advise, it is our view and bias of the market.
ETCUSDT – Bearish Continuation Below 6.52, Eyes on 4.48ETC remains locked in a clean, uninterrupted downtrend with no sign of recovery, and price is now pressing into the next breakdown level at 6.52.
Why This Level Matters:
Each leg lower has followed the same rhythm: a sharp drop, then a sideways range, then another break to a fresh local low. 6.52 is the current range floor holding price up. A confirmed break opens the door to the next lower low.
Gameplan / Primary Scenario:
Wait for a clean break and close below 6.52, then sell the continuation lower toward the 4.48 region. No good news in the broader market and a structurally weak trend both back the downside. Until 6.52 breaks, stay patient and let the level do the work.
If this added value, boost it forward. What are your thoughts?
Swallow Academy
ETCUSDT.P: short setup from support at 6.501SETUP CONTEXT:
BINANCE:ETCUSDT.P has been in consolidation for a very long time and has accumulated enough energy for a strong move. I have several factors pointing to a short, so I am looking at a short scenario. Although, as you know, the market can do exactly the opposite of what you expect.
Why am I actively watching this asset right now? We tapped a very old, strong level pixel-perfect, after which the asset went into consolidation above it and is slowly approaching it again—meaning it's going for a close retest. Yesterday's daily close near the low of the bar and right at the level clearly indicates buyer weakness.
LEVEL PROFILE:
Price: 6.501
Timeframe: D1
Level validations:
round number
exact price taps (pixel-perfect)
false break
impulse halt at the level WHAT I WANT TO SEE:
trend alignment
clear path beyond level
prolonged base (consolidation)
volatility contraction on approach
no pullback after strong momentum
close retest
at-level close Do you see this setup differently? Let me know your thoughts in the comments.
If this logic aligns with your trading plan, support the idea with a boost! Disclaimer: This publication is part of my public trading journal. The material is strictly for educational purposes, reflects my market perspective, and is not financial advice. Trading facts, not expectations.
ETC — Daily Coil / 1H Reclaim Setup⚛️ ETC is one of the more interesting compression structures on my radar right now.
After the sharp June selloff, price has spent the last several weeks building a symmetrical daily coil: lower highs pressing down into rising support, volume contracting, and price gradually being squeezed toward the apex. That is exactly the type of structure I want to see before a larger expansion.
The important part is that ETC is no longer just sitting at the bottom of the coil. On the 1H, it swept the lows near 6.85, reclaimed the faster EMAs, and is now pushing back through the high-volume area around 7.00–7.05.
HTF Context 🔭
Daily structure is still beneath the declining 50 EMA and larger trend resistance, so this is not a “buy and forget it” trend chart yet. But that is what makes the compression important: a confirmed break can force a move through a lot of trapped positioning.
The first major overhead test is the declining daily 50 EMA / resistance cluster around 7.32–7.35.
What I Want To See 🧱
Continued acceptance above 7.05
Continued by pressure
A tight LTF base or flag above 7.05
Expansion volume as price challenges the upper coil boundary
If ETC can break and accept above the upper daily trendline, the structure shifts from a compression watch into a legitimate squeeze/continuation setup.
Failure Scenario 🔴
This idea fails if price loses the reclaim and accepts back below 7.00, especially if it breaks back beneath the 1H EMA structure. A loss of 6.94–6.90 would put price back inside the lower portion of the coil and remove the immediate bullish thesis.
This is not about predicting which way the coil resolves. It is about recognizing that the range has tightened, the location is defined, and the risk can stay clean if price fails.
Location → Compression → Confirmation.
Not a signal. Just how I’m reading structure and participation.
ETC: local squeeze with $7.80 destinationThe Macro Picture 🗺️
ETC unwound its May $10.10 highs through a sharp descent that bottomed at $6.40 in early June. Since then, price has settled into a broad $6.40–7.80 base — a volatility playground where the lows keep getting defended and the rallies faded back toward the middle. Price now sits in the lower third of that range near $6.95, pressing against the support that has held every test this cycle, with RSI balanced around 44. Buying into a defended floor rather than chasing strength is the higher-confluence play, and the path of least resistance from here leans back toward the range top.
The Setup ⚙️
The Buy Area: The $6.40–6.60 band is where demand has repeatedly stepped in. Bulls are defending this floor, and as marked on the chart, price is holding just above it with room to rotate higher.
The Ceiling: The $7.80 decision line caps the range. A clean reclaim flips the local structure bullish and opens the path toward the $8.50 macro resistance above.
The Range Play: The zone between $6.60 and $7.80 creates a structural playground for grid-based accumulation — staggered entries across the range capture the chop while the market decides its next macro leg.
The Roadmap: Primary target sits at $7.80 — the green roadmap points there as price works up from the support toward the range top. Invalidation: a clean daily close below $6.40 would invalidate this bullish thesis and signal a structural breakdown out of the range.
More setups in profile.
#ETC #CRYPTO #EthereumClassic #Altcoins #TechnicalAnalysis
ETC USDT LONG SIGNAL#46. ETC/USDT – Trade Setup (LONG)
📈 Position Type: LONG
🕒 Timeframe: 1 H
📊 Market: Futures
💰 Entry Zone:
7,087
6.962
🛑 Stop-Loss:
6.790
🎯 Take-Profit Targets:
• TP1: 7.199
• TP2: 7.326
• TP3: 7.476
• TP4: 7.673
TP5:
TP6:
⚙️ Leverage:
5- 10
⚠️ After reaching TP1, move Stop-Loss to Entry Price.
📌 Risk Management:
Risk only 1–2% of your capital per trade.
Always confirm the setup on your chart before entry
ETC 4H – Symmetrical Triangle at Decision PointETC on the 4H timeframe is currently trading around 8.21 after ranging inside a symmetrical triangle since late May, with the two converging trendlines now pressing price into the apex as the structure approaches a resolution.
The chart shows a symmetrical triangle formed by a descending upper trendline originating from the May high near 8.40 and a rising lower trendline connecting the June 6 low near 6.43 through the June 25 low near 6.66 and the July 2 low near 6.82. Price has oscillated between both boundaries across the entire visible structure, with the upper trendline rejecting recoveries near 7.70–7.80 in mid-June and again near 7.60–7.70 in late June, while the lower trendline has caught each significant low with higher touches confirming its upward slope. Two horizontal reference levels sit inside the triangle — one near 7.20–7.25 and a second near 7.00–7.05 — both of which have acted as consistent pivots throughout the compression. The upper trendline is now declining into the 7.30–7.40 area while the lower trendline rises toward 6.90, leaving very little room remaining before a breakout is forced.
Price is currently sitting in the upper half of the triangle near 7.12, pressing toward the descending upper trendline with both lines converging rapidly into the apex.
Key Levels To Watch
→ 8.30–8.40 – May high, major resistance above
→ 7.90–8.00 – Prior consolidation zone, resistance
→ 7.60–7.70 – Prior recovery high, upper trendline rejection zone
→ 7.30–7.40 – Descending upper trendline, current overhead resistance (dynamic)
→ 7.20–7.25 – Horizontal pivot, inside triangle
→ 7.00–7.05 – Horizontal support, lower reference
→ 6.82–6.90 – Rising lower trendline, dynamic support (climbing)
→ Below 6.43 – Triangle breakdown, extended downside
A confirmed break above the descending upper trendline near 7.30–7.40 and a close above 7.60–7.70 would signal a bullish resolution out of the triangle, opening a move toward 7.90–8.00 and potentially a retest of the May high near 8.30–8.40.
A confirmed break below the rising lower trendline near 6.82–6.90 and a close beneath 7.00–7.05 would signal a bearish resolution, removing the only upward structure in place since the June low and opening downside toward 6.43 and potentially below.
Triangle apex approaching, breakout direction will define the next significant move. Break above 7.30–7.40 trendline → bullish resolution, eyes on 7.90–8.30. Break below 6.82–6.90 → bearish resolution, downside toward 6.43 and below. Bias neutral inside compression. Direction confirmed only on a decisive close outside either trendline.
#ETCUSDT The price is moving within an ascending channel#ETC
The price is moving within a descending channel on the 1-hour timeframe and has reached the lower boundary. It is now poised for a bounce and is expected to retest this boundary.
The Relative Strength Index (RSI) indicates a downward trend, which is likely to continue given the overbought conditions.
There is a key support zone (in green) at 6.57, and the price has bounced off this zone several times, making it a strong support level.
The price is trending towards the 100-period moving average, which we are approaching. This trend supports an upward move.
Entry Price: 7.03
Target 1: 7.10
Target 2: 7.25
Target 3: 7.42
Stop Loss: At the resistance zone (in green)
Remember this simple rule: Money Management.
Any questions? Please leave a comment.
Thank you.
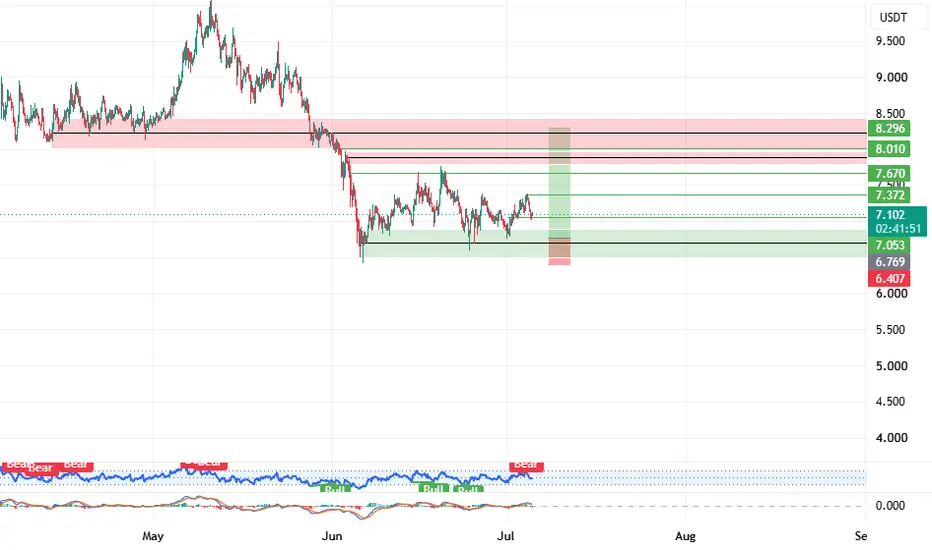
ETC USDT LONG SIGNALETC/USDT – Trade Setup (LONG)
📈 Position Type: LONG
🕒 Timeframe: 1 H
📊 Market: Futures
💰 Entry Zone:
6.772
🛑 Stop-Loss:
6.400
🎯 Take-Profit Targets:
• TP1: 7.057
• TP2: 7.370
• TP3: 7.670
• TP4: 8
TP5: 8.300
TP6:
⚙️ Leverage:
5- 10
⚠️ After reaching TP1, move Stop-Loss to Entry Price.
📌 Risk Management:
Risk only 1–2% of your capital per trade.
Always confirm the setup on your chart before entry
ETC / ETCUSDT Bullish Setup | Futures Trade IdeaMARKET ANALYSIS
ETC is currently reacting from a key technical area highlighted on the chart.
As long as the protected support zone remains intact, the bullish market structure remains valid and higher liquidity targets may continue to attract price action.
A breakdown below the invalidation level would weaken the current bullish scenario and require a reassessment of market conditions.
📍 Entry, Stop Loss and Take Profit levels are marked directly on the chart.
━━━━━━━━━━━━━━
⚠️ DISCLAIMER
This publication is provided solely for educational and market observation purposes.
Nothing contained in this analysis should be considered financial advice, investment advice, or a recommendation to buy or sell any financial instrument.
All trading and investment decisions remain solely the responsibility of the individual trader.
Always conduct your own research and apply proper risk management before entering any position.
━━━━━━━━━━━━━━
🎯 PARALOG
▪️Crypto Market Analysis
▪️BTC Futures Signals
▪️Bitcoin & Altcoin Market Analysis
Precision • Momentum • Timing
━━━━━━━━━━━━━━
Exchange: #MEXC Futures
#bitcoin #btc #crypto #futures #technicalanalysis