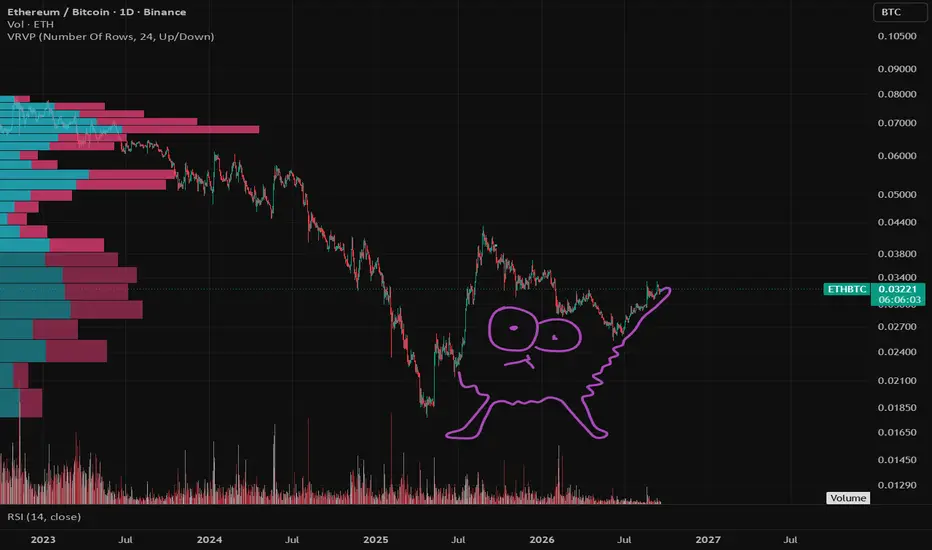
One last pump for ETHBTC before the big dump.March 2022 vibes. ETH has one last mini pump before it falls off the cliff versus BTC and it's USD pair. Short between 0.3345 and 0.34 Not financial advice.Shortby MatthaeusLupus1
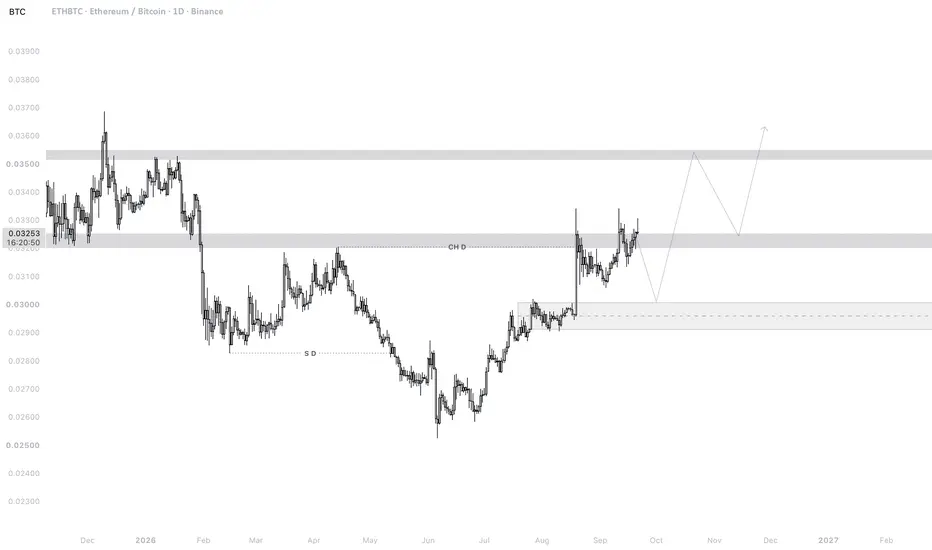
Ethereum Vs BTC RangeEasy short in this distribution zone for Ethereum Vs BTCShortby BullBeartrapUpdated 2
ETHBTC | 1DETHBTC is currently showing a significant structural recovery on the daily timeframe after a prolonged bearish phase that pushed price from the 0.035–0.036 resistance region into the major demand zone around 0.025–0.026. The market previously formed a clear sequence of lower highs and lower lows, buLongby Ikeyhan13
ETH/BTC 4H – Testing Rising Trendline at Confluence With SupportEthereum against Bitcoin is trading around 0.03188 on the 4H timeframe, pressing right into the ascending trendline that has supported this ratio since the mid August low near 0.02904, with this level now aligning almost exactly with the horizontal support zone near 0.0318 to 0.0320. The structure by BKVIP0
ETH/BTC 4H – Testing Rising Trendline After Choppy RallyEthereum against Bitcoin is trading around 0.03195 on the 4H timeframe, sitting almost exactly on the ascending trendline that has supported this ratio since the mid August low near 0.02900. The structure here has been a steady grind higher, with the ratio spiking sharply off that trendline origin by BKVIP0
ETHBTC weakness vs SOLBTCMost altcoins will just bleed forever against BTC. This has been the case with all majors, including the biggest one, ETH, that's been on a massive 9 year downtrend against BTC. Over this last cycle we saw Solana totally dominate the industry while Ethereum lagged badly. As a result, we got the nasby pokecalls0
Ethereum will outperform Bitcoin.The last 5 years have been brutal for both Ethereum and altcoins. You’d better pack your bags. Markets move in cycles, and Ethereum’s - and altcoins’ - time will come. BTC.D — too high ETH/BTC — too low PMI — >50 GOLD — too high Longby teskagod4
$ETHBTC breaking out Eth will outperform btc in coming months The chart says it all. Breaking out of trendline after long time. Patience will be rewarded.Longby CryptoVhagar21
ETH/BTC - Potential Double Top FormingSo far, ETH/BTC has double topped on the lower timeframe. On August 19, 2026, the ratio topped at 0.03342, and today, September 11, 2026, the ratio has once again topped at 0.03342. It is too early to confirm this, as today still has plenty of time left before the close, but I wanted to point this by VIAQUANT511

 ShortShortShortLongLongLong