In-depth trading ideas
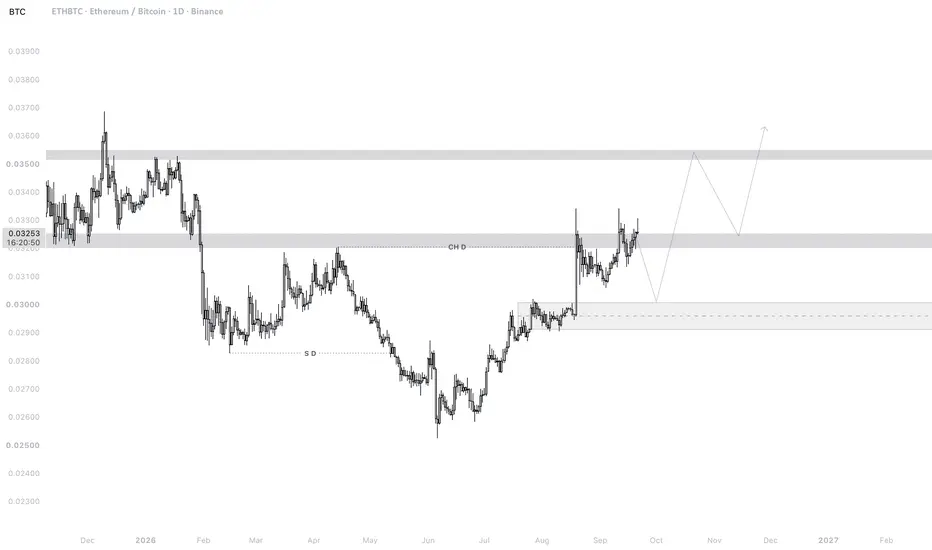
ETHBTC | 1DETHBTC is currently showing a significant structural recovery on the daily timeframe after a prolonged bearish phase that pushed price from the 0.035–0.036 resistance region into the major demand zone around 0.025–0.026.
The market previously formed a clear sequence of lower highs and lower lows, but the recent reaction from the lows has created a potential Change of Character (CHD), with ETHBTC reclaiming the 0.0315–0.0325 structural area and shifting short-term momentum back toward buyers.
The
ETH/BTC 4H – Testing Rising Trendline at Confluence With SupportEthereum against Bitcoin is trading around 0.03188 on the 4H timeframe, pressing right into the ascending trendline that has supported this ratio since the mid August low near 0.02904, with this level now aligning almost exactly with the horizontal support zone near 0.0318 to 0.0320.
The structure here shows a sharp initial spike off that trendline origin in mid August, followed by an extended choppy consolidation through most of September, with price oscillating between roughly 0.0308 and 0.03
ETH/BTC 4H – Testing Rising Trendline After Choppy RallyEthereum against Bitcoin is trading around 0.03195 on the 4H timeframe, sitting almost exactly on the ascending trendline that has supported this ratio since the mid August low near 0.02900.
The structure here has been a steady grind higher, with the ratio spiking sharply off that trendline origin in mid August before settling into a wide, choppy range between roughly 0.0310 and 0.0330 for the following weeks. Within that range, price has carved out two distinct spikes toward 0.0330, both of wh
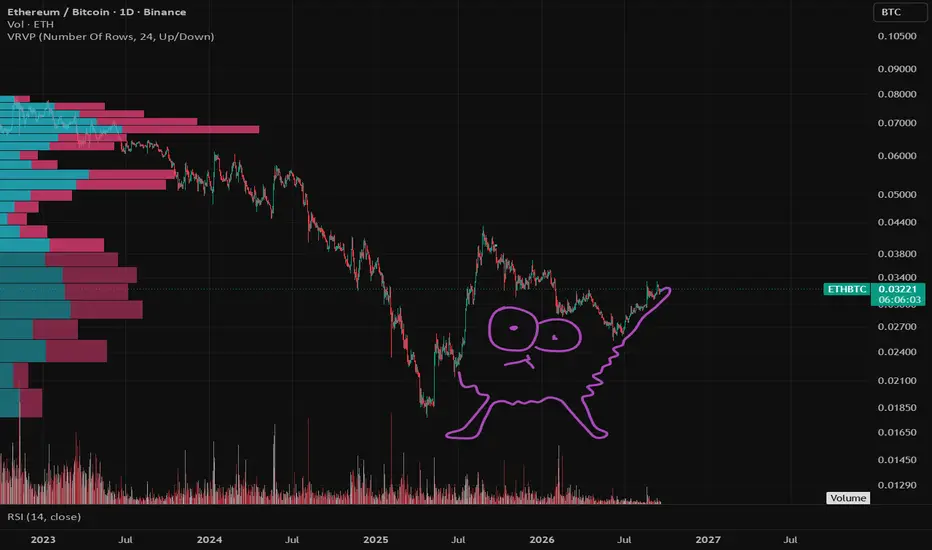
ETHBTC weakness vs SOLBTCMost altcoins will just bleed forever against BTC. This has been the case with all majors, including the biggest one, ETH, that's been on a massive 9 year downtrend against BTC.
Over this last cycle we saw Solana totally dominate the industry while Ethereum lagged badly. As a result, we got the nasty dump back to the white box in this ETHBTC pair (the support from last cycle) and the low $1400s on the USD pair.
Now it seems ETHBTC has finally broken out of the macro downtrend, - just barely -
ETH/BTC - Potential Double Top FormingSo far, ETH/BTC has double topped on the lower timeframe. On August 19, 2026, the ratio topped at 0.03342, and today, September 11, 2026, the ratio has once again topped at 0.03342.
It is too early to confirm this, as today still has plenty of time left before the close, but I wanted to point this out early. It is significant because this represents the second test of resistance at the 0.618 of the macro retracement level. For more context on that, please review my past idea here:
The 3-day t
ETH/BTC — One More Leg Down Before the Bull RunI know you've probably seen so many Bitcoin/USD charts, Ethereum/USD charts, and different ideas by now that you might be getting tired of them...
So here, I want to look at a different idea: Ethereum against Bitcoin (ETH/BTC).
In my view, before the start of Ethereum's next bull run — after all these years — there is still one more bearish leg to come.
And I believe this scenario can be clearly seen on the ETH/BTC pair. This potential move would complete the QM (Quasimodo) pattern that is clear
ETH/BTC 1D – Retesting Trendline After Outperformance SpikeEthereum against Bitcoin is trading around 0.03142 on the daily timeframe after pulling back from the recent spike to 0.03390, now sitting almost exactly on the ascending trendline that has defined this ratio since the June lows.
This is the same structure flagged in our earlier update on this pair, where ETH broke decisively above the trendline near 0.0298 and confirmed clear outperformance against BTC on a relative basis. Since that breakout, the ratio pushed through the 0.0317 to 0.0318 area
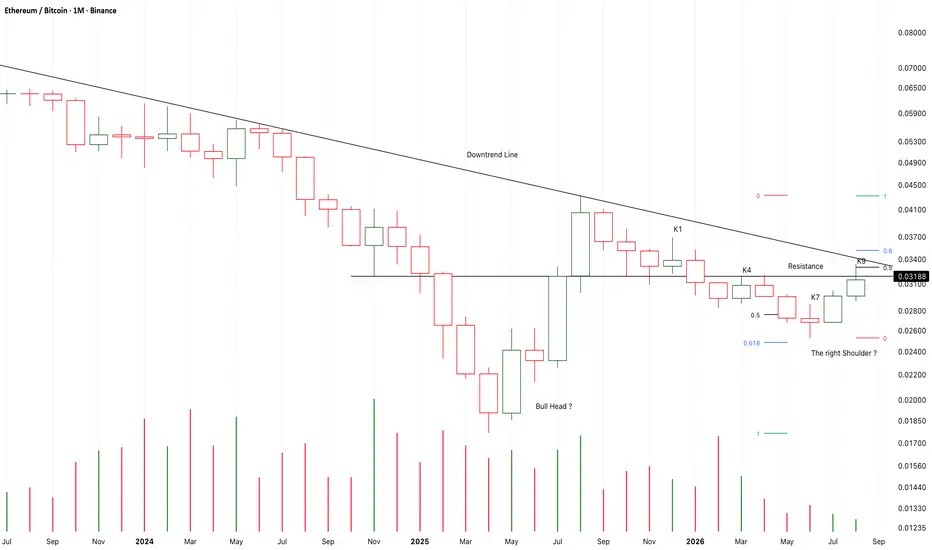
Chart Pattern Analysis Of ETH/BTC
From K1 to K4,
when the market try to climb closer to the downtrend line,
The high level supply pressure always stopped them.
If the bear force still control the market,
K7 should expand down with longer red candle body than K6 to verify it.
But actually, it is not.
K9 is a third test to the resistance or the downtrend line,
And the supply pressure keeps at lowest level,
It is not normal at the high supply pressure area of K1 and K4.
It seems that the market wants to break up the area.
If t
ETH/BTC - Decisive Breakout Confirmed ETH has shown phenomenal strength compared to Bitcoin and has decisively broken out of its downtrend. Now that this has occurred, it is important to lay out what comes next for the ratio.
First, let me say clearly that I believe ETH will dramatically outperform Bitcoin this cycle. The structure being built, both fundamentally and within the charts, gives early clues into what this next bull cycle will look like for crypto. Once ETH is able to break $5,000, it should experience an incredible bre
ETHBTC: Possible inv H&S formationETH recently rebounded from the 0.66 Fibonacci retracement level at 0.02640, potentially marking the head of an emerging inverse head-and-shoulders pattern. A rejection at the 0.03203 resistance level—the structural left shoulder—would confirm this setup and likely send price down to form the right shoulder around 0.02850.
This idea also aligns perfectly with the historical 'August fall' seasonal drawdown and the broader 4-year macro cycle, which points to a final capitulation and structural bo
(ETHBTC) Altcoins Market Bullish Reversal Setup: A New CycleThis is a pretty interesting chart. ETHBTC almost works like an index for us. It peaked August 2025. Very strong reversal signals are present on this chart, signaling the end of the correction. Actually, the long-term correction already ended based on technical analysis. When ETHBTC grows, the altcoins market grows.
June 2026 has a perfect reversal signal in the form of a Doji. This Doji produced the lowest price in years, 0.02527, followed by some sideways and later sustained bullish action.
ETH/BTC - Important Retest Taking PlaceOne other chart for ETH worth examining is ETH/BTC. It is currently poised to start gaining strength against BTC, as long as the 200 MA on the daily continues to hold.
Through December 2025 and most of January 2026, the ETH/BTC ratio held the 200 SMA as a level of demand (green arrows). However, once ETH/BTC confirmed a close below this key moving average on January 20, 2026, a massive decline followed which brought the ratio down to a significant low on June 6, 2026.
I pointed this out in a p
ETH/BTC - Predictive Target #1 Reached Here is an update to my last weekly ETH/BTC post:
Since that post, ETH has gone up 11% against Bitcoin. This is a strong development and follows closely with what I have been predicting for ETH over the past couple of weeks. For more context, go through the description linked above and review the other charts referenced within that idea.
In that last idea I stated: "First, ETH/BTC is likely to rally back toward the 3% ratio, putting the pair around 0.030 to 0.031 once it makes contact with th
ETHBTC: Wedge Break Extends, Holding Above CISDThis is the same descending wedge from the earlier ETHBTC idea, worth revisiting now that price has moved further from the reclaim.
The wedge itself hasn't changed, ten-plus months of lower highs off the September peak, compressing into the same apex near the 0.295 to 0.382 OTE zone that's marked the reaction level across this entire dataset. What's changed is the follow-through. CISD confirmed the boundary reclaim at 0.02827, and price hasn't just held above it, it's extended to 0.02922, clear
ETH/BTC - which way do we go George?ETH/BTC
Red- Resistance
Green- Support
White- Indicators/Point of Control
Stars: Targets
I think it is a good time to be stacking ETH right now as we are still in bear market territory. There has been a lot of bullish sentiment around ETH and a lot of ETH ETF activity recently; Smart money, whales, and institutions are positioning themselves for the next leg up, whenever that might occur.
Target 1: 0.04 BTC
Target 2: 0.05 BTC
Target 3: 0.06 BTC
Target 4: 0.07 BTC
Not financial advice. DYOR a