DAX Futures
No trades
No trades
In-depth trading ideas
DAX — week of August 3 – 7, 2026: LongLong — Three losing weeks ended last Monday at 25,270 and the tape has not looked back since: 25,974 by Friday, a 25,710 close, and this morning a 190-point gap to 25,900 that has not surrendered a single point — the session low is 25,895, still 185 above Friday's settle.
The cash index printed an all-time high on the way up. Now the part almost nobody reads correctly: the semiconductor complex sits better than a fifth below its high, and for this index that is not a headwind, it is the fuel. The DAX owns almost none of the AI trade — banks, insurers, chemicals, autos, industrials — so when money leaves crowded growth it does not leave the market, it changes address, and a value-heavy index is one of the few doors wide enough to take that kind of size. Which compresses the entire week into 31 points. Weekly R1 sits at 26,033; the July ceiling sits at 26,064 — the high of a week that also printed 24,958, 1,106 points of damage in five sessions. Every contract bought in that band has waited four weeks to get back to flat and gets its window right here. That is why 26,084 lasted minutes and price is back at 26,051: the ceiling is not a number, it is a queue. My bid is 26,033–25,974 — R1 folded onto last week's high — for 26,355 first, then 26,737, both inside an 864-point ATR week measured from this morning's low. Nothing German prints all week that could defend the level; the tape runs on an American clock until payrolls at 14:30 CET Friday. A daily close back under 25,895 puts price inside the gap it opened, and a gap that fills is a breakout that was never bought — at that print the long side has no argument left and I stop funding it.
THE BIG PICTURE (weekly)
Four weeks ago this market tried exactly what it is trying now, and lost. The week of July 6 printed 26,064 and then printed 24,958 — high to low, 1,106 points in five sessions, an all-time-high failure that took three losing weeks to repair. The repair is finished. Last week opened at 25,370, set its low at 25,270 in the first morning and never revisited it, ran 704 points to 25,974, and closed 25,710 — near the highs, above the weekly pivot, with the prior week's high taken out on the way. This morning added a 190-point gap to 25,900 and has defended every point of it: the low stands at 25,895. That carried price through weekly R1 at 26,033 inside the first hours of the week. What it has not done is clear 26,064. The high is 26,084 — twenty points through, handed straight back — and price sits at 26,051, inside a 31-point band between R1 and the July ceiling. That band is where four weeks of trapped inventory gets its first look at flat, which is precisely why it does not fold on first touch. The budget says the rest is reachable: 864 points of weekly ATR from this morning's 25,895 low funds 26,759, which puts R2 at 26,355 and even R3 at 26,737 inside one ordinary week — and only 189 of those points have been spent.
THE SWING (daily)
The daily tape has been making the same statement for six sessions: it will not go back. Monday 27 July bottomed at 25,270; Tuesday held 25,397; Wednesday held 25,370; Thursday held 25,379 and then closed on its high at 25,799. Three consecutive sessions defended a 27-point shelf and the fourth broke away from it — that is accumulation with a receipt, not a bounce. Friday extended to 25,974 and settled 25,710. This morning's open at 25,900 cleared Friday's high before the first hour and the low has held 25,895, which makes 25,974 — Friday's high, now underneath the market — the first floor that has to survive any pullback, and 25,895 the seam of the gap itself. The zone worth paying is 26,033–25,974, weekly R1 folded onto last week's high, not the 26,084 print that has already been rejected once today. A daily close through 26,064 retires the July shelf and leaves nothing charted above it — from there the map is pivot arithmetic and nothing else: 26,355, then 26,737.
THE WEEK'S MAP (4H)
Upside: 26,033 (weekly R1, taken in hour one) → 26,064 (the July ceiling — the high of the week that also printed 24,958) → 26,084 (today's high, already rejected once) → 26,355 (weekly R2) → 26,737 (weekly R3 — still inside the 864-point ATR budget).
Downside: 26,033 (R1, now the floor) → 26,009 (week VWAP) → 25,974 (prior-week and prior-day high — the first floor that must survive) → 25,895 (today's low, the gap seam — a daily close below kills the long) → 25,710 (Friday's close, full gap fill) → 25,651 (weekly pivot) → 25,329 (weekly S1).
One number all week: 26,064 — the July ceiling, and the only number this week actually turns on. It is not resistance because it is a high; it is resistance because the week that made it also made 24,958 — 1,106 points of damage in five sessions — so every contract bought in that band has spent four weeks getting back to flat and gets its window right here. That is why 26,084 lasted minutes and price handed it back to 26,051. Weekly R1 at 26,033 stacks directly underneath, which makes the band that decides the week 31 points wide, and it will not fold on first touch. Above a daily close at 26,064 there is nothing charted overhead at all and the map becomes pivot arithmetic: 26,355, then 26,737, both inside an 864-point ATR week from this morning's 25,895 low with only 189 points spent. The zone that pays is 26,033–25,974 — R1 folded onto last week's high — not the print. A daily close back under 25,895 puts price inside the gap it opened this morning, and a gap that fills is a breakout that was never bought.
THE CATALYSTS (CET)
Mon 3 — No Tier-1 EU release. Final German and euro-area Manufacturing PMIs 09:55/10:00 CET are revisions; US ISM Manufacturing 16:00 CET. Europe prints nothing capable of defending a record high, so the first genuine test of the gap arrives from America at 16:00, deep inside the evening session.
Tue 4 — Nothing Tier-1 in Europe. A blank Tuesday: either 26,033 holds as the floor or the gap starts handing itself back on no news whatsoever.
Wed 5 — No Tier-1 EU release, but the payroll dress rehearsal runs on the US clock: ADP employment 14:15 CET and ISM Services 16:00 CET. A hot services print lifts US long yields — the one force that can mark this index lower without a single German headline.
Thu 6 — German Factory Orders 08:00 CET + euro-area Retail Sales 11:00 CET. The week's only home-grown data and it is second tier; orders matter for the industrial half of the index but will not decide 26,064.
Fri 7 — German Industrial Production + Trade Balance 08:00 CET, then US Non-Farm Payrolls, Unemployment Rate and Average Hourly Earnings 14:30 CET. THE print of the week and the only one big enough to settle the ceiling — payrolls set the long end, and the long end decides whether a record high made in thin August liquidity gets to keep it.
BOTTOM LINE
Last week's bid was 25,436–25,370 for 25,701 and the tape paid it to the point: Wednesday's low printed 25,370, the exact lower edge, then ran 604 points to 25,974 and closed the week at 25,710, above target. That is the map working, and the map now says something harder. Three losing weeks ended at 25,270; last week added 704 points and closed near its high; this morning gapped 190 to 25,900 and has not surrendered one point of it, with the low at 25,895 and weekly R1 at 26,033 already behind the market. The cash index made an all-time high on the way. The reason is not a German story at all — the semiconductor complex sits better than a fifth below its high, and this index owns almost none of the AI trade, so money leaving crowded growth does not leave the market, it changes address, and a book full of banks, insurers, chemicals and industrials is one of the few doors wide enough to take that size. Which brings the whole week down to a 31-point band. R1 at 26,033, the July ceiling at 26,064 — the high of a week that also printed 24,958, 1,106 points of damage in five sessions — and every contract bought up there has waited four weeks for this exact window. That is why 26,084 lasted minutes and price handed it back to 26,051: the ceiling is not a number, it is a queue. The bid is 26,033–25,974, R1 folded onto last week's high, for 26,355 then 26,737, both inside an 864-point ATR week with only 189 points spent. Nothing German prints all week that could defend the level; the tape runs on an American clock until payrolls at 14:30 CET Friday, which makes the long end of the US curve the real counterparty here. A daily close back under 25,895 puts price inside the gap it opened this morning, and a gap that fills is a breakout that was never bought — at that print the long side has no argument left and I stop funding it. Buy the retest, not the record.
Not advice — trade your own plan.
DAX — week of July 27 – 31, 2026: LongLong — Last week's map wanted 24,715 and the tape refused to pay it — the break off Wednesday's 25,370 died at 24,784, 69 points short, and Friday bought the whole thing back to a green 25,172 close.
A market that won't do the easy thing is loading the hard one. This morning it gapped onto 25,370, last week's exact ceiling, held the retest 42 points above Friday's 25,228 high, and folded weekly R1 at 25,436 before lunch. Here is the mechanism behind the speed: resistance is inventory — prices where somebody owns something and defends it — and above 25,370 there is none. July 8 crossed the entire 25,000–25,660 corridor in one 703-point session on 34,226 lots, the heaviest day of the month, and in the thirteen sessions since, nothing above 25,370 has traded at all. That vacuum is why 300 points cleared on 9,000 contracts, and why Monday's high stalled at 25,599 — seven points past July 8's open at 25,592, the first price on this chart with an owner. Chasing 25,577 into that shelf pays the worst price of the move. My bid rests at 25,436–25,370, the folded R1 sitting on last week's high, for 25,701 first — weekly R2 stacked on the 25,550–25,661 supply — then 25,978 and the 26,064 ceiling, all inside an 870-point ATR week. A daily close under 25,228 fills the gap and tears the ticket up; a filled gap means the vacuum story was wrong, and I don't renegotiate with a dead thesis.
THE BIG PICTURE (weekly)
Four months of one-way tape off the March low near 22,200 ended three weeks ago at 26,064 — an all-time-high failure that bought two red weeks and had distribution written all over it. Then last week the selling quit. The low came in at 24,775, sixty points above the prior week's 24,715 — a higher low — and the week closed green at 25,172 off a Friday reversal bar that recovered 384 points from Thursday's flush. Monday gapped onto 25,370, the exact high of last week, and took weekly R1 at 25,436 in half a session. The reason it moved that fast is the hole it is moving through: on July 8 one 703-point session on 34,226 lots — the heaviest of the month — crossed everything between 25,000 and 25,660, and in thirteen sessions since, no price above 25,370 has traded. Resistance is inventory; this corridor has none. The first owned prices sit at 25,550–25,661 — July 7's floor and July 8's high — with weekly R2 at 25,701 capping the stack, and Monday's high already tested the front edge: 25,599, seven points past July 8's open. The weekly budget is 870 points of ATR; from Monday's 25,270 low that funds a run to 26,140, which puts 25,978, R3 at 26,031 and the 26,064 ceiling all inside one ordinary week — though 300 of those points are already spent.
THE SWING (daily)
The daily has drawn the line for you. Thursday flushed to 24,784 and could not hold it — Friday opened 24,830, never looked back, and closed 25,172, a full engulfing reversal off the base of the week. Monday gapped to 25,370, dipped exactly to 25,270 — 42 points above Friday's 25,228 high — and ran. That is gap-and-go grammar: the open drive held above the prior day's high, which turns 25,228 into the seam of the whole move. Above it, every dip is a bid and the vacuum does the work; a daily close below it fills the gap, drags the weekly pivot at 25,106 back into play, and files the reversal under noise. The zone that pays is 25,436–25,370 — weekly R1, folded this morning, stacked on last week's high — not the 25,577 print already pressing the first supply since the collapse. First target 25,701, R2 sitting on the July 8 origin; a daily close through it and 25,978 / 26,064 open. Paying up here, into the only shelf on the chart, is donating the pullback to someone patient.
THE WEEK'S MAP (4H)
Upside: 25,436 (weekly R1, folded day one) → 25,550 (July 7 floor) → 25,592–25,661 (July 8 open-to-high — the first owned prices since the collapse; Monday stalled at 25,599) → 25,701 (weekly R2, the cap that matters) → 25,978 (late-June swing) → 26,031 (weekly R3) → 26,064 (the failed-breakout ceiling).
Downside: 25,478 (week VWAP) → 25,436 (R1, now support) → 25,370 (PWH / Monday's open) → 25,270 (Monday's low) → 25,228 (PDH — a daily close below fills the gap and kills the trade) → 25,106 (weekly pivot) → 24,841 (weekly S1) → 24,775 (PWL).
One number all week: 25,228 — Friday's high and the seam of Monday's gap. The open drove off it, held 42 points above it at 25,270, and never came back: that single hold is what makes this a gap-and-go instead of a Monday head-fake. Above 25,228 the vacuum does the work — July 8 crossed 25,000–25,660 in one 703-point, 34,226-lot session, and nothing above 25,370 traded in the thirteen sessions since, which is why R1 at 25,436 folded in half a day and the high stalled at 25,599, seven points past July 8's open. The bid is 25,436–25,370 for 25,701, then 25,978 / 26,064 inside an 870-point ATR week. A daily close back under 25,228 fills the gap, and a filled gap tears the ticket up.
THE CATALYSTS (CET)
Mon 27 — No Tier-1 EU data. Blank calendar; the gap trades on structure alone until America wakes up midweek.
Tue 28 — No Tier-1 EU data. Second blank day while the FOMC sits down — either 25,370 holds as the floor or the gap starts handing itself back.
Wed 29 — No Tier-1 EU release, but the whip runs through the FDAX evening session: FOMC decision 20:00 CET + Powell 20:30 CET, then Microsoft & Meta earnings after the US close.
Thu 30 — German Prelim CPI m/m 08:29 CET + German Prelim GDP q/q 10:00 CET. THE EU print, the morning after Powell — Germany is a third of the HICP basket, so Friday's euro-area CPI shows its hand a day early; US GDP + Core PCE 14:30 CET and Apple & Amazon after the close keep the whip live.
Fri 31 — Euro-area Flash CPI y/y + Core y/y 11:00 CET. Confirmation, not revelation — Thursday's German print moves first; the risk is a French or Italian offset into a tape digesting four megacap reports.
BOTTOM LINE
Last week's map wanted 24,715; the tape stopped 69 points short at 24,784 and bought the week back to a green close. Wrong is wrong — and the refusal was the information. Monday opened on 25,370, last week's exact high, held 42 points above Friday's 25,228, and folded weekly R1 at 25,436 in half a session, because there is nothing up here to fold: July 8 crossed the entire 25,000–25,660 corridor in one 703-point session on 34,226 lots — the heaviest day of the month — and in thirteen sessions since, no price above 25,370 has traded. Resistance is inventory, and this corridor has none until 25,550–25,661, July 7's floor to July 8's high, where Monday's 25,599 high already knocked and got told to wait. That shelf plus weekly R2 at 25,701 is the hinge — not a round number. The trade is the pullback, not the print: bids at 25,436–25,370, targets 25,701, then 25,978 / 26,064 — one 870-point ATR week from Monday's 25,270 low covers all of it, though 300 points are already spent. The calendar stacks the whip midweek: FOMC and Powell hit the evening session Wednesday with Microsoft and Meta after the bell, German CPI opens Thursday at 08:29 with Apple and Amazon that night, and euro-area CPI closes it Friday. A daily close under 25,228 fills the gap and tears the ticket up. Trade the vacuum, not the vertigo.
Not advice — trade your own plan.
DAX — week of July 20 – 24, 2026: SHORTShort — Two weeks ago the 26,064 'breakout' was a trap I called; last week the tape fade-and-flushed to 24,715, exactly where I mapped it.
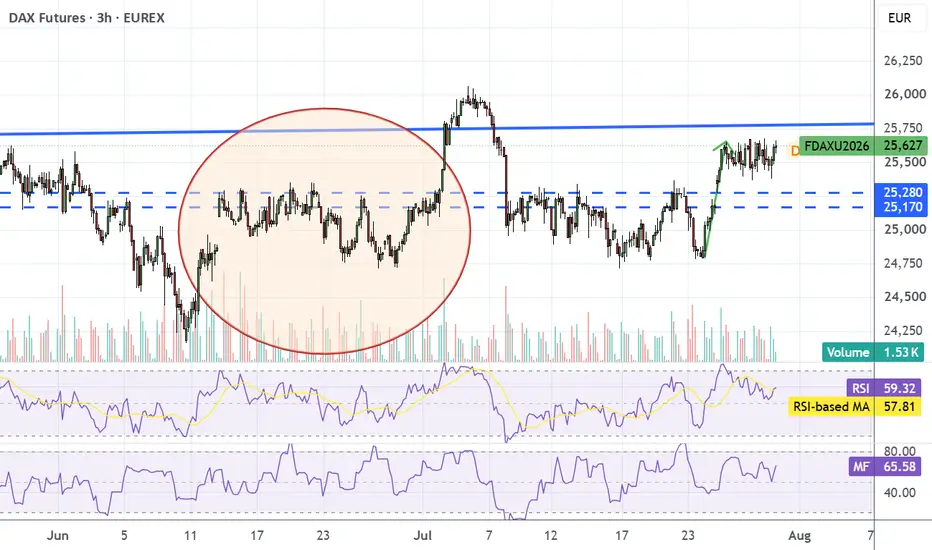
Now it's coiled on the one number that matters, and almost nobody prints it: the weekly EMA (24,996), the weekly pivot (24,997), the 4H EMA (24,999) and the week's VWAP (24,950) are stacked inside a fifty-point knot at 24,950–25,000. Price is sitting one tick above the whole cluster, bouncing a limp +0.3% off Friday's 24,715 low. That knot is the hinge — not the obvious 26,000 top, not the round 25,000 the tourists circle. Above it sits a tight ceiling: R1 at 25,279 tucked under last week's 25,343 high, a 64-point band where every bull trapped at 26,000 waits to average down. I'm a seller into 25,279–25,343 for the trip back to 24,715 and the 24,651 pivot beneath it. The weekly MACD is still green (277 vs 226), but the histogram at +51 is the fading echo of a rally two weeks dead — collapsing toward zero, not building. I flip buyer only on a weekly close back above 25,343; that negates the lower high and reopens 25,625. The whole week hinges on Thursday's ECB — the release valve on the knot. Under 25,343, I sell the rip; I do not chase the hole.
THE BIG PICTURE (weekly)
For four months the DAX ran one way — off the March low near 22,200 in a near-vertical rip to a 26,064 high two weeks ago. That high was the top of a bull trap: the very next week opened 25,995 and got sold every session, and last week finished the job — a lower high at 25,343, a fresh low at 24,715, closing 24,933, the second red weekly candle in a row. Two red weeks off an all-time-high failure isn't noise; it's the market changing hands. Now price is compressed onto a knot almost nobody watches: the weekly EMA 24,996, the weekly pivot 24,997, the 4H EMA 24,999 and the week's VWAP 24,950 all stacked inside fifty points. That is the fulcrum of the entire tape. Hold it on a weekly-close basis and the four-month uptrend survives for one more crack at 25,343 and the 25,625 pivot; lose it and the two-week pullback turns to distribution, opening 24,651, then 24,369. The weekly MACD (277 vs 226) is still nominally positive, but the histogram at +51 is the dying echo of a rally already two weeks in the grave. The week's range budget is 885 points of ATR — enough for a full round-trip of this knot in either direction, which is exactly what a live ECB Thursday is built to deliver.
THE SWING (daily)
Read the daily and stop guessing. Last week bled in a straight line — Wednesday closed 25,127, Thursday 24,977, Friday 24,933, each lower, Friday tagging the low at 24,715 before a weak bounce. That's not a base; it's a staircase down that paused at the 24,715 shelf, which held just 64 points above the 24,651 weekly S1. Today opened 24,977 and reclaimed 25,010 — back above the 24,950–25,000 knot, but that's a bounce inside a pullback, not a breakout. The line is the 25,279–25,343 band: R1 stacked under last week's high, where every seller from the 26,064 trap is parked. Fade the rally into it and target 24,715, then the 24,651 S1; lose 24,651 and 24,369 is the air pocket beneath. Only a weekly close back above 25,343 reclaims the chair for the bulls and puts 25,625 in play. Buying this bounce into resistance, one tick above a knot the whole market is leaning on, is how tourists hand sellers their exit.
THE WEEK'S MAP (4H)
Upside: 25,279 (weekly R1) → 25,343 (last week's high) → 25,625 (weekly R2) → 25,907 (weekly R3) → 25,978 / 26,064 (failed-breakout ceiling) — the supply to fade; a weekly close above 25,343 flips it bullish toward 25,625.
Downside: 24,950 (VWAP) → 24,715 (Friday low / PWL) → 24,651 (weekly S1) → 24,369 (weekly S2) → 24,023 (weekly S3, stretch) — the target ladder while 25,343 caps.
One number all week: 24,997 — the weekly pivot, buried in a four-way knot with the weekly EMA (24,996), the 4H EMA (24,999) and the week's VWAP (24,950), all inside fifty points. Price sits one tick above it after two red weeks off the 26,064 failure. Sellers own the 25,279–25,343 shelf; fade the rally into it and target 24,715, then the 24,651 S1 and 24,369 beneath. A weekly close back above 25,343 negates the lower high and hands bulls 25,625 — until then, under 25,343, sell the bounce and don't chase the hole. Thursday's ECB is the whip.
THE CATALYSTS (CET)
Mon 20 — No Tier-1 EU data. Dead-quiet open; the tape digests its own two-week failure, not the calendar.
Tue 21 — Buba President Nagel speaks 13:30 CET (low impact). The only EU noise before the ECB; light.
Wed 22 — No Tier-1 EU data. Positioning day into the decision; the knot coils tighter.
Thu 23 — ECB rate decision 14:15 CET + Lagarde press conference 14:45 CET. THE whip of the week — a dovish tilt squeezes shorts into 25,343/25,625, a hawkish hold hands sellers the 24,715 break.
Fri 24 — French Flash PMIs 09:15 CET + German Flash PMIs 09:30 CET. Growth check the morning after the ECB — a weak German print confirms the fade, a hot one caps the drop.
BOTTOM LINE
Two weeks ago I called the 26,064 breakout a trap; last week the tape fade-and-flushed to 24,715, exactly where the map said. Now the DAX is coiled on the one number that matters and almost nobody's watching — a four-way knot where the weekly EMA (24,996), the weekly pivot (24,997), the 4H EMA (24,999) and the week's VWAP (24,950) stack inside fifty points. Price is one tick above it, bouncing a limp +0.3% off Friday's low after two straight red weekly candles off an all-time-high failure. That knot is the fulcrum, not the obvious 26,000 top. Above it sits the seller's shelf: R1 at 25,279 tucked under last week's 25,343 high, a 64-point band where every bull trapped at 26,000 is waiting to average down. The play is clean — fade the rally into 25,279–25,343 and target 24,715, then the 24,651 S1 and 24,369 beneath. The weekly MACD is still green but the histogram is the dying echo of a rally two weeks in the grave. I don't flip buyer until a weekly close reclaims 25,343 and reopens 25,625. And the whole week hinges on Thursday's ECB — the release valve on the knot: dovish squeezes the shorts into the shelf, hawkish hands them the 24,715 break on a plate. Trade the level, not the nostalgia — under 25,343, sell the rip and don't chase the hole.
Not advice — trade your own plan.
DAX — July 13 – 17, 2026: Short -> The breakout was a lieand last week the tape wrote it in blood.
DAX stamped its precious 26,064, then spent five sessions getting sold into the dirt — the 25,754 shelf snapped like a twig, straight down to 24,958, closing the week down -2.9% at 25,199. That is not a pullback in a trend; it is a failed breakout, the ugliest reversal candle on the board. Price is pinned at 25,209 now — the 61.8% giveback of the whole June rip — clinging to the weekly EMA (25,047) and the daily EMA50 (24,925) but capped hard under the 4H EMA (25,252) and the 25,319 PDH. Today's stop-run to 24,892 got reclaimed — fine, that's a bounce to sell, not a bottom to buy. I fade the rallies into 25,250–25,410 for the trip back to the 24,950 shelf, and I do not turn bullish again until bulls reclaim and hold 25,410. Until then the herd that bought the 26,000 'breakout' is trapped, and I'm selling them their exit.
THE BIG PICTURE (weekly)
For a month the herd fought a ceiling at 25,353, and two weeks ago it finally broke through — ripping to 25,978, then a fresh 26,064 high, closing pinned to the top at 25,946. The bulls called it a trend. It was a trap. Last week the same tape that 'resolved higher' opened at 25,995 and got hammered every single session — 25,624 → 24,988 → 25,226 → 25,199 — slicing straight through the 25,754 breakout floor, through the weekly pivot, closing the week down -2.9% at 25,199, a stone's throw off the 24,958 low. A breakout that gets sold back below its own launch pad inside five days isn't a breakout — it's distribution, the smart money handing the top to the tourists. The weekly MACD is still nominally positive (311 vs 217), but that's the lagging echo of a rally already dead; the histogram is rolling. Price sits back at 25,209, clinging just above the weekly EMA at 25,047 and the daily EMA50 at 24,925 — the only two rails between here and an outright reversal — but capped under the 4H EMA (25,252) and rejected off every bounce. This is a wounded bull, not a fresh one: one more failed rally into 25,320 and the 24,950 shelf gives way, and the whole June leg is back on the table toward 24,750 and the 24,301 pivot. The doubters who got their face ripped off two weeks ago just got the receipt.
THE SWING (daily)
Read the daily and stop pretending. Tuesday opened 25,949, closed 25,624 — down. Wednesday sliced to 24,958 and closed 24,988 — down, and below last week's own 25,161 line. Thursday and Friday could only claw back to a limp 25,199 close, Friday tagging 25,319 and failing. That's three red sessions and a dead-cat bounce, not a base. Today swept the stops at 24,892 and reclaimed 25,183 — a liquidity grab, not a reversal. The line is the 25,319 PDH stacked on the 25,252 4H EMA; sellers own everything beneath it. Fade the bounce into 25,250–25,410 and target the 24,950 shelf — lose that and it's 24,750 (weekly S1), then 24,712, the June low. Only a daily close back above 25,410 (the weekly pivot) hands the bulls the chair. Buying green candles up here is how tourists donate.
THE WEEK'S MAP (4H)
Upside: 25,252 (4H EMA) → 25,319 (PDH) → 25,407 (weekly pivot) → 25,660 → 25,978 / 26,064 (failed-breakout ceiling) — the supply to fade; a daily close above 25,410 flips it bullish.
Downside: 24,950 (shelf) → 24,892 (today's sweep low) → 24,750 (weekly S1) → 24,712 (June low) → 24,301 (weekly S2, stretch) — targets while 25,320 caps.
One number all week: 25,319 — the previous-day high stacked on the 4H EMA at 25,252. Sellers own the tape under it: fade rallies into 25,250–25,410 and target the 24,950 shelf, then 24,750 and the 24,712 June low. Reclaim and hold the 25,410 weekly pivot and the short's dead — bulls get 25,660 back. Below 25,320, sell the bounce; don't chase the hole.
THE CATALYSTS (CET)
Mon 13 — No Tier-1 data, EU or US. Dead-quiet open; the tape digests its own failed breakout, not the calendar.
Tue 14 — US CPI 14:30 CET (y/y 3.8% f/c vs 4.2%, core 2.8%); Fed Chair Warsh testifies 16:00; French Bank Holiday thins EU liquidity. THE whip of the week — soft CPI squeezes shorts into the supply, hot CPI hands sellers the 24,950 break.
Wed 15 — US PPI 14:30 CET; Warsh testifies day two 16:00; EZ Industrial Production 11:00; Buba's Nagel 18:00. CPI's echo — keeps the DAX on a US leash.
Thu 16 — US Retail Sales + Philly Fed + Jobless Claims 14:30 CET; EZ Trade Balance 11:00. Growth check; a strong consumer caps the bounce.
Fri 17 — EZ Final CPI 11:00 CET (revision, non-event); US Prelim UoM Sentiment 16:00. Confirmed prints — drift into the weekend.
BOTTOM LINE
Last week the bulls swore the 26,064 print was a breakout. It was a bull trap, and the tape spent five sessions proving it — selling straight back through the 25,754 floor to 24,958 and closing down -2.9% at 25,199. A breakout that dies below its own launch pad in a week isn't a trend; it's distribution, and the tourists who bought 26,000 are the bagholders now. Price is back at 25,209, clinging to the weekly EMA at 25,047 and the daily EMA50 at 24,925 — the only two rails between here and a full reversal — but capped hard under the 4H EMA (25,252) and the 25,319 PDH. Today's sweep to 24,892 got reclaimed; that's a bounce to sell, not a floor to buy. The play is clean: fade the rally into 25,250–25,410, target the 24,950 shelf, and if that cracks, 24,750 and the 24,712 June low come next. I don't touch the long side until bulls reclaim and hold the 25,410 weekly pivot. And the whole thing lives or dies on Tuesday's US CPI — 3.8% and cooling on the forecast — a soft number squeezes the shorts into the supply, a hot one hands them the 24,950 break on a plate. Trade the level, not the nostalgia: under 25,320, sell the bounce.
Not advice — trade your own plan.
DAX — Long — Buy the dips — the breakout is real.DAX — week of July 6 – 10, 2026: Long — Buy the dips — the breakout is real.
Last week the mob's precious 25,353 ceiling got kicked to splinters. DAX didn't tap it, it torched it — 25,810, 25,978, then a fresh 26,064 print, closing the week nailed to the highs at 25,946. This is not a range anymore; it's a trend, and the tape is above every line that matters — the weekly EMA (25,161), the daily EMA50 (24,855), the 4H EMA (25,679), all of them under price and rising. The weekly MACD flipped hard and is pulling away (370 vs 206). The only thing bulls have to do now is not fumble the breakout base at 25,754–25,679. Hold that shelf and 26,377 is the next stop. Anyone still short the top is fuel.
THE BIG PICTURE (weekly)
For five weeks the herd was trapped in a box between roughly 23,977 and 25,353, lunging at the ceiling and getting slapped down every time. Last week it stopped asking permission. DAX opened at 24,897, refused to break, then ripped straight through 25,353 like it was wet paper — 25,707, 25,810, 25,978 — and stamped a brand-new high at 26,064, closing the week pinned to its highs at 25,946. That is a breakout weekly candle, not a bounce. The weekly MACD tells the same story: it snapped above its signal and is accelerating (370 vs 206). Every EMA — weekly 25,161, daily50 24,855, 4H 25,679 — now sits below price, stacked and climbing. The easy money that spent a month selling 25,353 just got its face ripped off. This is a market that resolved higher, and it doesn't owe the doubters a re-test.
THE SWING (daily)
Price is above every EMA on every frame — that is not ambiguous, that is a stacked bull tape, and dips are for buying until it breaks. Monday opened strong at 25,995, printed a fresh 26,064 high, and is holding 25,972 with the previous day's low at 25,754 as the breakout floor. The line bulls must defend is the 25,754–25,679 shelf — the PDL stacked on the 4H EMA. Hold it and this grinds to 25,978 (PDH) → 26,064 → 26,377 (weekly R1). Only if they lose 25,679 does the air come out, and even then the weekly pivot at 25,547 and the weekly EMA at 25,161 catch it before anything bearish is on the table. Chasing green candles is for tourists; buy the pullback into the shelf, not the print.
THE WEEK'S MAP (4H)
Upside: 25,972 (spot) → 25,978 (PDH) → 26,064 (fresh high) → 26,377 (weekly R1) → 26,807 (weekly R2, stretch) — trend targets while 25,754 holds.
Downside: 25,754 (PDL / breakout floor — defend) → 25,679 (4H EMA) → 25,547 (weekly pivot) → 25,161 (weekly EMA) → 24,855 (daily EMA50).
One number all week: 25,754 — the previous-day low and breakout floor, stacked on the 4H EMA at 25,679. Hold it and bulls run at 25,978, 26,064, then 26,377. Lose 25,679 and it drifts to the 25,547 pivot; only under 25,161 is the breakout in doubt. Above the shelf, buy the dip.
THE CATALYSTS (CET)
Mon 6 — German Factory Orders 08:00, Sentix 10:30, EZ PPI + Retail Sales 11:00 CET (all low-tier). Light open; the tape trades its own breakout, not the data.
Tue 7 — German Industrial Production 08:00 + French Trade Balance 08:45 CET. Second-tier German data, background noise for the trend.
Wed 8 — Buba President Nagel speaks 13:30 CET; German 10y auction ~11:42. Hawk-watch, but no mover unless he surprises.
Thu 9 — ECB Monetary Policy Meeting Accounts 13:30 CET; Eurogroup 11:15. The week's only event with teeth — the rate-cut tone moves bunds and the DAX with them.
Fri 10 — German + French Final CPI 08:00 / 08:45 CET (finals, no surprise); ECOFIN 11:15. Non-events; trend drift into the weekend.
BOTTOM LINE
DAX answered the doubters with a hammer. The 25,353 ceiling that capped this market for a month didn't just crack last week — it got obliterated, price ripping to a fresh 26,064 high and slamming the close on the highs at 25,946. That is a breakout, not a bounce, and every EMA on every frame is now stacked beneath price and climbing while the weekly MACD accelerates. So drop the bearish nostalgia: the trend is up, and the tape doesn't care that you liked it cheaper. The job now is simple — buy the dip into the 25,754–25,679 shelf, the previous-day low stacked on the 4H EMA, and let it run at 25,978, 26,064, then 26,377. Only if bulls fumble 25,679 does this even pause, and it takes a break under the 25,161 weekly EMA to put the breakout back in question — a long way from here. The calendar is empty enough to let price be the story: nothing Tier-1 until Thursday's ECB Accounts, and even that's a footnote. Stop mourning the range and trade the level: above 25,754, you're a buyer. The crowd that's still short the top is just paying for your next leg.
Not advice — trade your own plan.
DAX — week of June 29 – July 3, 2026Bias: Top-heavy range — sell the rips.
The mob charged the 25,353 wall twice and got its teeth kicked in twice, then DAX crawled off to close last week flat on its back at 24,838. But don't kid yourself it's a breakdown: price still clings above the weekly EMA (24,735) and the daily EMA50 (24,688), and the weekly MACD is still above its signal. This is a tired, heavy range, not a collapse — yet. Sellers hold the whip under the 4H EMA at 24,946; the bulls have nothing to brag about until they reclaim it. Defend the 24,712–24,688 shelf or the floor opens.
THE BIG PICTURE (weekly)
DAX has spent five weeks caged between roughly 23,977 and 25,494, and the last three weeks tightened that into a 24,712–25,353 box. Twice now — last week and the week before — the herd lunged at 25,353, and twice it got thrown straight back. Last week opened at 25,111, kissed 25,353 a second time, and was dumped to close at 24,838, a bearish weekly candle parked right on its lows. The only thing keeping the bull story stitched together is the rising weekly EMA at 24,735 and a weekly MACD still above its signal (212 vs 148) — so this is a top-heavy range, not a confirmed breakdown. But don't romance it: the easy money this month was made selling the highs, and the tape closed the week looking down.
THE SWING (daily)
Price is now below the 4H EMA (24,946) — that is the sellers' line, and they hold the intraweek ball under it — but it is still above the weekly EMA (24,735) and the daily EMA50 (24,688), so the bigger-frame bid hasn't broken. Monday opened soft at 24,897, got capped at 24,966, and is grinding 24,824. Until the bulls reclaim 24,946 and then the 25,111–25,149 supply shelf, every rally into resistance is a gift to fade, not a trade to chase. The week's pivot is 24,946; the line in the sand is the 24,712–24,688 shelf. Lose that and there is air down to 24,517 and the 23,977 floor.
THE WEEK'S MAP (4H)
Upside: 24,946 (4H EMA cap) → 24,966 (Mon high) → 25,111 (PW open) → 25,149 (PDH) → 25,258 (swing) → 25,353 (wk high / double-top) — only on a reclaim and hold.
Downside: 24,735 (weekly EMA) → 24,712 (week low — defend) → 24,688 (daily EMA50) → 24,517 (prior-week low) → 23,977 (range floor).
One number all week: 24,946 — the 4H EMA. Sellers own the tape below it; the bulls have nothing until they reclaim and hold it. Below sits the 24,712–24,688 shelf — lose that and 24,517 then the 23,977 floor come into play.
THE CATALYSTS (CET)
Mon 29 — No Tier-1 EU print. Quiet open; range trade and position ahead of the CPI week.
Tue 30 — German Prelim CPI (state prints from ~08:00, national 14:00 CET) + French CPI 08:45 CET. Inflation appetizer before the bloc print.
Wed 01 — Eurozone Flash CPI, Core + Headline, 11:00 CET. THE print — sets ECB cut odds and the week's direction.
Thu 02 — US Non-Farm Payrolls 14:30 CET (pulled forward, July 4 holiday) + Eurozone Unemployment 11:00 CET. Global wildcard — DAX trades off Wall Street's reaction.
Fri 03 — ECB's Lagarde speaks 10:00 CET; US closed for July 4. Thin holiday tape, drift risk.
BOTTOM LINE
DAX showed its hand. It charged the 25,353 wall twice, got rejected twice, and slunk off to close last week on its lows at 24,838 — that is not a bull market, that is a crowd buying tops and donating capital. But don't get cute and short the hole either: price still clings above the weekly EMA (24,735) and the daily EMA50 (24,688), so this is a tired range, not a collapse — yet. Sellers own the tape under the 4H EMA at 24,946 and the 25,149 supply shelf. Want to be long? Make it reclaim 24,946, then 25,149, and prove the bid before you touch it. Until then, fade the rips. Lose the 24,712–24,688 shelf and the dip-buyers get to watch 24,517 and the 23,977 floor in real time, with Wednesday's Eurozone CPI holding the matches. Trade the level, not the wish.
Not advice — trade your own plan.
GEKKQUANT'S TAKE — DAX / Week of June 22 – 26, 2026Bias: Bearish lean, heavy below 25,103 — DAX rejected 25,353 and is defending its weekly low. Sellers hold the near-term ball.
THE BIG PICTURE — Weekly.
DAX reached for 25,353 this week and got thrown straight back, closing near the lows around 24,850 — a bearish weekly candle, down ~1.3%. The rally ran out of buyers at the highs and the week is closing weak, pinned just above the weekly low at 24,832 and well below the weekly pivot at 30,070… 25,103. The saving grace: price is still above the rising weekly EMA (24,715), so the bigger uptrend is intact — this is a pullback, not a breakdown. Yet.
THE SWING — Daily.
Today closed on the lows and price is now below both the daily EMA (24,975) and the 4H EMA (25,012), and it lost the previous day's low at 24,896. Near-term momentum belongs to the sellers. Until price reclaims 24,896 and then the EMAs back, rallies are there to be faded, not chased.
THE WEEK'S MAP — 4H.
Upside: 24,896 (prior-day low) → 25,103 (the line) → 25,264 (PDH) → 25,353 (week high) — only on a reclaim and hold.
Downside: 24,832 (week low — defend) → 24,715 (weekly EMA) → 24,655.
One number all week: 25,103. Above it the bulls have a case; below it, it's a sellers' tape.
THE CATALYSTS (CET).
Mon 22 — ECB's Lagarde speaks 15:00 & 17:25. Rate-path tone — the week's first cue.
Tue 23 — German & French Flash PMIs 09:15 / 09:30. First growth pulse for the bloc.
Wed 24 — Quiet. US tape leads.
Thu 25 — Light; US PCE drives the risk. Watch Wall St for the cue.
Fri 26 — No IFO / ZEW / CPI this week. Price & positioning lead.
GEKKQUANT'S BOTTOM LINE.
DAX showed its hand: it reached for 25,353, got rejected, and closed on the lows. That's sellers in control until they're proven wrong. Defend 24,832 and reclaim 24,896 then 25,103, and the bulls get back in the game; lose 24,832 and the 24,715 EMA is where the next fight happens. Don't buy weakness on hope — the tape just rejected the highs, so make it prove the bid before you trust it.
DAX Index Technical Analysis: Is the Rally Ending?Current Level: 24,800 Points
Timeframe: Weekly & Monthly
1. Market Overview
Hello TradingView followers. Today, we are analyzing the German DAX index on weekly and monthly timeframes to evaluate its medium to long-term outlook.
Since its 2022 low around 12,000, the DAX has maintained a strong upward trend, recently testing historical highs near 25,500. Following a correction down to 22,500 in April 2026, the 25,000 level has now become a critical psychological resistance zone.
2. Technical and Volume Analysis
Looking closely at the indicators and chart structures, the upward momentum shows significant signs of exhaustion:
Volume & Capital Outflow (OBV): The On-Balance Volume (OBV) indicator signals long-term capital outflows starting on the weekly chart. This bearish signal intensifies on the monthly periyot, showing that institutional support is fading.
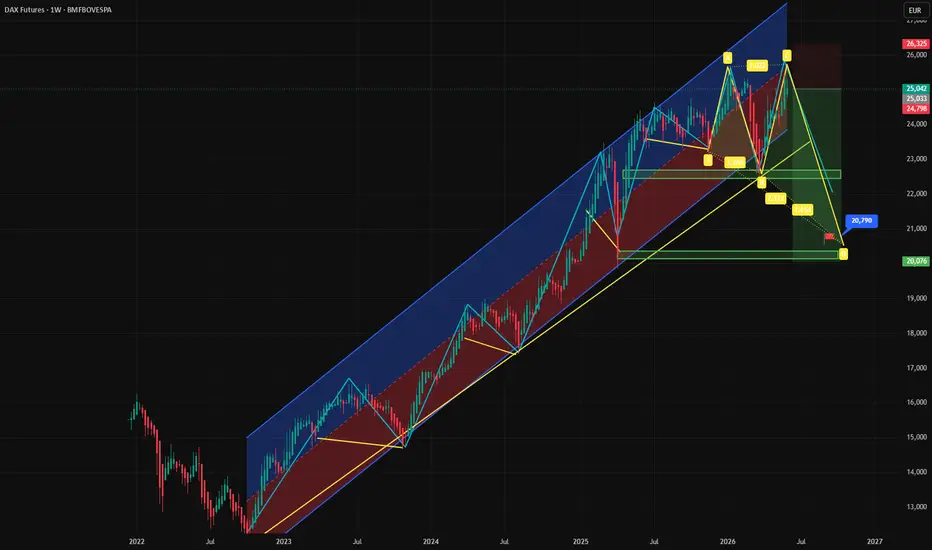
Regression Channels: The DAX lacks a genuine, sustainable uptrend on the monthly chart. Trading near the lower band of the Linear Regression Channel suggests that the upward move is ending, creating an excellent risk-reward opportunity for short (sell) positions.
Momentum & Formations: Both Momentum and RSI show a flat-to-downward loss of speed. More importantly, based on Fibonacci levels, a Monthly Harmonic Reversal Formation is perfectly active on the macro chart, confirming a potential top structure.
3. Macroeconomic & Geopolitical Risks
This technical weakness is strongly aligned with escalating global risks that directly pressure the European economy:
Rising geopolitical tensions in the US-Iran-Israel triangle.
The ongoing energy supply crisis in the Strait of Hormuz, driving expectations for a sharp upward spike in oil prices.
The economic drag of the continuous Russia-Ukraine war on the Eurozone's energy and raw material costs.
4. Conclusion and Targets
In conclusion, massive capital outflows, a monthly harmonic reversal pattern, and deepening geopolitical crises suggest that the tide has turned for the DAX.
As selling pressure builds in the coming weeks, we expect the index to test our downside targets sequentially at: 24,444 – 23,850 – and 23,360. Breaking below these levels could trigger panic selling and a much sharper correction. We recommend strict risk management and focusing on short-oriented strategies.
Good luck with your trades, see you on the charts!
#202619 - priceactiontds - weekly updateGood Evening and I hope you are well.
comment: Neutral. Still tough to be a bear, much more so close to 24000. This could easily become a higher low and go for 24500 or 25000 again. Selling here at 24000 where the market bounced the past month is stupid. It could also continue in this down channel for 1 1/2 more legs down and re-test 23000. I don’t know, I won’t pretend I do. Oil supply shock is still not felt strongly enough for me to expect this to melt lower. Oil above 110 would change that.
current market cycle: trading range / bigger triangle between 22000 - 25847
key levels for next week: 23680 - 25000
bull case: Bulls will probably buy in this area above 24000 in hope or another leg up. Their case is a bit better if Oil stays below 100$. Above 100$ Oil this has no business being up here. This is what I wrote last week and still valid. Bulls have the better argument to stay above 24000 for now.
Invalidation is below 23600 (daily close)
bear case: Sideways market and bears need to make a lower low below 23700 for it to mean something. This would open up the path down to 23000 or lower.
Invalidation is above 25300
short term: Neutral. Nothing new to write about this. Chart-wise bulls are a bit favored but Oil already melted more. I don’t think any market has any reason to be this high but here we are. I would not short here at prior support.
medium-long term - update 2026-05-10: My base case is the world is completely ducked with Oil this high and 20+% Oil production not being delivered. We could see dax 20000 over the next weeks/months and ultimately even a print below 19000. If we get there, buy with both hands and then some more. I expect big bulls beginning to scale in close to 20000 and they would add on the way lower.
#202615 - priceactiontds - weekly update - daxGood Evening and I hope you are well.
comment: Max bearish. 12 sessions for a 12.98% gain. Opex is over. Markets are free to maybe price the risk of the biggest Oil supply shock in history, appropriately. Let’s see where we close on Monday.
current market cycle: trading range
key levels for next week: 22000 - 26000
bull case: Overdone, overbought, max complacency into opex.
Invalidation is below 24400
bear case: Bears are free of opex and now news are going in their favor again. If oil markets go up, markets will go down. That simple. If we go one tick above 24965, we have not gapped down and continued down, so I am most likely wrong again.
Invalidation is above 24971
short term: Oil up, markets down. Follow that one. If Oil rips above 100$ on Monday, expect markets to reverse as much because this rally was beyond everything. Bulls will run for the exits while they can. If they continue to suppress oil futures, well - I continue to be wrong and risk-can will be kicked down the road longer.
medium-long term - update 2026-04-04: The headlines will dictate the direction. My base case is the world is completely fucked with Oil this high and 20+% Oil production not being delivered. We could see dax 20000 over the next days/weeks and ultimately even a print below 19000. If we get there, buy with both hands and then some more. I expect big bulls beginning to scale in close to 20000 and they would add on the way lower.
FDXS1! Between support and resistance. Which way does it break?The FDXS pushed above $23,500 resistance last week and despite gapping lower overnight, we're still holding above it. That level is now the line in the sand.
The problem is we're trapped. $23,500 below, $24,271 above. Until one of those breaks, this is a range trade.
On the Daily, acceleration finished last week at extremes, which often signals the end of a move rather than the beginning of one. The Bias Cloud remains Bearish with the Directional Wave beginning to re-expand to the downside. Volume Polarity started the week bearish but is attempting to push higher, which adds to the confusion.
The Weekly tells a cleaner story. Acceleration hit extremes four weeks ago flagging a potential relief rally, which has since played out. The Bias Cloud flipped Bearish two weeks ago and the Directional Wave is expanding to the downside. Volume Polarity is Bearish and still expanding.
The signals on the lower timeframes are mixed but the Weekly is not. Until $23,500 breaks or $24,271 is reclaimed convincingly, I'm watching rather than trading.
#202615 - priceactiontds - weekly update - daxGood Evening and I hope you are well.
comment: Max bearish. If all war parties report a peace-treaty, I am wrong but so be it. I do think that also the next talks will fail, almost no traffic through the straight and Oil prices will go ballistic over the next 2 weeks. Bears argue we re-tested the breakout price area around 24400 and on the weekly tf they argue that we had W1 and this is W2, which is not the strongest argument. Bulls front-run if to the max and then some. They know above 24500 more bears will cover and we could get a third leg up, which could very well bring a new ath, which is insanity but it’s what markets do more often than anyone can imagine. If talks fail, I doubt we make new lows until oil makes another 20% from here (wti at 96.57).
current market cycle: monthly tf bull trend in jeopardy - bulls need to keep the trend line alive. daily close below 22000 is confirmation of the end and we will be in a bear trend and also in most likely a bigger trading range from the 2020 lows to 25k ath.
key levels for next week: 22000 - 24500
bull case: Bulls got more than most dreamed of. 3 straight week of gains into the biggest Oil crisis the world has ever seen. They want more because the pain trade is likely still up. A daily close above 24500 would most likely make more bears cover and it would be a close above the breakout price area and also above the weekly 20ema. Many many reasons why they want above and also why bears rejected it so far. From a macro perspective everyone and their dog knows this rally is moronic and with Oil keeping at the highs time runs against the bulls. Only real bullishness will come from a solid agreement from all war parties and 30-50+ daily straight crossings.
Invalidation is below 23500
bear case: My two-legged (abc) correction was perfectly drawn but it was not was I was hoping for. Bears are in do or die mode here below the breakout area. They can still argue it’s a normal two-legged pullback on the weekly chart and it was W2 but that argument is weak at best as of now. They have all the reasons on their side to turn again. Talks went nowhere, Oil will likely close above 100$ again tomorrow and markets have all the reason to sell-off again. That does not mean they will though. The 50% retracement is around 23850 which will be my first target on futures open. Below that bears have to close the gap to 23450 and if they can manage that, they have a good chance of going lower again. How low? I highly doubt we make new lows unless Oil goes really ballistic and above 120+. So selling above 24000 and buying 23000 will be my main focus until Oil rips or US invades.
Invalidation is above 23600
short term: 3 weeks of nasty squeezing, can they get a 4th? I highly doubt that after the failed talks. I would not be surprised if we would see an escalation “to show force” and something something “art of the deal”. Full bear mode for me if I see weakness.
medium-long term - update 2026-04-04: The headlines will dictate the direction. My base case is the world is completely fucked with Oil this high and 20+% Oil production not being delivered. We could see dax 20000 over the next days/weeks and ultimately even a print below 19000. If we get there, buy with both hands and then some more. I expect big bulls beginning to scale in close to 20000 and they would add on the way lower.
#202614 - priceactiontds - weekly update - dax futures Good Evening and I hope you are well.
comment: Max bearish. Wednesday + Thursday likely was a short squeeze and I think we will see a giant leg down next week. Iran basically said “fck off” to the US and more US troops arriving in the middle east. If this is still a bear trend, the daily 20ema is one of the best spots to look to sell the rips. If I am wrong and markets continue upwards until the real escalation, yeah well, C could go up to 24500. I just cannot see it. Most likely any print above 23600 on Monday/Tuesday would mean I’m wrong.
current market cycle: monthly tf bull trend in jeopardy - bulls need to keep the trend line alive. daily close below 22000 is confirmation of the end and we will be in a bear trend and also in most likely a bigger trading range from the 2020 lows to 25k ath
key levels for next week: 21000 - 23600
bull case: Bulls got their bounce/short squeeze. They want to go sideways and make bears doubt the new bear trend. Any print above this weeks high 23600 could make more bears cover and wait. I can not see that happening without any hopeful news about a ceasefire or negotiations.
Invalidation is below 23200
bear case: My line in the sand for bears is 23600. Above means they are weak and bulls could squeeze more. Below 23200 we could see bears taking over again. On Thursday they let a nasty reversal happen but so far kept it below the breakout price of around 23400. If they can keep this a lower high, bulls can not hold long in hopes of more upside because the downside potential is gigantic. Below 22800 I expect a huge acceleration down to 22000 and if the news become bad enough, we will break the bull trend line from 2022 and go for 21000 and most likely the 2025 April lows afterwards.
Invalidation is above 23600
short term: I can not, for the life of me, seeing the bulls buying this on Monday. I was wrong about this before and markets squeezed higher on worse news though. So my base plan is waiting for confirmation by the bears getting below 23200 and not wanting to see a print above 23600. Otherwise I am as bearish as can be, unless Oil goes down in a straight line below 100 and stays there. Something would be up then. I expect more escalation and more war.
medium-long term - update 2026-04-04: The headlines will dictate the direction. My base case is the world is completely fckd with Oil this high and 20+% Oil production not being delivered. We could see dax 20000 over the next days/weeks and ultimately even a print below 19000. If we get there, buy with both hands and then some more. I expect big bulls beginning to scale in close to 20000 and they would add on the way lower.
#202613 - priceactiontds - weekly update - daxGood Evening and I hope you are well.
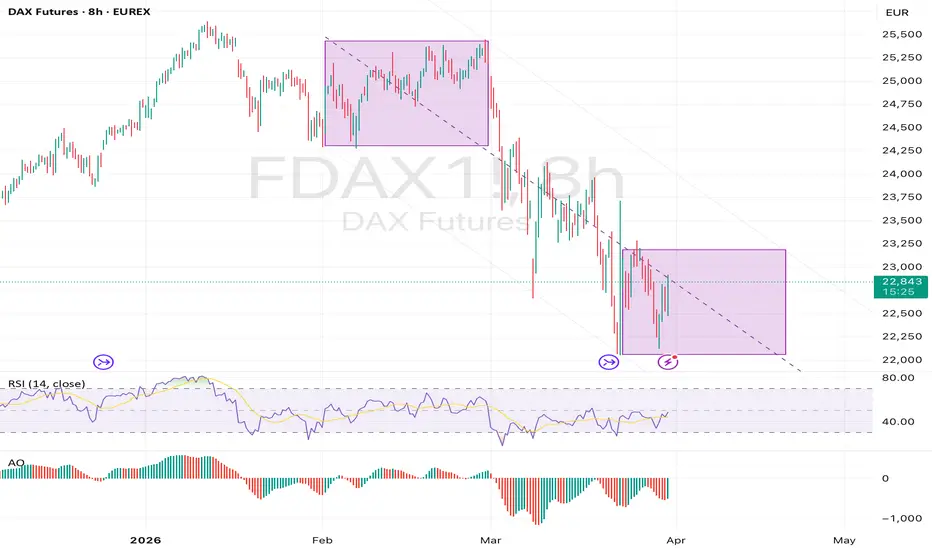
comment: Neutral. I do think we will dip some below 22000 just to run stops but I would only look for longs there for another bounce. W4 was a bit too short imo. More oscillating around 22500 seems more reasonable to me here. Monday could start as another huge down move and if the markets bleed bad enough, I expect another big TACO tweet. Depending on how you draw the bull trend line from the 2022 lows, we are either close or touched it. That means we also passed the 50% retracement for the bull trend after the 2025-04 lows. Every bull dreamed of this pullback for 10 months and one can not remain too bearish down here. Sure we could dip below 22000 but I expect much more sideways movement until we either get a ceasefire and real talks or a big escalation like US boots on Iranian ground. Also xetra already dipped below and printed 21863 so betting on futures doing the same is weird at best.
current market cycle: monthly tf bull trend in jeopardy - bulls need to keep the trend line alive
key levels for next week: 21000 - 23300
bull case: There will be bulls buying this 50% retracement and 22000 on xetra, thinking we can at least do sideways between 22000-23000, which translates to futures 22200-23200. The big bull trend line and the 50% retracement are likely the reason dax did not make new lows last week and went sideways. Bulls want to turn the market neutral with another flat week and go sideways. Any print above 23300 would be amazing for them, because it would mean higher highs again.
The green ABC is the potential path if we get a ceasefire confirmed by Iran.
Invalidation is below 21700
bear case: Last week I made the case for the 50% retracement being a bad spot for shorts and we would likely see W4 and we are in it. Maybe this one is much shorter than the first and we see a quick W5 spike but even then I would rather look for longs below 22000. The bear channel is tight so bears are strong but most bears will not force anything at this big trend line. Any print below 21900 would surprise me and I would then favor the quick W5 thesis. This will most likely be the first month closing below the monthly 20ema since 2023. Let that sink in a bit.
Invalidation is above 23500
short term: Sideways to up most likely
medium-long term - update 2026-03-29: 22000 hit so I can only see a prolonged bear trend, if the war escalates, oil >= 100$. In that case, we will see 20000 or lower this year. If the us chickens out, my best guess is a big triangle with higher lows and lower highs on the monthly chart. So staying above 19700 and below 25800.
FDXS1! - DAX set to cross bearish on the Weekly...With a bullish bias going back to December '23, the FDXS1! setting up to flip it's Weekly bias to bearish for the first time in over two years.
Recently we saw a strong push up, followed by 7 months of sideways action and brief fake out to the upside on low volume.
After multiple bearish signals firing, the Directional Wave has accelerated to the downside as displayed by the histogram.
Having broken support at the 23,480 level, are we primed to push all the way down to the next major support at 19,000? Or does the acceleration downward let off and give us some breathing room?
Either way, we'll know soon.
#202610 - priceactiontds - weekly update - dax futuresGood Evening and I hope you are well.
comment: Not as max bearish as last week but still enough. We are looking at huge support at 22500 and 22000. Tough to short down here tbh. The lowest this big bull trend line can be drawn is around 21700ish, which is a valid target but shorting below 22000 is bad no matter how you look at it. If you could get in early when futures open or if you are still short, nice but otherwise you have to wait for a pullback. Big gap down means shorts are ducked from the r:r perspective. You can never bet on a limit down day. Any short closer to 22600 or 22800 is as good as it gets. Stop has to be 23290 still. Stops 23150 can work too but swinging this is probably the best option. And yes I can be wrong about invalidation targets again and yes we could see a giant squeeze before more downside.
current market cycle: bull trend only remains on the monthly chart - daily chart bear trend and close to the bull trend line on the monthly tf
key levels for next week: 21700 - 23500
bull case: Bulls got nothing but hope. Any tweet might still be good for a spike but ultimately I expect them to fail. The only thing saving the bulls would be Trump & Israel backing down and that is as likely as the release of ALL the Epstein files.
That has not changed and I will not change it just because.
Invalidation is below 21700
bear case: Sell the rip market and bears have the best setup for a crash down since 2025-04. Lets. Ducking. Go.
We have reached the 50% retracement from the 2025-04 lows to ath and we are close to the bull trend line from the 2022 lows. This is a zone where I expect buyers to step in again and we will likely see W3 soon. W4 could go on for around 2 weeks like W2 and a W3 could bring us down to my ultimate target of 20000. Only a deep recession can break that price. I do think we can do a flush down to maybe 21000 but that’s a bit much for W3 tbh. Tough spot right now to enter new positions. So either join huge momentum to the downside for the big round numbers or wait.
Invalidation is above 23500
short term: Give me the black Monday. Again. Want to see it a bit lower and touching the bull trend line around 22000 before W4 (sideways to up).
medium-long term - update 2026-03-15: Bull trend line around 22000 will get tested over the next days and I do think we will break it to put us into a bear trend and then likely a prolonged trading range on the monthly chart. I think we can re-visit the 2025-04 lows.
#202609 - priceactiontds - weekly update - daxGood Evening and I hope you are well.
comment: Neutral. Weekly chart is clearly bullish but how bullish is it really? We have made 6 higher highs the past 30 days for a gain of 300 some points. We are inching closer to a new ath and we can never rule out printing a new one but I think the new US war could throw a monkey wrench into that. We continue inside nested bull wedges and we are at the top of the inner one. Only thing I would do here is sell. Anything below 24900 would be amazing for the bears and we could test down to 24700.
current market cycle: bull trend / nested bull wedges
key levels for next week: 24000 - 26000
bull case: BTFD keeps working. I won’t change what I have written just to write new excrement because it’s still the same. We are in the same patterns and doing the same stuff. Bears can’t keep anything going and bulls buy every dip. For that to change we would have to make lower lows again. Until then bulls can be confident to touch 25640 or higher. If I were bullish, the last thing I would do is buy any dip on Monday though.
Invalidation is below 24900
bear case: Bears will likely have the chance to create a risk-off narrative due to the news here. Below 24900 bulls could get forced into more profit taking because we have so much downside potential. The next big support below 24900 would be 24600ish, followed by 24200-24300. I want to be bearish but given the weakness by the bears the past 4 months, it’s tough. I reiterate once again, only a gap down with follow-through and not closing it, would open the possibility of much lower prices. Bulls need to get trapped and forced out. BTFD has been working for too long so you need a really strong move to end it.
Invalidation is above 25700
short term: Tough. News could easily make us gap down below 25000 and continue down and even then it wouldn’t be the first time market then prints another higher high before finally turning.
medium-long term - update 2026-02-22: I want this to go down but for now nothing bearish is sticking and economic data is not even remotely bad enough in any direction to justify selling. Something has to break.