EURJPY - Long squeeze on support amid a bullish trend FX:EURJPY has fallen sharply following the Bank of Japan's intervention, triggering a long squeeze below key support. A recovery back into the trading range could provide the foundation for a bullish rebound
The market is currently stabilizing after the sharp decline, with price testing what was previously the daily range support, now acting as resistance.
A move back above the 180.80 level, followed by sustained consolidation, would confirm the recent breakdown as a false breakout and could trigger a bullish impulse
Resistance levels: 182.10, 183.56
Support levels: 180.80, 179.50
If buyers manage to reclaim and hold 180.80, the pair could regain upside momentum, opening the way for a recovery toward the next resistance levels
Best regards,
R. Linda
Euro / Japanese Yen
No trades
No trades
In-depth trading ideas
EURJPY H4 | Heading Towards Pullback ResistanceBased on the H4 chart analysis, we can see that the price is rising to our sell entry level at 183.25, a pullback resistance.
Our stop loss is set at 184.88, an overlap resistance.
Our take profit is set at 180.91, a pullback support.
High Risk Investment Warning
65% of retail investor accounts lose money when trading CFDs with this provider. You should consider whether you understand how CFDs work and whether you can afford to take the high risk of losing your money.
EURJPY: Bearish Momentum Building — Sell Setup in FocusEURJPY 30-minute chart — trading perspective
The chart shows a broader bullish structure, with price generally forming higher highs and higher lows. However, price is currently approaching a major resistance/supply zone around 182.55–182.70, where sellers have previously appeared. The recent sharp sell-off from this area and subsequent recovery suggest that volatility is elevated, so confirmation is important before entering.
Bullish scenario
The immediate bullish bias remains valid while price holds above the 182.20–182.25 area.
A sustained 30-minute close above 182.60–182.70 would be a strong bullish confirmation.
If resistance breaks with momentum, the next upside levels to watch are:
182.80
183.00
183.20+ if the breakout develops into a larger continuation move.
A safer long setup could come from a breakout followed by a retest of 182.55–182.60 as support.
Another bullish opportunity would be a pullback toward 182.20–182.30 followed by a clear bullish reaction.
Bearish scenario
The 182.55–182.70 region remains the key rejection zone.
If price fails to break this resistance and produces bearish rejection, downside pressure could return.
A break below 182.20 would weaken the short-term bullish structure and increase the probability of a move toward:
182.00
181.75
181.60–181.50
181.30–181.20 as a deeper support zone.
The chart's projected bearish path points toward approximately 181.75 as the first major downside target.
A sustained break below 181.60 would suggest that the short-term bullish structure is losing control and could open the way toward 181.40–181.20.
Key levels
182.60–182.70: major resistance/supply zone
182.55: important breakout/rejection area
182.30–182.20: immediate short-term support
182.00: psychological and structural support
181.75: primary bearish target shown on the chart
181.60–181.50: important demand/support zone
181.40–181.20: deeper support area
Trading perspective
The market is currently at a decision point. Buying directly into 182.60–182.70 resistance carries higher rejection risk. From a technical perspective, it is preferable to wait for either a confirmed breakout and retest for a continuation long, or a clear rejection followed by a break of 182.20 for a short setup.
The bullish structure remains intact above the key support zones, but the large bearish impulse visible around 182.60 shows that sellers are capable of producing aggressive moves from the resistance area.
In simple terms:
Bullish: hold 182.20 → break 182.60/182.70 → target 182.80 → 183.00+.
Bearish: reject 182.60/182.70 → break 182.20 → target 182.00 → 181.75 → 181.60/181.40.
Risk management: avoid treating any level as guaranteed. Wait for candle-close confirmation, preferably combined with momentum/volume, and define the invalidation level before entering the trade.
The Fed of Japan Needs More EURThe US Federal Reserve of Japan will need a lot more EURs to sell to push this pair low enough to CRACK!
Trying to kill the shorts will not fix Japan's economic problems. No matter how much lipstick the Trump regime puts on that pig.
"I am buying JPY bc Scott Bessen, a failed FX trader, is selling EUR to save the $" is not an investment thesis.
Who is going to bail out the DXY when it collapses? Japan?
If you enjoy the work: 👉 Drop a solid comment. Let’s push it to 7,000 and keep building a community grounded in raw truth, not hype.
E U R J P Y : (€187 000 Price Drop)Eurjpy has been one of the stronger yen crosses recently. Today the pair is trading around the (€187 000) area after breaking above a key (Resistance Zone) near (€186 500–€186 605) earlier this week, Major resistance / all-time high area (€187 950)
Eurjpy declined today as traders took profits near record-high levels and the Japanese yen strengthened. After an extended bullish run, buyers became cautious around resistance, leading to selling pressure. Increased focus on Bank of Japan policy expectations supported the yen, helping drive a corrective move lower.
Despite today's drop, the broader trend remains (Bullish) unless key support levels are broken.
If Eurjpy reclaims and holds above the (€184 000–€185 000) region, buyers could attempt a recovery back toward previous resistance zones.The broader trend before the intervention was still bullish, but we shall wait and see what happens and stay ready to (Capitalize) on any opportunities they may arise but remember to trade (Cautiously) and follow all trading plan rules accordingly.
⬇️ Previous Trade Below ⬇️
EUR/JPY — Bearish Pullback & Continuation SetupEUR/JPY — Daily Short Setup
Price has shown a strong bearish rejection from the 187.00–188.00 resistance area, followed by an impulsive decline toward the 179.00–180.00 zone.
The current move appears to be a corrective pullback into the 183.00–184.00 area. I am looking for this retracement to fail and for bearish momentum to resume.
Trade Setup:
Direction: Short
Entry: 183.40–183.60
Stop Loss: 184.30
Take Profit: 178.00
Risk/Reward: Approximately 1:6
The bearish thesis remains valid as long as price stays below the 184.30 invalidation level. A decisive break and daily close above this area would invalidate the setup.
Key confirmation: rejection from the 183.50–184.00 zone followed by renewed selling pressure.
This is a technical analysis setup, not financial advice. Proper risk management is essential.
EURJPY: Important Breakout 🇪🇺🇯🇵
EURJPY broke and closed above a significant daily resistance cluster.
The broken structure turned into a strong support.
The market will likely continue recovering and reach 183.8 resistance level soon.
❤️Please, support my work with like, thank you!❤️
I am part of Trade Nation's Influencer program and receive a monthly fee for using their TradingView charts in my analysis.
EURJPY: Why did the market react so sharply?EURJPY: Why did the market react so sharply?
EURJPY made a sharp move lower: price briefly broke below the 182.00 area, printed a long downside wick toward 181.33, and then quickly recovered back above 182.30–182.40.
This looks less like a clean bearish breakdown and more like a yen headline / intervention-risk spike.
Market Is Afraid of JPY Intervention
After recent reports about U.S.-Japan support for the yen, traders became much more sensitive to any JPY-related headlines.
When the market sees intervention risk — or even a hint of official support for the yen — JPY pairs can drop quickly. EURJPY, USDJPY and GBPJPY all become vulnerable because crowded long positions may rush to the exit.
Long EURJPY Stops Were Triggered
Price had been sitting near the 182.60–182.63 resistance zone, where many short-term buyers were likely positioned.
Once the sharp move lower started, stop-losses below 182.00 were triggered. That accelerated the drop and pushed price quickly toward 181.33.
But the market still needs stronger proof of JPY strength
After the initial drop, EURJPY was bought back quickly.
The reason is simple: intervention risk can create violent moves, but it does not always create a lasting trend. Without a more hawkish BoJ or stronger follow-through from official pressure, the market may still hesitate to believe in sustainable JPY strength.
On the Chart, this looks like a liquidity sweep
Price took liquidity below 182.00, but failed to hold below that level.
Sellers hit the market aggressively, but they could not keep control. That is why the fast recovery above 182.30–182.40 matters.
In short: EURJPY dropped because traders feared yen support / intervention risk, but recovered quickly because the market still needs stronger confirmation before fully believing in sustainable JPY strength.
⚠️ Personal market commentary, not financial advice.
EURJPY - BoJ rate decision and inflation dynamicsThe week starts with a relatively light macro calendar, with the main focus on Japanese economic data and the BoJ’s latest policy views. Japan’s current account and trade figures, alongside the Economy Watchers survey, will provide an early read on domestic and external demand. The BoJ Summary of Opinions from the July meeting will be particularly important for clues on the timing of further rate hikes and the Board’s assessment of inflation and growth.
In Europe, Norwegian and Danish CPI and Germany’s wholesale prices will offer some fresh inflation signals, although none are likely to be major market movers unless they surprise significantly.
On the corporate side, earnings are led by Ferguson Enterprises, Alcon, AST SpaceMobile and USA Rare Earth, with investors likely to focus on forward guidance and any indications of demand across construction, healthcare and the strategic space/rare-earth sectors.
Key market focus: BoJ policy expectations, Japanese inflation/rate dynamics and whether European price data reinforces the recent easing trend.
Key Support and Resistance Levels
Resistance Level 1: 184.24
Resistance Level 2: 184.80
Resistance Level 3: 185.45
Support Level 1: 181.30
Support Level 2: 180.26
Support Level 3: 170.36
The information provided does not constitute investment advice nor take into account the individual financial circumstances or objectives of any investor. Any information that may be provided relating to past performance is not a reliable indicator of future results or performance. To the extent permitted by law, in no event shall Trade Nation (or any affiliate or employee) have any liability for any loss arising from the use of the information provided. Any person acting on the information does so entirely at their own risk. Any information which could be construed as “investment research” has not been prepared in accordance with legal requirements designed to promote the independence of investment research and as such is considered to be a marketing communication.
Financial Spread Bets and CFDs are complex instruments and come with a high risk of losing money rapidly due to leverage. 73.7% of retail investor accounts lose money when trading CFDs with this provider. You should consider whether you understand how CFDs work and whether you can afford to take the high risk of losing your money.
EURJPY Is Very Bearish! Sell!
Please, check our technical outlook for EURJPY.
Time Frame: 4h
Current Trend: Bearish
Sentiment: Overbought (based on 7-period RSI)
Forecast: Bearish
The price is testing a key resistance 183.728.
Taking into consideration the current market trend & overbought RSI, chances will be high to see a bearish movement to the downside at least to 182.182 level.
P.S
Overbought describes a period of time where there has been a significant and consistent upward move in price over a period of time without much pullback.
Like and subscribe and comment my ideas if you enjoy them!
Potential bullish rise?EUR/JPY could fall to the pivot and bounce toward the overlap resistance.
Pivot: 182.86
1st Support: 180.88
1st Resistance: 185.72
Disclaimer:
The opinions given above constitute general market commentary and do not constitute the opinion or advice of IC Markets or any form of personal or investment advice.
Any opinions, news, research, analyses, prices, other information, or links to third-party sites contained on this website are provided on an "as-is" basis, are intended to be informative only, and are not advice, a recommendation, research, a record of our trading prices, an offer of, or solicitation for, a transaction in any financial instrument and thus should not be treated as such. The information provided does not involve any specific investment objectives, financial situation, or needs of any specific person who may receive it. Please be aware that past performance is not a reliable indicator of future performance and/or results. Past performance or forward-looking scenarios based upon the reasonable beliefs of the third-party provider are not a guarantee of future performance. Actual results may differ materially from those anticipated in forward-looking or past performance statements. IC Markets makes no representation or warranty and assumes no liability as to the accuracy or completeness of the information provided, nor any loss arising from any investment based on a recommendation, forecast, or any information supplied by any third party.
SELL EURJPYIn all these years that I've studied the financial markets, honestly, neither stocks nor crypto have ever been appealing—they are just boring and amateurish. What always challenges people is, in my opinion, much more enjoyable, for example, the Forex market, or perhaps the formation of the 5th wave of EUR/JPY that I am currently waiting for."
Bullish continuation setup?EUR/JPY is falling toward the pivot, which is a pullback support that aligns with the 61.8% Fibonacci retracement and could bounce towards the 1st resistance.
Pvivot: 186.64
1st Support: 186.15
1st Resistance: 187.41
Disclaimer:
The opinions given above constitute general market commentary and do not constitute the opinion or advice of IC Markets or any form of personal or investment advice.
Any opinions, news, research, analyses, prices, other information, or links to third-party sites contained on this website are provided on an "as-is" basis, are intended to be informative only, and are not advice, a recommendation, research, a record of our trading prices, an offer of, or solicitation for, a transaction in any financial instrument and thus should not be treated as such. The information provided does not involve any specific investment objectives, financial situation, or needs of any specific person who may receive it. Please be aware that past performance is not a reliable indicator of future performance and/or results. Past performance or forward-looking scenarios based upon the reasonable beliefs of the third-party provider are not a guarantee of future performance. Actual results may differ materially from those anticipated in forward-looking or past performance statements. IC Markets makes no representation or warranty and assumes no liability as to the accuracy or completeness of the information provided, nor any loss arising from any investment based on a recommendation, forecast, or any information supplied by any third party.
EUR/JPY Price Outlook – Trade Setup🌐Macro Background
Coordinated Intervention Dynamic: Japan confirmed it conducted a joint foreign exchange intervention with the U.S. Treasury to support the weak yen. Rather than selling USD, reports indicate the U.S. Treasury bought yen against euros (selling EUR). Selling euros allows the U.S. to assist Japanese authorities in strengthening the yen without signalling a desire for a weaker U.S. Dollar.
Market Impact: The sudden yen-buying operation triggered a sharp appreciation in JPY across major pairs. EUR/JPY dropped to its lowest level since November before consolidating around 181.50 in Asian trading.
📊Technical Structure
The EUR/JPY 4-Hour chart illustrates a sharp, news-driven sell-off followed by a modest bounce:
Resistance Zone: Located between 182.04 and 182.84
Support Zone: Found between 179.93 and 180.74
🎯Trade Setup
Look to open short positions on relief rallies into the 182.00–182.50 Resistance Zone, setting a stop loss above 183.10 and targeting 180.74 and 179.93.
❌Invalidation
Invalidation Level: A sustained 4-hour candle close above 182.84.
📝Trade Summary
Joint action by U.S. and Japanese authorities—specifically selling EUR to buy JPY—creates strong macro resistance for EUR/JPY. Sell on rallies into the 182.00–182.50 zone, targeting a retest of the lower support area around 180.00.
⚠️Disclaimer
This analysis is for reference only and does not constitute trading advice. Financial markets involve significant risk; proper risk and position management are essential.
EURJPY: Why this move is about the yen, not the euroEURJPY: Why this move is about the yen, not the euro
Japanese wisdom says: “After victory, tighten the cords of your helmet” — 勝って兜の緒を締めよ.
EURJPY has fallen 3.35% over five sessions, while USDJPY has declined 4.06%. EURUSD, however, has gained 1.24%.
This suggests that the decline is predominantly driven by yen strength following the confirmed US–Japan intervention—not broad euro weakness.
EURJPY remains below the EMA 9, EMA 20, SMA 50 and SMA 200. The broader hourly structure is bearish, although price is attempting to stabilize near 180.15.
Why 180.00–180.15 matters:
• Marked horizontal support
• Rejection from the recent low
• Psychological 180.00 level
Key levels: Support: 180.15, then 179.30Resistance: 181.49 and 183.27
An hourly close below 180.15 followed by a failed retest would support continuation toward 179.30. A recovery above 183.27 would invalidate the short-term bearish structure.
Will EURJPY break below 180.15 — yes or no?
This material is intended for informational purposes only and does not constitute investment advice or a personalized investment recommendation.
The yen. The Bank of Japan. Carry trade.One market — analyzed to its core.— YenSensei
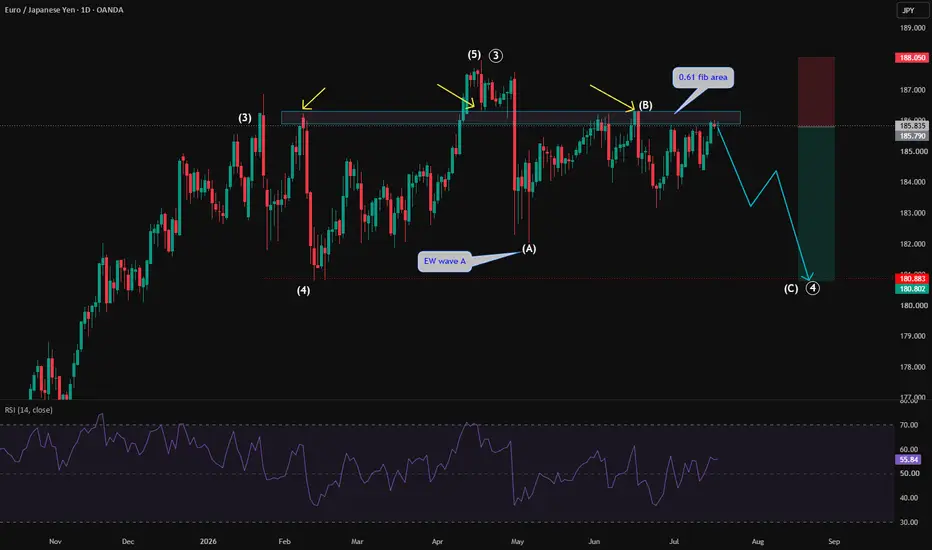
EURJPY | Liquidity Sweep Signals Potential Bearish ReversalEURJPY is currently approaching a significant technical inflection point after sweeping buy-side liquidity above the June high and retesting a historical resistance zone that has remained influential since January. Price is also developing a potential Head and Shoulders reversal pattern beneath this resistance, although the formation remains unconfirmed until further bearish price action develops. I will therefore be monitoring for a clear rejection from the highlighted resistance area before considering short exposure, rather than anticipating an immediate reversal. A sustained daily close above the April 17th high would invalidate the current bearish thesis, while downside objectives remain the July low, June low, and May low. Additional technical confluence may also develop should price retrace towards the 200-period EMA, which could align with the July low and provide an area of dynamic market reaction. Although the TDI is beginning to enter overbought territory, no bearish divergence has yet formed, reinforcing the need for confirmation before entering a position.
From a fundamental perspective, the broader macro backdrop could complement this technical outlook if expectations of continued Bank of Japan policy normalisation support the Japanese yen. Any increase in global risk aversion may also encourage the unwinding of yen-funded carry trades, historically providing additional demand for JPY and increasing downside pressure on EURJPY. Conversely, softer Eurozone economic data or a more accommodative stance from the European Central Bank could weaken the euro, further aligning with the bearish technical structure. Market participants should continue to monitor upcoming BoJ and ECB policy decisions, inflation data, and broader risk sentiment, as these developments may either reinforce or challenge the current macro narrative. While price action will ultimately determine whether this scenario develops, the technical and fundamental backdrop currently suggests that a confirmed rejection from resistance could present a compelling bearish continuation opportunity.
EUR/JPY BUY SETUP | 15-Minute Technical Analysis📊 EUR/JPY BUY SETUP | 15-Minute Technical Analysis
🟢 Market Outlook: Bullish
Price is respecting an ascending trend line while holding above a strong demand zone around 186.300. The presence of buy-side liquidity near 186.250 adds confluence, suggesting buyers may remain in control as long as this area holds.
💰 Buy Entry: 186.360
🎯 Technical Targets:
✅ Target 1: 186.470
✅ Target 2: 186.570
✅ Target 3: 186.680
📌 Technical View:
- Strong trend line support
- Demand zone holding firm
- Buy-side liquidity below price
- Bullish continuation expected if key support remains intact
⚠️ Trading Psychology:
Trade the setup—not your emotions. Stay disciplined, respect your risk management, and let the market confirm your bias before adding to your position.
This analysis is based on technical price action and is for educational purposes only. Always use proper risk management.
EUR/JPY Sell Setup – Bearish Reversal🔴 EUR/JPY Sell Signal
Sell Zone: 183.850 – 184.270
Stop Loss: 184.800
🎯 Targets:
TP1: 182.000
TP2: 182.000
📉 EUR/JPY is approaching a potential resistance zone, presenting a possible swing selling opportunity. If price rejects the 183.850–184.270 zone and bearish momentum develops, the pair could move toward the 182.000 target.
Note: You provided the same level (182.000) for both TP1 and TP2, so I’ve kept it exactly as given.
Risk Disclaimer: Forex trading involves substantial risk. Always use proper risk management and never risk more than you can afford to lose.
EURJPY: Liquidity sweep & intervention risk analysis📊 EURJPY: Liquidity sweep & intervention risk analysis
🔥 What happened?
EURJPY made another sharp move lower after failing to hold above the 182.60-182.63 resistance zone. Price dropped below the short-term moving averages and is now trading near 181.94, close to the psychological 182.00 level.
Earlier, the pair already swept liquidity toward 181.33 and recovered. Now the market is testing whether that recovery was real — or just a temporary bounce before another move lower.
🧠 Why did this happen: three layers of analysis
1. Macro Trigger: Intervention Risk
The move is still mainly about the yen. JPY pairs remain sensitive to intervention-risk headlines and any signs that Japanese officials may push back against yen weakness.
When traders fear potential support for the yen, they reduce JPY shorts quickly. That creates fast downside moves in pairs like EURJPY, USDJPY and GBPJPY.
Key nuance : unless there is real intervention or a more hawkish BoJ signal, yen strength can be sharp but unstable.
2. Market Microstructure: liquidity sweep below 182.00
The previous drop toward 181.33 looked like a liquidity sweep. Price took stops below 182.00, then recovered.
But now EURJPY failed again near 182.60-182.63 and returned back below 182.30. This means buyers did not manage to turn the sweep into a strong continuation move.
The market is now testing the same zone again: 182.00 first, then 181.50-181.33.
3. Fundamental Background: the Yen is still weak
Despite the short-term JPY bounce, the broader fundamental picture has not fully changed. The BoJ has started policy normalization, but it has not delivered a clearly aggressive tightening cycle yet. The ECB-BoJ rate differential remains wide, and carry trade conditions still work against the yen.
However, intervention risk now makes JPY shorts more dangerous. Verbal warnings or official support can create sharp yen rallies, even if the longer-term fundamentals remain weak.
Conclusion : without stronger BoJ tightening or repeated direct intervention, the yen may struggle to hold strength for long. But in the short term, intervention risk can still trigger fast downside moves in EURJPY.
💡 Key takeaway
Price is now below EMA9 and EMA20, and testing the area around SMA50. RSI has dropped toward the lower zone, Stoch RSI is weak, and MACD has turned negative.
EURJPY already swept liquidity below 182.00, but buyers failed to sustain the recovery above 182.60. Now the pair is back near the danger zone. If 181.33 holds, the move still looks like a sweep. If 181.33 breaks, the market shifts from liquidity grab to real bearish continuation.
⚠️ Not financial advice.
EURJPY Pullback reversal, continued down-move to follow!This up trending move is basically the pullback which came after the huge bearish candles that we saw forming on 30 July - 3 Aug, which has broken below some of the most significant supports. This up-move is kind of topped out at the presence of 0.382 fib retracement level.
This up-move itself seems like loosing the flair and had also given a breakout below 182.098, immediate resistance is at 182.694. we are expecting a continued down form here and price is expected to form newer low than previous down swing.
could be a nice selling opportunity, but things we need to take great care of, is risk management and Strict Stoploss order should be placed early during entry, because of the sudden (BOJ) central bank of Japan intervention it's very risky.
you'll find similar structure on almost every JPY quoted currency pairs. Selling should only be preferred.
For Educational Purposes only, Not an Investment Advice, Always use strict Risk management measures.
Regards CrazyTrades247.
EURJPY: news flow leaning bearish — the net read
EURJPY did not get one story today, it got several, and they do not all point the same way. Weighed against each other — new against old, and tracking which ones have already faded:
− EUR/JPY Price Forecast: Falls to near 182.00 amid prevailing bearish bias
− British Pound consolidates vs Yen; bullish bias remains amid Japan's fiscal concerns
− Asia stocks slide as chip rout hits Korea, Japan (fading)
36 stories were weighed in this window; the 3 carrying the most weight are listed.
Net read: −− leaning bearish — solidly weighted.
What this is: a measure of which way the *news* is leaning right now — not a promise about price. A read being right and a read still being worth taking are two different things: once price has travelled a long way from where the read was published, it is stretched, and a lean that is stretched is a no-chase rather than an invitation.
Weight is not fixed either. A fresh headline lands, the balance tips, and the net read can flip inside an hour — that shift is the part worth watching, not the first print.
I will post an update under this idea once the market has had time to speak, either way.
(Informational only — not financial advice, not a signal.)