EUR/RON – Elliott Wave Perspective (Weekly Timeframe)
EUR/RON – Elliott Wave Perspective (Weekly Timeframe)
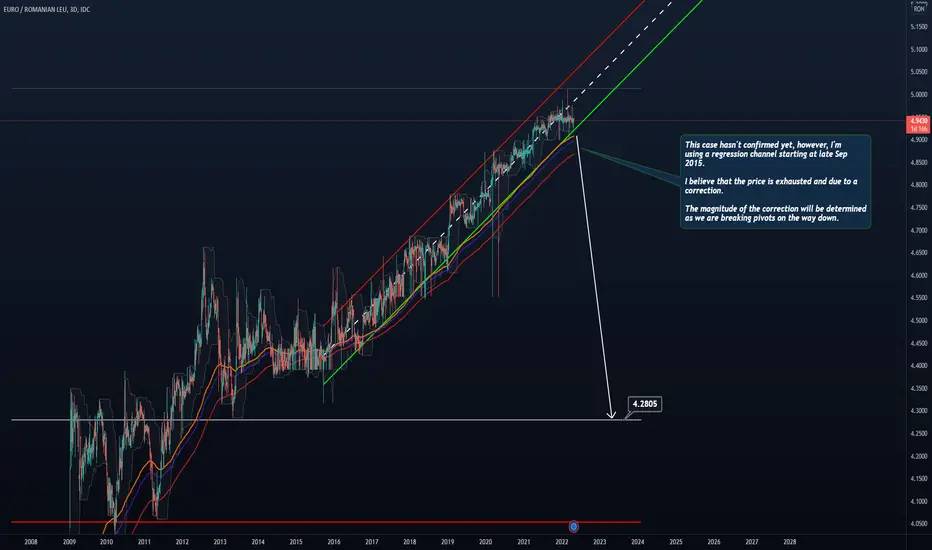
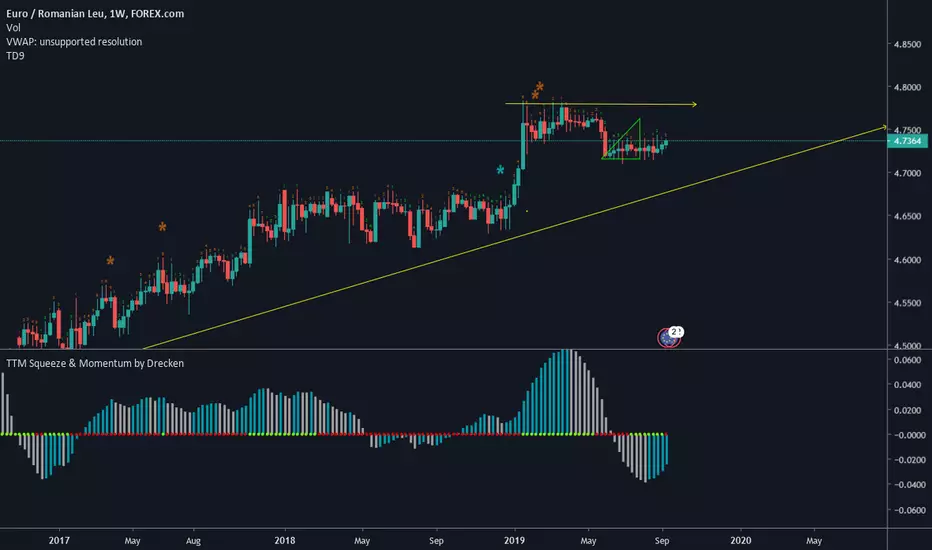
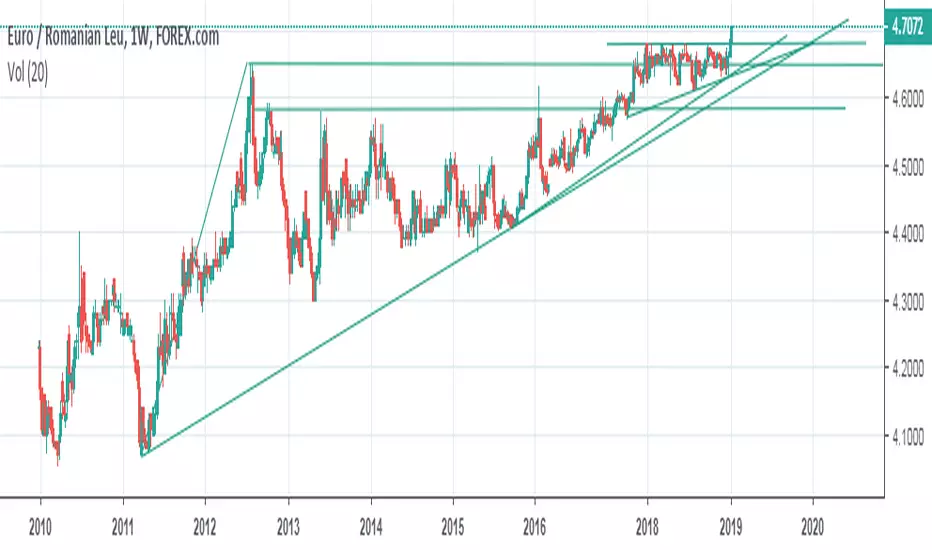
The long-term structure continues to respect a well-defined ascending channel, with price moving steadily between support and resistance boundaries.
From an Elliott Wave perspective, the market is developing a higher-degree wave III, with internal structure clearly unfolding.
Wave structure overview:
The initial phase shows a completed (a)/(I) structure, followed by a corrective phase.
The market then transitions into a new impulsive sequence forming wave I and II of a higher degree.
Currently, price is advancing within wave III, where subwaves (1), (2), (3), (4), and (5) are being formed.
Wave (5) has recently pushed into the upper boundary of the channel, suggesting a mature stage of this impulsive leg.
Current market position:
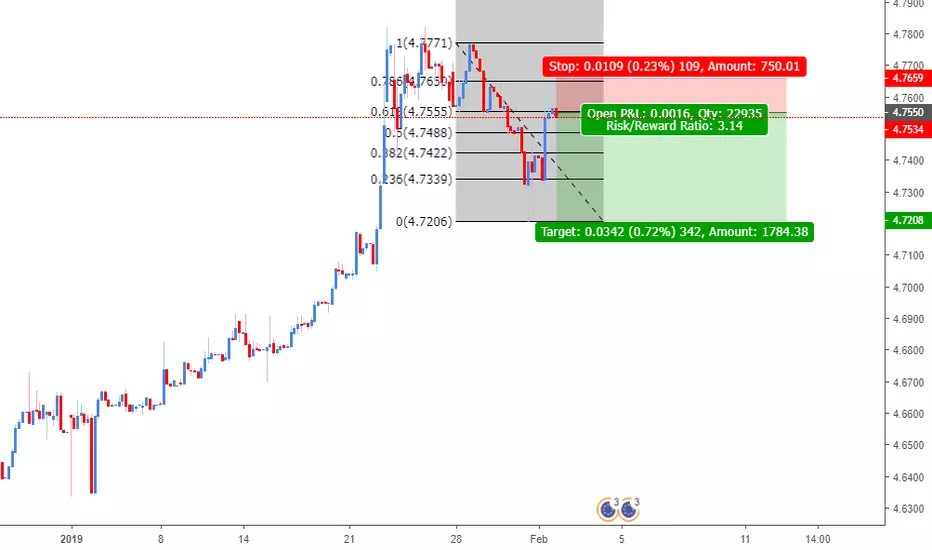
After the recent high, price is consolidating just below resistance, within a clearly defined horizontal zone.
This area acts as short-term support and indicates a pause after the impulsive move.
The internal structure of the consolidation shows overlapping price action, which is characteristic of a corrective phase.
Primary scenario:
The market is likely developing a short-term correction within the ongoing uptrend, potentially a wave (4) or a lower-degree consolidation before continuation.
As long as price holds above the rising channel support and the marked horizontal zone, the bullish structure remains valid.
Following this consolidation, a continuation higher is expected, completing wave III.
Projected target:
Wave III extension points towards the 5.50 – 5.55 area, aligned with the upper channel resistance and previous projection levels.
Key technical observations:
Trend remains clearly bullish on the higher timeframe.
Momentum has slowed after the recent push, indicating temporary exhaustion.
Price action has become corrective, not impulsive, in the short term.
Invalidation / risk scenario:
A break below the channel support and loss of the horizontal support zone would weaken the bullish outlook.
In that case, a deeper correction could unfold before any continuation.
Conclusion:
EUR/RON remains in a strong bullish trend, currently in a consolidation phase within wave III.
After this pause, the market is expected to continue higher toward the upper boundary of the channel.

 Long
Long