Huge Profit Potential Is Hidden in the FET Chart! (3D)This is an update to the previous analysis, which you can find in the related publications section.
A large Diametric pattern appears to be forming on the chart, and the price is currently trading in Wave E. Wave E is expected to extend further and become longer.
The primary buying zone is the green area. A buy-and-hold strategy from this zone could offer attractive returns for long-term holders.
A short-term upward move is expected first, followed by a decline into the green zone. Wave E is developing as a double combination, and the market is currently in the second part of this corrective structure.
The targets are marked on the chart. Consider taking partial profits at the first target.
If you have a coin or altcoin you want analyzed, first hit the like button and then comment its name so I can review it for you.
Do you also think FET is bullish?
In-depth trading ideas
๏ปฟFET at macro floor: base recovery toward $0.1660The Macro Picture ๐บ๏ธ
FET ground down from the $0.2888 macro ceiling all the way to the $0.1323 macro floor and has flattened onto it at $0.1324. The long, steady bleed has given way to a base right on support โ exhaustion rather than continuation.
The Setup โ๏ธ
The Accumulation Zone ๐ข
$0.1152โ0.1323 is where the selling has dried up. Macro Support has held on retest, with the $0.1152 Local Low as the deeper backstop โ this is the demand base a recovery would build from.
The Decision Point ๐ด
$0.2348 (Local High) is the structural gate far above. Before it, the $0.1660 measured-move target is the first objective โ reclaiming it proves buyers are stepping back in.
The Roadmap ๐ฃ๏ธ
Hold the $0.1323 floor โ recover toward $0.1660 as the first leg up. Invalidation is a clean daily close below $0.1152 โ that voids the accumulation thesis.
This is a textbook DCA Accumulation Zone setup: scale in across the $0.1323 floor band and let the base do the work.
#FET #FetchAI #ASI #crypto #trading #TA #3Commas #DCA
FET is preparing for a strong buying opportunity (1D)FET appears to be forming either a Diametric or a Symmetrical pattern. If so, Wave G could complete within the green zone, which is where we'll be looking for buy/long opportunities.
If the pattern turns out to be Symmetrical, we expect a rejection from the red zone.
However, if it develops as a Diametric pattern, FET could remain bullish as long as it establishes acceptance above the red zone.
Let's see how the market unfolds.
If you have a coin or altcoin you want analyzed, first hit the like button and then comment its name so I can review it for you.
Do you also think FET is bullish?
FET/USDT 4H Technical Analysis โ Breakout SetupExample TradingView Idea Description
Title:
FET/USDT 4H โ Breakout Watch with Fibonacci & CoinGlass Liquidity
Description:
FET/USDT is approaching a key decision zone.
Technical Confluence:
Descending trendline resistance
Fibonacci 0.236 at 0.1581
Major CoinGlass liquidity cluster at 0.160โ0.161
Open Interest has increased by approximately 2.7%, indicating fresh positioning.
Bullish Scenario
4H candle closes above 0.1581
Strong volume confirmation
Targets:
0.1593
0.1603
0.1615
0.1645
0.1697
Bearish Scenario
Breakdown below 0.1560
Targets:
0.1550
0.1540
0.1510
This analysis combines price action, Fibonacci retracement, trendline structure, CoinGlass liquidation heatmap, and Open Interest for confirmation.
This is an educational analysis, not financial advice.
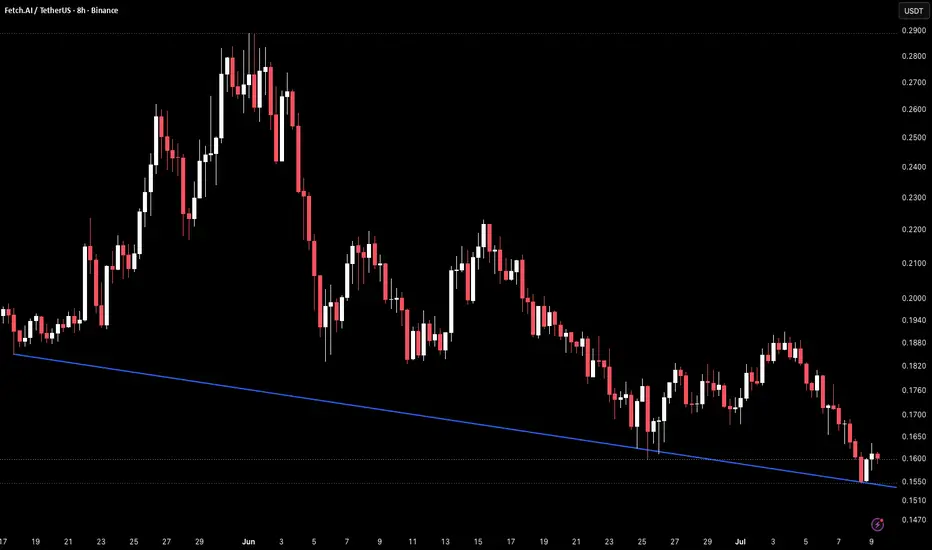
FET 8H โ Breakdown Below Trendline Into New LowsFET on the 8H timeframe is currently trading around 0.1954 after breaking below the descending trendline support near 0.1610โ0.1630 in early July and pushing into fresh lows near 0.1525, with price now attempting a minor recovery back toward the broken trendline from below.
The chart shows a descending trendline originating from the mid-May high near 0.1880, connecting through the June 25 low near 0.1610 and extending across the entire visible structure as the key dynamic support floor. Price respected this trendline from below across June, with the June 25 touch and the late June consolidation all holding above it before the structure finally gave way in early July. The trendline break came without a meaningful bounce, with price accelerating directly through 0.1610โ0.1630 and into a low near 0.1525โ0.1530 before recovering slightly. A horizontal reference level near 0.1610โ0.1630 has now flipped from support to resistance and sits just above current price as the first meaningful ceiling on any recovery attempt. The pattern of lower highs and lower lows has been unbroken since the late May spike high near 0.2900, with each recovery attempt producing a shorter bounce than the prior one.
Price is now sitting just below the broken trendline near 0.1610โ0.1630 after the breakdown low, with no visible horizontal support below 0.1525 on this chart.
Key Levels To Watch
โ 0.2800โ0.2900 โ May spike high, major resistance above
โ 0.2100โ0.2200 โ Prior recovery high, resistance
โ 0.1880โ0.1900 โ Spike base, resistance
โ 0.1700โ0.1760 โ Prior consolidation zone, resistance
โ 0.1610โ0.1630 โ Broken trendline support, now resistance
โ 0.1525โ0.1530 โ Breakdown low, immediate support
โ Below 0.1470 โ Extended breakdown territory, no clear support
A reclaim of the broken trendline near 0.1610โ0.1630 on a confirmed 8H close would suggest the breakdown was a wick rather than structural, reopening a move toward 0.1700โ0.1760 and potentially 0.1880โ0.1900 on a more sustained recovery.
A rejection at the broken trendline near 0.1610โ0.1630 and a return below the breakdown low near 0.1525โ0.1530 would confirm the breakdown as structural, with no clear horizontal support beneath and downside toward 0.1470 and below.
Breakdown confirmed below trendline, recovery attempt now pressing into former support as resistance. Reclaim 0.1610โ0.1630 โ breakdown invalidated, eyes on 0.1700โ0.1760. Reject here โ breakdown confirmed, downside toward 0.1470 and below. Bias bearish below broken trendline. Shift only on confirmed reclaim of 0.1610โ0.1630.
FET at macro floor: liquidity sweep before the next leg downThe Macro Picture ๐บ๏ธ
FET has been carving a descending structure since the $0.29 structural peak in early June, printing a clean sequence of lower highs and lower lows. Every rally has been sold into โ this is a market defined by supply, where each bounce becomes fuel for the next flush. Price now sits pinned at $0.162, hovering directly above the $0.15 macro floor. This is the kind of compression that desperately needs to be tested: the longer price grinds against support, the more liquidity pools just beneath it, and that pocket rarely goes untouched.
The Setup โ๏ธ
The Ceiling: The $0.19 shelf is the line in the sand. This former support has flipped into resistance, and the bears are defending it aggressively โ as marked by the red projection, every push toward $0.19 has been rejected.
The Reaction: The zone between $0.19 and $0.24 is a thick supply block. Price would need to reclaim this entire band to shift the structure, and momentum โ with RSI grinding below the midline near 38 โ offers no support for that case yet.
The Trigger: A liquidity sweep below $0.155 would clear out over-leveraged longs stacked at the lows and open the path of least resistance toward the $0.15 macro support.
The Roadmap: Primary target sits at $0.15 โ the green roadmap points there as the natural draw on liquidity below the range. Invalidation: a sustained 4H close back above $0.19 would invalidate this bearish thesis and signal a structural reset in favor of the bulls.
More setups in profile.
#FET #CRYPTO #FetchAI #Altcoins #TechnicalAnalysis
FET 8H โ Descending Trendline Pressing Into Horizontal SupportFET on the 8H timeframe is currently trading around 0.1969 after a sustained decline from the late May high near 0.2900, with price now compressing between a descending trendline from above and a horizontal support level near 0.1550โ0.1600 that has held as a floor through the entire post-spike structure.
The chart shows price spiking from the mid-May range near 0.1880โ0.1900 up to a high near 0.2900 in late May before sellers took over and pushed price back through the spike base and into a steady grind lower. A descending trendline connects the late May high through the mid-June recovery high near 0.2200 and the late June high near 0.1880, sloping down into the 0.1650โ0.1700 area currently. The horizontal level near 0.1550โ0.1600 has acted as a consistent floor since the spike, catching the June 25 low near 0.1610 and again the early July low near 0.1550 before price recovered briefly each time. The descending trendline has capped every recovery attempt without exception, leaving price in a progressively tighter range between the two levels.
Price is now sitting just above the 0.1550โ0.1600 horizontal support with the descending trendline overhead near 0.1650โ0.1700, leaving almost no room before one of the two levels gives way.
Key Levels To Watch
โ 0.2800โ0.2900 โ May spike high, major resistance above
โ 0.2100โ0.2200 โ Prior recovery high, resistance
โ 0.1880โ0.1900 โ Spike base and prior support, now resistance
โ 0.1650โ0.1700 โ Descending trendline, current overhead resistance (dynamic)
โ 0.1550โ0.1600 โ Horizontal support, current test
โ 0.1470โ0.1510 โ Next support below on breakdown
โ Below 0.1400 โ Extended breakdown territory
A hold at the 0.1550โ0.1600 horizontal support and a break above the descending trendline near 0.1650โ0.1700 would signal a structural shift, opening a recovery toward 0.1880โ0.1900 and potentially 0.2100โ0.2200 on continuation.
A confirmed 8H close below the 0.1550 horizontal support would remove the floor that has held since the May spike, with the descending trendline continuing to suppress any recovery and exposing price to a move toward 0.1470โ0.1510 and below.
Price compressed between descending trendline and horizontal support, resolution imminent. Hold 0.1550โ0.1600 and break trendline โ recovery open toward 0.1880โ0.1900. Lose 0.1550 โ floor gone, downside toward 0.1470โ0.1510. Bias bearish below descending trendline. Shift only on confirmed trendline break with reclaim of 0.1650โ0.1700.
#FETUSDT bullish momentum#FET
The price is moving within a descending channel on the 1-hour timeframe and has reached the lower boundary. It is now poised for a bounce and is expected to retest this boundary.
The Relative Strength Index (RSI) indicates a downward trend, which is likely to continue given the overbought conditions.
There is a key support zone in green at 0.1570. The price has bounced off this zone several times, making it a strong support level.
The price is trending towards the 100-period moving average, which we are approaching. This trend supports an upward move.
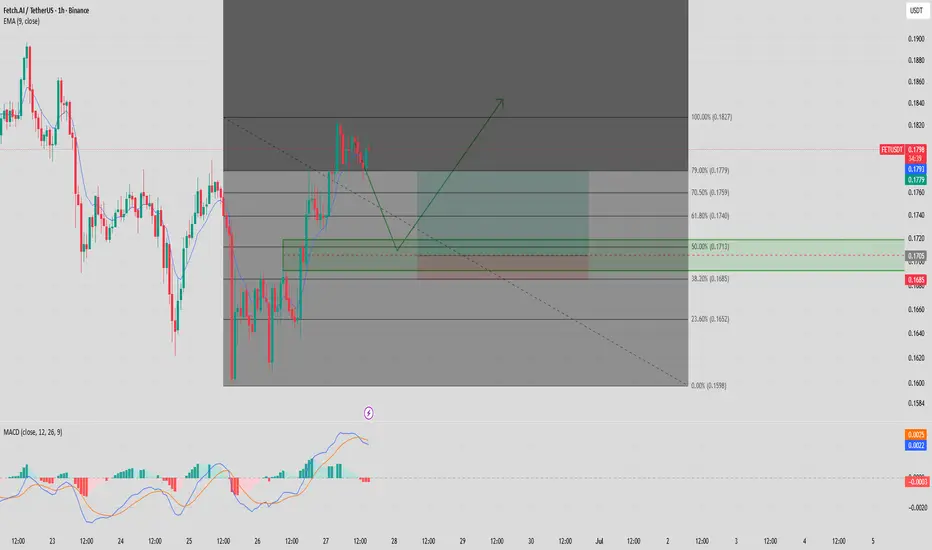
Entry Price: 0.1675
Target 1: 0.1697
Target 2: 0.1734
Target 3: 0.17820
Stop Loss: At the resistance zone in green
Remember this simple rule: Money management.
Any questions? Please leave a comment.
Thank you.
FET: Classic Price Compression PatternFET: Classic Price Compression Pattern โ Historical Replay Opportunity with Long-Term Growth Target
FET is flashing highly remarkable technical signals on the higher timeframe as it enters a decisive phase. After officially breaking out of a multi-month long downtrend, the chart is currently moving steadily inside a very tight symmetrical triangle compression pattern, characterized by lower highs and higher lows. This specific consolidation state indicates that the market is accumulating intense momentum before triggering the next massive breakout wave.
Looking back at the historical data displayed on chart , we have witnessed three historical macro rallies from FET following prolonged sideways consolidation phases. Notably, the momentum of each subsequent wave has always been exponentially stronger than the previous one. Currently, the price action is replicating these past cycles step by step. If this compression pattern breaks out successfully, the long-term expected target could fully reach toward the $10 zone.
However, in risk management, patience remains the ultimate deciding factor. Instead of executing trades prematurely, the smartest behavior right now is to wait for a clear confirmation signal from engulfing candles, solid structural support from the MA100 moving average line, and a definitive breakout trend before making any final decisions.
Disclaimer: This is not investment advice, DYOR.
$FET is trading around $0.1790, and most traders are ignoring...BINANCE:FETUSDT is trading around $0.1790, and most traders are ignoring the strongest demand zone on the chart.
That's exactly where the best risk/reward often appears.
๐ฐ 24H Context: No major bullish catalyst has emerged in the last 24 hours. The AI-token sector remains relatively quiet, meaning price action is the primary signal while traders watch the upcoming FET token unlock.
Bias: ๐ข Bullish โ Price is pulling back into a clearly defined demand/order block after an impulsive breakout.
๐ Entry: $0.1718โ$0.1693
๐ SL: $0.1688 (-1.75%)
๐ฏ TP1: $0.1800 (+4.77% | 2.7:1 R:R)
๐ฏ TP2: $0.1868 (+8.73% | 5.0:1 R:R)
Watching how buyers respond here. If this demand zone holds, patience beats chasing.
Most traders freeze at demand zones... don't be one of them.
What's your target for BINANCE:FETUSDT ? ๐
#FET #CryptoTrading #PriceAction #Altcoins #AI
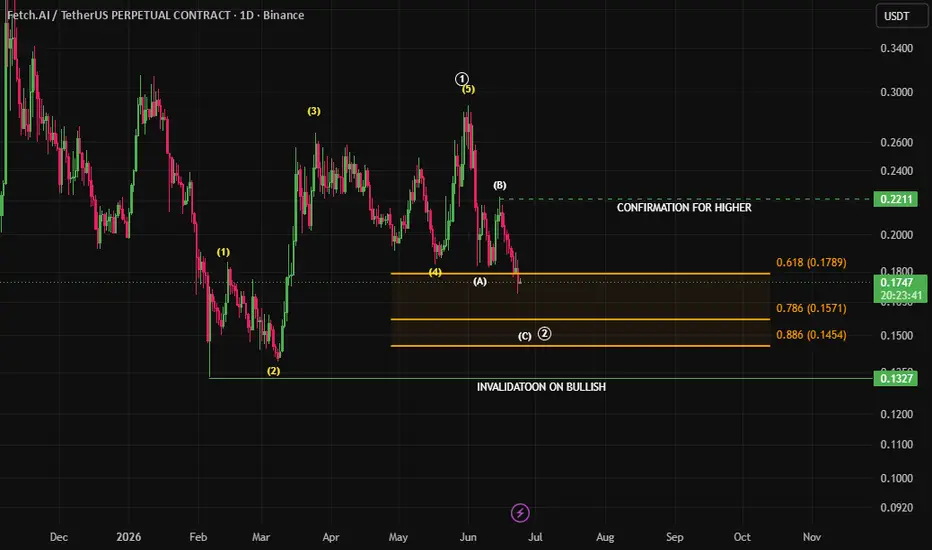
FET/USDT Elliott Wave Update (1D Timeframe)๐ FET/USDT Elliott Wave Update (1D Timeframe)
๐ Market Structure Overview
The current Elliott Wave count suggests that Fetch.ai (Fetch.ai) (FET) is still correcting the larger impulsive advance that ended near the recent swing high around $0.30.
The structure appears to be unfolding as a larger ABC correction, with Wave (A) already completed and Wave (B) likely having topped. The market now seems to be developing the final leg lower in Wave (C).
โโโโโโโโโโโโโโ
๐ Preferred Elliott Wave Scenario
From the chart:
๐น A completed five-wave advance culminated near the June high, marking the end of a larger impulsive sequence.
๐น The decline that followed is counted as Wave (A).
๐น The subsequent rebound formed Wave (B), which failed to reclaim the major resistance zone and showed corrective characteristics.
๐น Price is currently testing the Wave (A) low, suggesting that Wave (C) may now be underway.
๐ As long as the market remains below the confirmation level, the correction remains the preferred scenario.
โโโโโโโโโโโโโโ
๐ฏ Key Support Zone
The chart highlights a major Fibonacci support cluster:
๐ 0.786 Retracement: $0.157
๐ 0.886 Retracement: $0.145
This area represents the most probable termination zone for Wave (C) and the completion of the entire corrective structure.
๐ก In Elliott Wave analysis, Wave (C) commonly terminates between the 0.786 and 0.886 retracement levels during deep corrections.
โโโโโโโโโโโโโโ
๐ Bullish Confirmation
For the bullish scenario to gain credibility, FET needs to reclaim:
๐ $0.211
A sustained break and close above this level would indicate that buyers are regaining control and that the correction may already be complete.
Until then, rallies are treated as corrective bounces within the broader pullback.
โโโโโโโโโโโโโโ
โ Invalidation Level
๐ด $0.137
A decisive breakdown below this level would invalidate the bullish recovery outlook and suggest a much larger bearish structure is developing.
โโโโโโโโโโโโโโ
โ ๏ธ What To Watch
โ
Strong buying reactions between $0.157โ$0.145.
โ
Bullish divergence on momentum indicators near support.
โ
A breakout above $0.211 to confirm trend reversal.
โ Failure to hold the Fibonacci support zone would increase downside risk.
โโโโโโโโโโโโโโ
๐ Summary
The preferred Elliott Wave count suggests that FET is completing a Wave (C) correction, with the ideal support zone located between $0.157 and $0.145.
๐ฏ This region may offer the foundation for the next major impulsive advance if buyers step in.
๐ A confirmed break above $0.211 would be the first signal that the correction has ended and that a new bullish phase is beginning.
โ ๏ธ Until confirmation arrives, caution remains warranted as the market continues to trade within a corrective structure.
#FET #FetchAI #ASI #ElliottWave #Crypto #Trading ๐๐ฅ๐
FET/USDT Long entry approaching on the daily.FET entering long entry position on the daily. After charting FET draw down from 2021 cycle high, it was 85 days from exiting its descending triangle pattern until it bottomed out (currently we are at 129 days) This was 6 weeks before Bitcoin bottomed, unlike most alt coins which bottomed with Bitcoin. The long term trend line has a bottom price of $0.13 with a short term bottom projection of $0.141. The green vertical line indicates 6 weeks before an estimated Bitcoin bottom. I suspect the next leg down on Bitcoin will line up with FET making its second and final bottom with a nice long term entry position in the following weeks. Projected cycle highs indicate a possible $5.50-$6.50 by end of 2027.
FET: Historical Cycle Repetition ScenarioFET: Historical Cycle Repetition Scenario โ A Disciplined Strategy Awaiting the Next Primary Breakout Expansion
FET is carving out a highly textbook macro accumulation structure, unlocking sharp strategic insights based on the cyclical symmetry of historical capital flows. Looking back at historical data records, this asset successfully engineered 3 massive upward expansion waves, each emerging right after an extensive sideways consolidation phase. The primary cycle rule clearly validates that each consecutive breakout delivers a substantially higher magnitude of returns compared to its predecessor, marking these volatility compression zones as ideal foundations to front-run institutional capital.
Observing the weekly visual chart, the immediate price action has already registered highly encouraging structural pivot signs. Price candles have decisively escaped the descending resistance line of the primary multi-month triangle pattern, while firmly defending the rigid support floor around 0.1 USD. However, instead of launching into an immediate vertical expansion, FET is currently coiling inside a smaller secondary triangle structure to absorb any remaining circulating supply.
From a professional standpoint, this minor secondary compression is an essential and healthy footprint for the bulls. The immutable law of financial markets demonstrates that the longer an asset remains locked within an accumulation base, the more explosive the resulting breakout momentum will be. The disciplined playbook now is to maintain strict patience on the sidelines, waiting for a definitive surge in active buying volume above the minor triangle's ceiling to safely trigger long-term trend-following buy (Long) entries.
this is not investment advice, DYOR
FET USDT SHORT SIGNALFET/USDT โ Trade Setup (SHORT)
๐ Position Type: SHORT
๐ Timeframe: 15M
๐ Market: Futures
๐ฐ Entry Zone:
0.1850
๐ Stop-Loss:
0.1912
๐ฏ Take-Profit Targets:
โข TP1:ย 0.1806
โข TP2:ย 0.1774
โข TP3:ย 0.1742
โข TP4:ย 0.1701
TP5:
โ๏ธ Leverage:
5โ10
โ ๏ธ After reaching TP1, move Stop-Loss to Entry Price.
๐ Risk Management:
Risk only 1โ2% of your capital per trade.
Always confirm the setup on your chart before entry
FETusdt Near Key Support After Wedge FailureFET has broken down from its rising wedge structure and is now approaching a key local support zone around $0.14โ$0.17. While the current price action suggests the formation of a potential bearish continuation pattern, confirmation remains absent until support is decisively lost. A successful defense of this zone could trigger a relief rally toward the $1.13 supply area, but failure to hold support would expose the high-probability demand zone around $0.057, increasing the risk of a deeper correction and the formation of a new lower low.
FET Holding Strong Above $0.1840 โ $0.22 Next, $0.32 PossibleNYSE:FET is looking strong at the moment. As long as it continues to hold the $0.1840 support level, I see a smooth move toward $0.22 in the near term.
If bullish momentum continues to build and buyers remain in control, then $0.32 is not out of reach either.
Key level to watch: $0.1840
Not financial advice. Always manage your risk and do your own research.
$FET 4H AnalysisNYSE:FET still looks bullish from a trend perspective. ๐
Price is currently trading inside a strong demand zone, which also aligns with a Daily Bullish OB and 4H Bullish OB. ๐
Both internal and external market structure remain bullish for now. ๐ฏ
As long as CRYPTOCAP:BTC consolidate Iโm expecting a potential move higher from this area. ๐
Follow @HamzaTheInsider for more market insights. ๐
FET appears to be forming a triangle pattern (4H)After a sharp decline in the form of Wave A, FET now appears to be consolidating within a neutral range.
It seems to be forming either a triangle pattern or a more complex corrective structure. Our trading setup is to enter a buy/long position if the price reaches the green zone, aiming to ride Wave E of this triangle to the upside.
The targets for Wave E : 0.1993$ _ 0.2063$ _ 0.2125$
Enter the position using a DCA strategy within the entry zone.
A daily candle close below the invalidation level will invalidate this analysis.
If you have a symbol you want analyzed, first hit the like button and then comment its name so I can review it for you.
Do you also think FET is bearish?
#FETUSDT bullish momentum#FET
The price is moving within a descending channel on the 1-hour timeframe and has reached the lower boundary. It is now poised for a bounce and is expected to retest this boundary.
The Relative Strength Index (RSI) indicates a downward trend, which is likely to continue given the overbought conditions.
There is a key support zone in green at 0.1580. The price has bounced off this zone several times, making it a strong support level.
The price is trending towards the 100-period moving average, which we are approaching. This trend supports an upward move.
Entry Price: 0.1900
Target 1: 0.1958
Target 2: 0.2074
Target 3: 0.2213
Stop Loss: At the resistance zone in green
Remember this simple rule: Money management.
Any questions? Please leave a comment.
Thank you.
Fetch-ai (FET) bullish continuation & higher high in the making For three months now, since March, FETUSDT has been moving sideways after recovering from a major bottom and higher low. This period of sideways is a true signal of a major bullish wave in the making. This is another strong bullish chart setup.
One of the most interesting features is to recognize how long it really takes for the market to produce astounding growth. While we expect things to happen right away, all of the time, the truth is that the last bullish cycle started only in November 2022, a long time ago.
Now we are in front a new bullish cycle and it takes so long for the bottom process to be completed, long enough so that impatient people quit trading and sell at low prices, long enough for us to plan, adapt and prepare. It is both good and bad.
Good if you have a peaceful mind and can accept the build-up process as an opportunity to make all the arrangements possible in anticipation of the bull market. Bad if you have anxieties, greed, over-leverage trading and so on.
The bear market bottom happened October 2025, eight months ago, the higher low a little over four months ago, and we are still looking at the bottom.
I always say that it can take anywhere between 8-10 months between each market phase. Eight months are already in, so the next two months can see the start of really strong bullish action. The next few weeks, within days.
On this present move that is being prepared we are aiming for two targets, $0.61 (PP: 200%) and $2.19 (PP: 980%). These can be easily hit in the coming months. Crypto is going up, make no mistake.
Thank you for reading.
Namaste.