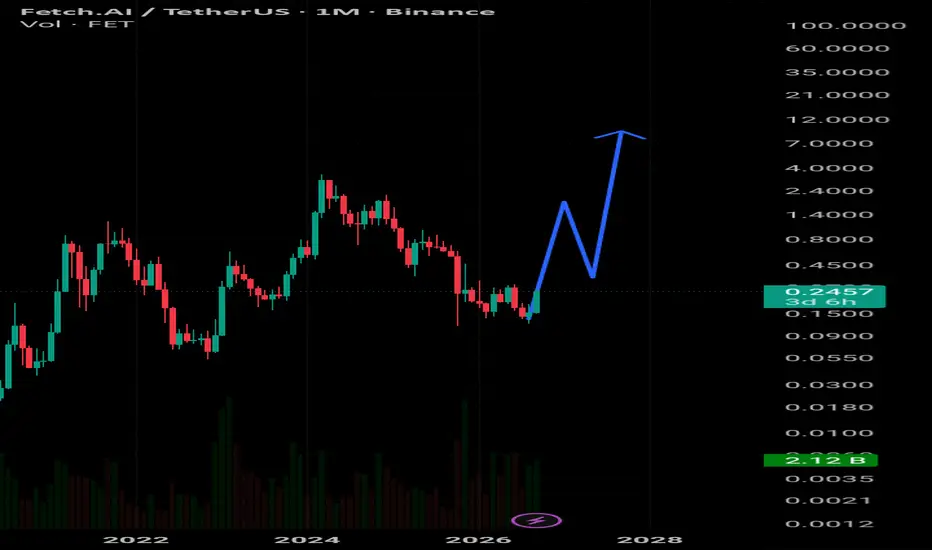
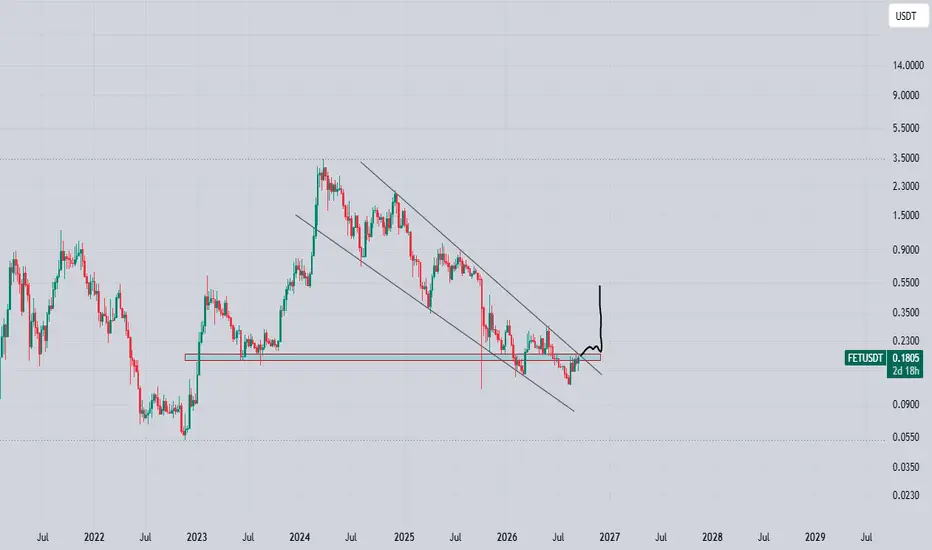
FetchAI, the downtrend ends (3,778% profits potential)The same bottom range from October 2025 is still active today. The same bottom range on FETUSDT has been active for more than 11 months. Almost an entire year trading at bottom prices.
A bear-market can lasts an entire year. A bull-market can last one year but also two, three, four years or more. A bottom process tends to last 3-6 months, not more.
When a bottom process becomes extended as the one seen here, on FETUSDT weekly, this can be interpreted as good news. Obviously, there is no downtr
In-depth trading ideas
FET bounces from longterm support line#FET / USDT
Two major bullish signs are worth noting:
1. Price is bouncing from the long-term trendline (blue line).
2. A breakout has occurred after an almost 2-year downtrend.
These are strong technical signs that could indicate the beginning of a new bullish trend.
Note: This analysis gives a mid-term/long-term directional bias, but it does not indicate the exact entry point. Price can still retrace, retest the breakout, or experience corrections along the way.
Trade with proper risk ma
FET to the moon - September 2026Already this idea has been written twice, click on the little triangles on the above chart (proof of publish point) or the links below. Same destination.
The Long in Aug 2023
Most were debating an entry of 27 cents at the time over a published 19 cents for a multi dollar forecast. No words. If that's you today... don't quit the day job. You're in the wrong business.
The Short in April 2024 - after 2000%
The comments.. let’s just say the folks that left remarks “no way”, bought more at
FETusdt Near Key Support After Wedge FailureFET has broken down from its rising wedge structure and is now approaching a key local support zone around $0.14–$0.17. While the current price action suggests the formation of a potential bearish continuation pattern, confirmation remains absent until support is decisively lost. A successful defense of this zone could trigger a relief rally toward the $1.13 supply area, but failure to hold support would expose the high-probability demand zone around $0.057, increasing the risk of a deeper corre
FET – Bulls Need One More BreakFET has just rejected the green support zone, showing that buyers are still active around this area.
However, price remains inside the falling red channel, so the bullish reversal is not confirmed yet.
For the bulls to take over, we need a clear break above the upper bound of the falling channel.
If that happens, bullish momentum could strengthen, opening the door for a move toward the red supply zone around $0.185.
📌 Support reacted. Now the channel is the confirmation.
⚠️ Disclaimer: Thi
Fetch.Ai (FET): my first idea $10 targetThis coin is set up to perform exceptionally well, the range structure is still perfectly intact.
I may not claim to be a crypto expert, but I’ve been tracking FET closely for a long time. It’s trading within a similar range as CRYPTOCAP:INJ and CRYPTOCAP:RENDER , both of which turned also into major runners back in 2022/2023. That kind of price behavior doesn’t go unnoticed.
On top of that, AI agents are set to become a major theme in the coming years—and FET is perfectly positioned for it
FET SELLERS MAY BE WALKING INTO A TRAPYello, Paradisers! are #FETUSDT sellers about to get trapped right before the market launches into its next aggressive move higher?
💎#FETUSDT has just delivered exactly the kind of short-term weakness that can easily scare impatient traders out of their positions. After losing the 1H support area around $0.196–$0.198, price aggressively flushed lower and reached the Low Volume Node around $0.192–$0.194.
💎This area is now extremely important. Notice what happened during the sell-off. Price push
FET USDTThere's not much good news in crypto right now. But FET is one of the few alt coins where a lot of positivity is around. DYOR of course. I have high hopes for FET in the next year or so. I think we finish 2026 close to $1
It's looks like the overall market may be coming back to life and this should be a big mover.
Good luck !
Descending Triangle Breakout⚠️Tether dominance(USDT.D) is currently sitting at a critical zone — so stay sharp and keep a close eye on it.
Structure
Instrument: FETUSDT · 1d · bullish
Pattern: Descending Triangle — Breakout above the upper rail suggests bullish continuation. Targets based on triangle height.
Trendline descending: 0.4665 → 0.2017 (Upper Rail)
Trendline ascending: 0.1334 → 0.2017 (Lower Rail)
Zone resistance: 0.462768–0.470232 (Resistance 1)
Zone resistance: 0.348787–0.354413 (Resistance 2)
Zone resistance:
Fet/usdt best setup 4hStrong Confluence at the Entry Zone 🟦
The $0.1843–$0.1864 entry zone is supported by multiple technical factors:
🔹 EMA 50 — dynamic support
🔹 Fibonacci Golden Zone — 61.8%–65% retracement
🔹 Price Gap / Imbalance — located around the entry area
🔹 Middle of the Ascending Channel — key equilibrium level
🔹 Resistance → Support Flip — previous resistance being retested as support
🟢 LONG ENTRY: $0.1858
🎯 TP1: $0.2045
🎯 TP2: $0.2089
🎯 TP3: $0.2155
🎯 TP4: $0.2215
🛑 Invalidation: $0.1755
5 technica
FETUSDT Forming Bullish MomentumFETUSDT is forming a clear bullish momentum pattern, a classic bullish reversal signal that often indicates an upcoming breakout. The price has been consolidating within a narrowing range, suggesting that selling pressure is weakening while buyers are beginning to regain control. With consistent volume confirming accumulation at lower levels, the setup hints at a potential bullish breakout soon. The projected move could lead to an impressive gain of around 50% to 60% once the price breaks above
FETUSDT Forming Bullish MomentumFETUSDT is forming a clear bullish Momentum pattern, a classic bullish reversal signal that often indicates an upcoming breakout. The price has been consolidating within a narrowing range, suggesting that selling pressure is weakening while buyers are beginning to regain control. With consistent volume confirming accumulation at lower levels, the setup hints at a potential bullish breakout soon. The projected move could lead to an impressive gain of around 50% to 60% once the price breaks above
FET Key Resistance Approaching — Breakout or Rejection?📊 Technical Analysis — Fetch.ai (FET/USDT)
⏳ Time Frame: 4D
📍 Current Price: around $0.1814
---
📉 Pattern: Descending Trendline
🔻 The chart shows a long-term Descending Trendline formed from the peak area around $2.1950, connecting a series of lower highs through the current period.
📌 As long as price continues to move below the descending trendline, the long-term structure remains under bearish pressure.
📉 However, price is currently approaching an important area around the Descending Tren
fet looks extremely bullish FET has been consolidating within this range for a significant period, and price is now approaching a critical breakout point. If FET successfully breaks above the horizontal resistance and the upper boundary of this long-term descending structure, it could trigger a strong bullish move. A confirmed breakout could potentially open the door for a 2x rally over the coming days and weeks, while the upside potential could be even greater if momentum and volume expand. The key confirmation will be a
FET USDT SHORT SIGNAL117. FET/USDT – Trade Setup (SHORT)
📈 Position Type: SHORT
🕒 Timeframe: 1H
📊 Market: Futures
💰 Entry Zone:
0.1622
0.1667
🛑 Stop-Loss:
0.1715
🎯 Take-Profit Targets:
• TP1: 0.1570
• TP2: 0.1518
• TP3: 0.1450
• TP4. 0.1370
Tp5.
⚙️ Leverage:
5*10
▫️ After TP1, move SL to Entry + 0.2%.
▪️ Exit Plan:
• 40% at TP1
• 20% at TP2
• 20% at TP3
20% at TP4
📌 Risk Management:
Risk only 1–2% of your capital per trade.
⚠️ Always check and confirm the setup on your chart before enteri
FETUSDT Bulls Are Taking Control, Is the Next Breakout Coming?Yello, Paradisers! could FETUSDT be preparing for its next bullish expansion before most traders notice what is happening?
💎FETUSDT is currently showing a bullish structure, supported by a P-shaped profile on the Fixed Range Volume Profile. At the same time, the price action on the 1H timeframe can also be interpreted as a potential bull flag, which strengthens the bullish scenario.
💎Looking at the higher timeframes, the weekly, daily, and 4H structures remain bullish. However, on the 1H time
FETUSDT - Trade Analysis (M15 Entry / H1 Bias)Bias: Bullish (H1 Alligator fanning up, price above lines, HH/HL structure confirmed)
M15 Story: After the strong bullish impulse to 0.1720, price is pulling back into the CWT Alligator zone on M15 (0.1693-0.1711 pink box). This is the buy zone. Wait for a bullish confirmation candle at this zone, Hammer, Bullish Engulfing, or Morning Star before entry.
Trade Setup:
Entry: Bullish candle confirmation at 0.1693-0.1709 zone
SL: Below 0.1633 (key structural support / black line)
TP: 0.1720 and b
FET / FETUSDT Bullish Setup | Futures Trade IdeaMARKET ANALYSIS
FET is currently reacting from a key technical area highlighted on the chart.
As long as the protected support zone remains intact, the bullish market structure remains valid and higher liquidity targets may continue to attract price action.
A breakdown below the invalidation level would weaken the current bullish scenario and require a reassessment of market conditions.
📍 Entry, Stop Loss and Take Profit levels are marked directly on the chart.
━━━━━━━━━━━━━━
⚠️ DISCLA
FET bullish signal for bear market bottom potentialWeekly bull divs on Fet from key oversold area. Liquidity sweep. Hold above horizontal line drawn = higher. MIGHT need one more low to accumulate but IF we see a push here above the horizontal level and HOLD above it on a retest the bottom is in. Time will tell. Either way, eventually holding above that level seems money to be made. Ree.
HTF trendline break.
FET/USDTFET as we can see in other times the bottom was 94-97% before it started its own parabolic move and 240-350 days considolation zone now we have to have patience before it starts its own parabolic move the hard target to reach is 1$ after that resistance is broken we will see it with new ATH'S considering the AI is gonna be the future in markets and stocks i really do believe FET will be one of the best coins
AVOID FUTURE!!
BUY ONLY SPOT AND WAIT