FILUSDT LONGInstructions:
Entry point: yellow
Stop loss: red
Take profit: green
👉Leverage x 5-10-20 for crypto
👉Leverage x 20-50-100 for commodities, stocks, indices, and forex
👉Margin 1-5% max.
Always practice risk and money management.
Invest a maximum of 5% on any trade or across all your trades.
Invest only what you can afford to lose, as no one is in control of the market.
👉Our analyses are primarily based on:
breakouts: two trend lines (ascending and descending) and a line indicating a horizontal breakout.
chart patterns: shoulders and head, triangle parttern, elliott impulse, etc etc.
We don't always have the time to track them at all times or to represent them visibly, given the numerous signals, the number of channels to manage, and especially because of the often rapid pace of market movements.
indicators: We associate at least two indicators with this technique.
👉Depending on the circumstances, we use specific indicators, often setting 3 or more take profit levels.
👉Indeed, there are good days in trading and also bad days. No one can promise to win every trade, and like all traders worldwide, we also experience stop-loss orders. However, we win more than we lose and remain positive.
👉You can close the position before or after the take profit orders indicated by the green lines if you are personally satisfied; the same applies to stop loss orders.
👉We must stay positive, clear-headed, and humble.
we cannot provide all instructions or all trades here on this channel.
Good luck to us all, and may God guide us. Amen.
In-depth trading ideas
FILUSDT Bear Flag Alert – Is Another Sell-Off Coming?📊🔎 Technical Analysis
💵 Coin: LSE:FIL #FILUSDT
⏳ Time Frame: 1D
📉 Pattern: Bear Flag 🚩
🎯 Bias: Bearish Continuation 🐻
---
📖🧠 Pattern Explanation
🚩 The chart is currently forming a Bear Flag, which is one of the most well-known bearish continuation patterns in technical analysis.
📉 The sharp decline at the beginning of June forms the flagpole, while the current upward-sloping consolidation channel represents the flag. This consolidation reflects a temporary pause where buyers attempt to push the price higher, but overall selling pressure remains dominant.
📍 At the moment, the price is trading near the lower boundary of the flag, making this a crucial support area.
⚠️ A decisive breakdown below this support would confirm the Bear Flag and could trigger another strong bearish continuation.
---
🐻📉 Bearish Scenario (Primary Outlook) – 75% Probability
🔴 The bearish scenario remains valid as long as the price stays inside the Bear Flag without breaking above the upper trendline.
✅ Bearish Confirmation:
🔻 Daily candle closes below the lower trendline. 📊 Selling volume increases during the breakdown. ❌ Previous support fails to hold.
🎯 Potential Outcome:
📉 If the Bear Flag confirms, price may continue its previous downtrend and target lower support zones.
⚠️ Historically, a confirmed Bear Flag often attracts additional selling momentum as the continuation pattern completes.
---
🐂📈 Bullish Scenario (Alternative Outlook) – 25% Probability
🟢 The bearish setup would begin to weaken if buyers successfully reclaim the upper resistance of the flag.
✅ Bullish Confirmation:
🚀 Strong daily close above the upper channel resistance. 📈 Buying volume continues to increase. 🔄 Successful retest of the breakout level as new support.
🎯 Potential Outcome:
📈 If this breakout occurs, FIL could invalidate the Bear Flag and attempt a recovery toward higher resistance levels.
---
🔑📍 Key Levels to Watch
🟡 Resistance Zone
⬆️ Upper boundary of the Bear Flag channel.
🔴 Critical Support
⬇️ Lower boundary of the Bear Flag (current support).
⚡ A breakdown below support confirms the bearish continuation.
🚀 A breakout above resistance invalidates the Bear Flag.
---
📌💡 Conclusion
🐻 The overall market structure still favors the bears, with the current price action resembling a textbook Bear Flag following a strong impulsive decline.
📉 Until buyers can break above the upper trendline with convincing buying volume, the probability continues to favor another bearish leg lower.
⚠️ Always wait for confirmation before entering a position and remember to manage your risk properly.
---
📢💬 What do you think?
🤔 Will FIL break down and continue the bearish trend, or will buyers invalidate the Bear Flag?
👇 Share your analysis in the comments!
---
#FILUSDT #FIL #BearFlag 🚩 #Crypto 🚀 #CryptoTrading 📊 #TechnicalAnalysis 📈 #TradingView #PriceAction #Bearish 🐻 #Altcoins #Binance #ChartAnalysis #CryptoSignals #SupportAndResistance #TrendAnalysis #Trading #CryptoMarket #Breakdown #MarketStructure
#FILUSDT Ready for a Breakout? Analysis of a Long Accumulatio#FIL
The price is moving within a descending channel on the 1-hour timeframe and has reached the lower boundary. It is now poised for a bounce and is expected to retest this boundary.
The Relative Strength Index (RSI) indicates a downward trend, which is likely to continue given the overbought conditions.
There is a key support zone in green at 0.6554, and the price has bounced off this zone several times, making it a strong support level.
The price is trending towards the 100-period moving average, which we are approaching. This trend supports an upward move.
Entry Price: 0.6941
Target 1: 0.7049
Target 2: 0.7193
Target 3: 0.7337
Stop Loss: At the resistance zone in green
Remember this simple rule: Money Management.
Any questions? Please leave a comment.
Thank you.
FIL: local squeeze with $0.95 destinationThe Macro Picture 🗺️
FIL unwound its May $1.33 spike through a sharp descent, and the selling bottomed at $0.68 in early June. Since then, price has settled into a broad $0.68–0.85 base — a volatility playground where the lows keep getting bought and the rallies faded back toward the middle. Price now sits at the equilibrium line near $0.77 with RSI balanced around 48. The floor has held through multiple tests, the structure has stabilized into a range, and the path of least resistance leans back toward the upper boundary from this coiled center.
The Setup ⚙️
The Buy Area: The $0.72–0.77 band has repeatedly absorbed pullbacks. Bulls are defending the equilibrium, and as marked on the chart, price is holding above the $0.72 local support with room to rotate higher.
The Ceiling: The $0.85 decision line caps the range. A clean reclaim flips the local structure bullish and opens the path toward the $0.95 macro resistance above.
The Range Play: The zone between $0.72 and $0.85 creates a structural playground for grid-based accumulation — staggered entries across the range capture the chop while the market decides its next macro leg.
The Roadmap: Primary target sits at $0.95 — the green roadmap points there as price works up from the equilibrium toward the range top. Invalidation: a clean daily close below $0.68 would invalidate this bullish thesis and signal a structural breakdown out of the range.
More setups in profile.
#FIL #CRYPTO #Filecoin #Altcoins #TechnicalAnalysis
FIL/USDT_30-Day Accumlation Box-Brekout Watch👋 Hey everyone! Hope you're all having a great day. Let's dive into today's analysis.
Quick intro: Filecoin (FIL) is a decentralized storage network — think of it as a peer-to-peer alternative to AWS or Google Cloud, where users pay FIL tokens to store data and storage providers earn FIL for offering space.
📊 On the 4H timeframe: After a strong downtrend, FIL entered an accumulation box, and we've now been trading inside this range for about 30 days.
🎯 The scenario:
- Break and retest above resistance (0.813) → Long setup
- Break and retest below support (0.708) → Short setup
⚠️ Volume has been gradually declining throughout this consolidation, which is typical before a range resolves — the eventual breakout (in whichever direction) could come with strong momentum.
📍 Key levels:
Resistance: 0.813 / 0.926
Support: 0.708
Hope this was useful for you! Would love to hear your thoughts in the comments 💬
🔔 Follow for daily setups like this.
FIL: bullish spike toward $0.80The Macro Picture 🗺️
FIL spent late June carving a base against the $0.70 macro floor, wicking into it twice and refusing to break — the kind of repeated defense that sparks powerful reversals once sellers exhaust. Price has now torn back to $0.76 with RSI driving up through its midline toward 60, the first genuine momentum shift in weeks. The path of least resistance has flipped upward, and the only thing standing between here and a full range reversal is the supply band overhead.
The Setup ⚙️
The Reaction: The $0.70 floor absorbed every test and price has rallied off it in a clean stack of higher lows. Buyers are firmly in control on this leg, and RSI confirming the push means the bounce carries real fuel rather than a dead-cat character.
The Ceiling: Price is now approaching the $0.78–$0.80 supply zone, the same band that capped the range through June. The $0.80 decision is the high-confluence level bulls need to reclaim to trap the shorts leaning against the range top and open the door to the macro ceiling.
The Roadmap: Primary target sits at $0.80 — the Local High / Decision and the ceiling of the range, where the green roadmap points, with the $0.835 macro peak as the extension once the buy stops above $0.80 trigger. Invalidation: a sustained 1D close below $0.72 would invalidate this bullish thesis and reopen the path back to the $0.70 macro floor.
FILUSD will touch 0.80$ ??LSE:FIL Update
FIL is still trading below the falling trendline. Buyers are showing up, but the breakout hasn't happened yet.We've seen a few bullish CHoCH/BOS signals on the lower timeframes, and price is holding above the short-term MAs. That's a good start, but I still want confirmation before looking for a swing long.
I'm watching for:
✅ 1H close above 0.746
✅ Strong breakout volume
✅ Successful retest of the breakout area
I'll cancel the swing long if:
❌ Price gets rejected from the trendline again
❌ The breakout fails and price closes back below 0.704
❌ The major support around 0.700-0.682 is lost
No need to chase. I'll wait for confirmation first. If FIL breaks this trendline cleanly, the next move could be much bigger.
FIL: Bearish spike toward $0.67The Macro Picture 🗺️
FIL has been carving a descending structure since the $1.32 structural peak in early May, a sequence of lower highs that demands deeper corrections before any continuation. Price has since been pinned inside a tightening range between the $0.83 local high and the $0.67 macro support, with momentum on the daily RSI fading below the midline. The path of least resistance keeps pointing toward the lower boundary, where the chart's last untested liquidity sits.
The Setup ⚙️
The Rejection: Price tagged the $0.83 local high in late June and was turned back cleanly — the upper edge of the green zone marked on the chart. Sellers are defending this boundary, and each failed push into it has handed momentum straight back to the downside.
The Floor: The $0.67 macro support is the last structural level holding price up, the same zone that sparked the mid-June bounce. With the daily RSI drifting below the midline and lower highs stacking, the bulls defending this floor are running thin on conviction.
The Accumulation Zone: A deeper flush toward $0.67 opens a textbook pocket for staggered, averaging-based entries — the kind of structure where a DCA bot quietly builds a position while over-leveraged longs are cleared out into macro support.
The Roadmap: Primary target sits at $0.67 — the macro floor and the chart's clearest liquidity pocket, where the white projection points and where late longs get swept before any reversal can form. Invalidation: a sustained 1D close above $0.83 would invalidate this bearish thesis and signal a structural reset back toward the $0.95 equilibrium.
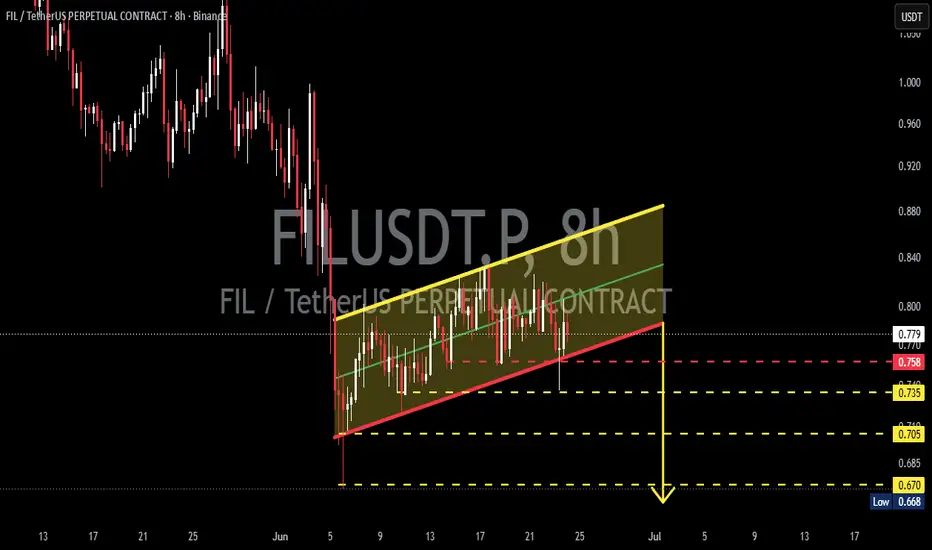
FILUSDT - Bear Flag, Breakdown or Major Reversal?The FILUSDT chart currently shows price action moving within a Bear Flag Pattern 🚩, a bearish continuation pattern that forms after a strong decline (flagpole 📉), followed by an upward-sloping consolidation channel 📈.
From a technical perspective, this pattern remains bearish 🐻 unless price can break above the upper channel resistance with strong volume confirmation 🔥.
At the moment, FIL is trading around 0.777 USDT 💰 and remains inside the flag structure 🚩, indicating that the market is approaching a critical decision point 🎯.
━━━━━━━━━━━━━━━━━━
🔍 Bear Flag Pattern Explanation 🚩
📉 What is a Bear Flag?
A Bear Flag is a bearish continuation pattern consisting of:
✅ A sharp previous decline (Flagpole) 📉
✅ An upward or sideways consolidation channel 📈
✅ A breakdown below support that triggers the continuation of the downtrend 🔻
On this chart:
🔸 The lower red trendline 🔴 acts as the primary channel support.
🔸 The upper yellow trendline 🟡 acts as the channel resistance.
🔸 The middle area 🟢 represents a distribution zone where buyers and sellers are battling for control ⚔️.
As long as price remains below the channel resistance ⛔, bearish pressure continues to dominate 🐻.
━━━━━━━━━━━━━━━━━━
🟢 Bullish Scenario 🚀
A bullish confirmation would require:
✅ A breakout above the Bear Flag resistance channel 🚀
✅ An 8H candle close above channel resistance 📈
✅ Strong volume expansion accompanying the breakout 🔥
🎯 Bullish Targets:
🎯 0.800 USDT
🎯 0.840 USDT
🎯 0.880 USDT
If the 0.880 USDT area is successfully reclaimed 💥, the Bear Flag structure may become invalid ❌, opening the door for a larger trend reversal 🚀📈.
━━━━━━━━━━━━━━━━━━
🔴 Bearish Scenario (Primary Outlook) 🐻
The dominant scenario remains a breakdown from the Bear Flag support channel 📉.
Bearish confirmation would occur if:
❌ Price breaks below the red support trendline 🔴
❌ An 8H candle closes below channel support 📉
❌ Selling volume increases during the breakdown 🔥
🎯 Bearish Targets:
🎯 0.758 USDT
🎯 0.735 USDT
🎯 0.705 USDT
🎯 0.670 USDT
🎯 0.668 USDT
These levels represent key support zones 🛡️ highlighted on the chart and could become downside targets if the Bear Flag pattern confirms successfully 📉.
━━━━━━━━━━━━━━━━━━
⚠️ Conclusion
📌 FILUSDT remains trapped within a Bear Flag Pattern 🚩, which is generally considered a bearish continuation structure 🐻.
📌 The ascending channel formed after the sharp decline appears more like a distribution phase rather than a true trend reversal.
📌 As long as price remains below channel resistance ⛔, the risk of a bearish breakdown remains elevated 📉.
📌 A breakout above resistance 🚀 would invalidate the bearish outlook and potentially trigger a move toward higher resistance zones 📈.
📌 Traders should closely monitor the channel support 👀, as it could become the catalyst for the next major move ⚡.
━━━━━━━━━━━━━━━━━━
#FILUSDT #FIL #Filecoin #Crypto 🚀 #Cryptocurrency #Trading 📊 #TechnicalAnalysis #TradingView #PriceAction #BearFlag 🚩 #BearishPattern 🐻 #ChartAnalysis #Altcoins #Binance #CryptoTrading #SupportAndResistance #Breakdown 📉 #TrendAnalysis #MarketStructure #SwingTrading
#FILUSDT Ready for a Breakout? Analysis of a Long Accumulatio#FIL
The price is moving within a descending channel on the 1-hour timeframe and has reached the lower boundary. It is now poised for a bounce and is expected to retest this boundary.
The Relative Strength Index (RSI) indicates a downward trend, which is likely to continue given the overbought conditions.
There is a key support zone in green at 0.616. The price has bounced off this zone several times, making it a strong support level.
The price is trending towards the 100-period moving average, which we are approaching. This trend supports an upward move.
Entry Price: 0.756
Target 1: 0.785
Target 2: 0.818
Target 3: 0.863
Stop Loss: At the resistance zone in green
Remember this simple rule: Money management.
Any questions? Please leave a comment.
Thank you.
FIL UNDER 1$ IS SUPER CHEAPLSE:FIL 5 YEARS of consolidation.
When the EXPANSION comes, it will outpace 90% of projects imo.
It will be VIOLENT.
Remember Filecoin ? It was once the 2nd largest crypto by FDV.
Now it's at ATL and is now down 99% from its peak. Absolutely brutal.
LSE:FIL will have a crazy run soon, Filecoin may go up again from the AI narrative. They truly are the big push for AI storage
Still under $1.00? Free
In my opinion, FIL at this level is super cheap
#FILUSDT Ready for a Breakout? Analysis of a Long Accumulatio#FIL
The price is moving within a descending channel on the 1-hour timeframe and has reached the lower boundary. It is now poised for a bounce and is expected to retest this boundary.
The Relative Strength Index (RSI) indicates a downward trend, which is likely to continue given the overbought conditions.
There is a key support zone in green at 0.830. The price has bounced off this zone several times, making it a strong support level.
The price is trending towards the 100-period moving average, which we are approaching. This trend supports an upward move.
Entry Price: 0.969
Target 1: 1.007
Target 2: 1.047
Target 3: 1.11
You can stop at the first and second targets and close the price, or continue towards the third target. Stop Loss: At the resistance zone in green.
Remember this simple rule: Money Management.
Any questions? Please leave a comment.
Thank you.
May 6, 2026 FIL. The time to go long has come.- Exchange: Bitget
- Instrument: BITGET:FILUSDT
- Timeframe: Month
- Trade type: Buy stop order
- Price: 1.020
- Take Profit: Open
- Stop Loss: 0.799 (-21.60 %)
Idea: Long on a breakout above last month's high — bullish momentum continuation.
Entry: Buy stop above last month’s high.
Stop-loss: Below the low of the same candle. A pullback below this level invalidates the trade.
Take Profit: Trailing stop following the lows of new month's candles.
This is not an individual investment recommendation.
FIL Is Waking Up Hi!
FIL/USDT is showing strong recovery signals after forming a clean double bottom pattern right above a major support zone and ascending trendline -> a structure that often marks the end of a bearish phase.
Buyers successfully defended the $0.90 support, while the breakout above short-term resistance and the 100 SMA confirms improving bullish momentum. The recent rebound suggests accumulation is building as price attempts to reclaim higher levels.
If bulls maintain control above the current zone, the next upside targets stand at $1.117, followed by the major resistance near $1.195. A breakout above these levels could trigger a stronger continuation rally in the coming sessions.
As long as FIL holds above trendline support, the bullish reversal scenario remains active and momentum may continue accelerating upward.
FILUSDT 1D#FIL is moving inside a symmetrical triangle pattern on the daily chart. It has bounced from a strong support cluster, including the triangle support, the daily SMA100, and the Ichimoku cloud, which is a very positive sign. We believe #FIL could soon break out above the triangle resistance and move toward the following targets:
🎯 $1.329
🎯 $1.495
🎯 $1.661
🎯 $1.897
🎯 $2.197
⚠️ Always use a tight stop-loss and maintain proper risk management.
FILUSDT — Wyckoff Accumulation Structure | Long-Term BIASAfter a prolonged bearish cycle and a complete markdown from the all-time high, FIL is showing characteristics of a possible Wyckoff accumulation structure forming near historical lows.
The market appears to be transitioning through a late-stage accumulation process where supply is gradually being absorbed after years of distribution and downtrend pressure.
Key Wyckoff events visible on the chart:
🔹 PS (Preliminary Support) — first signs of demand entering after aggressive selling pressure.
🔹 SC (Selling Climax) — capitulation event with extreme volatility and panic-driven selloff.
🔹 AR (Automatic Rally) — strong relief rally caused by temporary exhaustion of sellers.
🔹 ST (Secondary Test) — retest of the lower range confirming reduced bearish momentum.
🔹 UA (Upthrust After Accumulation) — possible future liquidity expansion above resistance zones before continuation or full trend confirmation.
🔹 STB — additional low-volume retest within the accumulation range.
🔹 Spring — potential liquidity sweep below ATL support designed to trap late sellers before reversal.
Current price action suggests compression near the lows, where volatility and downside expansion continue to decline — a typical environment before a larger directional move.
Important observations:
✅ Price is trading deeply discounted relative to previous cycle valuations.
✅ Bearish momentum has significantly weakened during recent lows.
✅ The structure resembles a classic Wyckoff accumulation with potential Phase C spring development.
✅ Failed continuation to the downside may trigger a transition into Phase D strength.
🎯 Main focus - monitoring for long opportunities once the market confirms strength through:
reclaim of the trading range,
higher highs / higher lows formation,
expansion in bullish volume,
breakout above key resistance levels,
SOS (Sign of Strength).
If accumulation confirms successfully, potential upside targets may include:
AR resistance reclaim,
previous range inefficiencies,
mid-range equilibrium levels,
higher timeframe imbalance zones near $8.5 and $11.8,
potential UA liquidity test above major resistance.
⚠️ This setup remains a structural hypothesis until confirmed by price action and demand expansion.
#FILUSDT Ready for a Breakout? Analysis of a Long Accumulatio#FIL
The price is moving within a descending channel on the hourly timeframe. It has reached the lower boundary and is trending towards a bounce. A retest of this boundary is expected.
The Relative Strength Index (RSI) indicates a downward trend, and this trend is likely to continue due to the overbought condition.
A key support zone (in green) has been found at 0.835. The price has bounced off this zone several times, making it a strong support level.
The price is trending towards the 100-period moving average, which we are approaching. This trend supports an upward move.
Entry Price: 0.927
Target 1: 0.952
Target 2: 0.977
Target 3: 1.000
You can close at the second target or wait for the third target to be reached. The choice is yours.
Stop Loss: At the resistance zone (in green).
Remember this simple rule: Money management.
Any questions? Please leave a comment.
Thank you.
fil looking bullish for day trading Filecoin has successfully held its crucial main support area and once again respected both the horizontal zone and the trendline support. From here, I believe FIL may start moving toward the descending trendline, which could provide a very strong trading opportunity.
The invalidation for this setup would be a closing below the horizontal support zone. As long as the support holds, I will be targeting a potential 15–20% move from this area.
#FILUSDT Ready for a Breakout? Analysis of a Long Accumulatio#FIL
The price is moving within a descending channel on the hourly timeframe. It has reached the lower boundary and is trending towards a bounce. A retest of this boundary is expected.
The Relative Strength Index (RSI) indicates a downward trend, and this trend is likely to continue due to the overbought condition.
A key support zone has been identified in green at 0.860. The price has bounced off this zone several times, making it a strong support level.
The price is trending towards the 100-period moving average, which we are approaching. This trend supports an upward move.
Entry Price: 1.05
First Target: 1.095
Second Target: 1.15
Third Target: 1.215
You can close at the second target or wait for the third target to be reached. The choice is yours.
Stop Loss: At the resistance zone in green.
Remember this simple rule: Money Management.
Any questions? Please leave a comment.
Thank you.
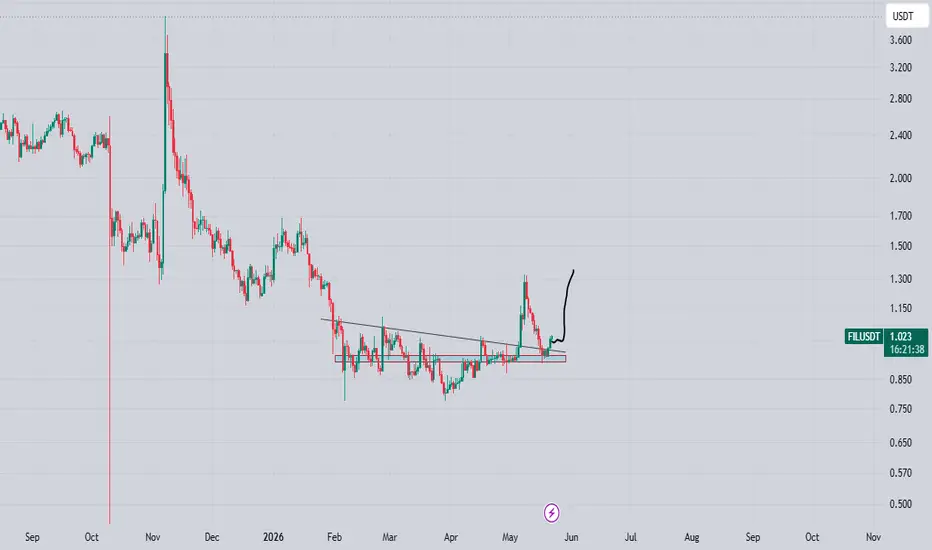
$FIL is creeping toward the $1.072 support zone that has held 5+BINANCE:FILUSDT has been grinding sideways between $1.07–$1.12 for almost a week — that's not weakness, that's accumulation.
Price spiked to $1.324 on May 9, got slapped back hard, and is now slowly drifting back down toward a support zone that has held multiple times since May 6.
The Trade Setup
🟢 Entry: $1.072 — sitting right on long-term horizontal support
🎯 Target 1: $1.189 — prior consolidation resistance (~11% gain)
🎯 Target 2: $1.322 — near the recent high (~23% gain)
🔴 Stop Loss: $1.022 — clean invalidation below all support
R: R here is exceptional. Risk ~5 cents to make ~25 cents. That's a 1:5 setup. 📐
Everyone who bought the May 9 breakout is now sitting at a loss near $1.30. That creates overhead sell pressure on any bounce. BUT — the $1.07 zone has absorbed selling pressure repeatedly.
Momentum Read: Price is slowly bleeding toward entry. No panic, no volume spike — just a clean, steady drift into the buy zone. When the bounce comes, trapped sellers above will add fuel to the move up.
Key Watch: Bullish close above $1.12 confirms the bounce is real. Below $1.022 invalidates everything.
Does BINANCE:FILUSDT respect this multi-touch support and rip to $1.32 — or does the zone finally break? Drop your call 👇