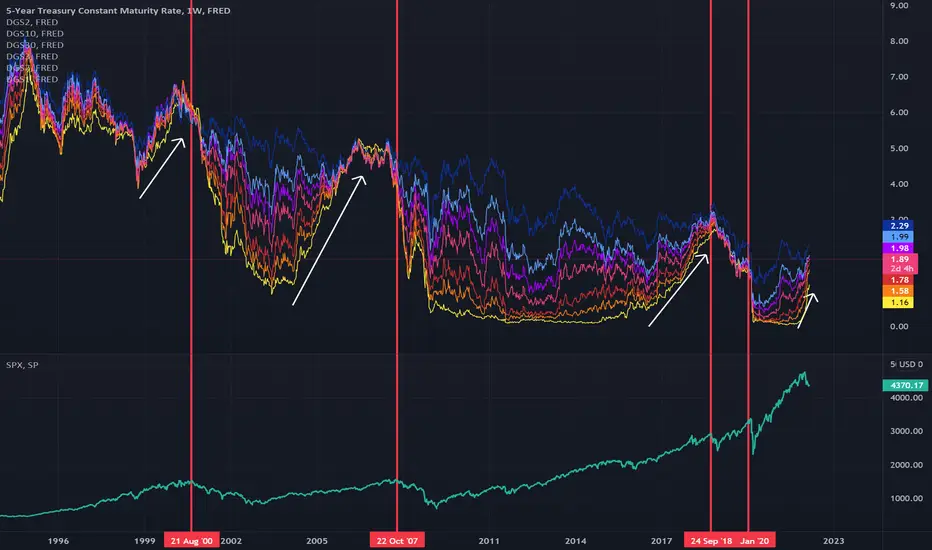
Market tops after yield compressionThis is a chart showing treasury yields, color coded by duration (yellow is the 1 year, dark blue is the 30 year), with the $SPX in the lower frame. Each red line shows a major market top and how they relate to yield compression followed by inversion. It looks to me like shorter term yields always rise vs longer term yields quite awhile before bear markets occur (in the past its been months or years before). It also looks like short term yields are rising abnormally quickly this time.
Yield
In-depth trading ideas
How will the market react to yields having nowhere left to drop?This is a chart showing a yield rainbow on a monthly basis, with a chart of $SPX in white, so the idea is to see how $SPX reacts to the movement of treasury yields over time. Treasury yields can't fall too far below the zero line, so we'll inevitably see a compression against the zero line take place and I assume yields will move sideways in a range for the foreseeable future given that any rise in yields will be capped by our ability to pay the interest on our national debt.
How will the mark
SPX broadening formation and some historySince 2018 the S&P500 is caught in a broadening formation, usually not a bullish sign. Yet the market keeps rising and is currently at the top of the formation.
As can be seen the Shiller P/E (teal lines) was initially decreasing a bit, but is now back to where it was three years ago and matches the S&P nicely in more recent times, indicating that recent price changes are mostly due to multiple expansion and not better earnings.
The time period with the best comparable broadening formation I c
$spy $tlt It's the steepening of Yld curve you should worry abouStocks are shown to top out when the TED spread starts to steepen, not invert. Right now it is showing signs of bottoming out. My bet is that if the fed starts cutting then this spread breaks out to the upside causing a top in equities.