Economy
Economic trends
Inflation map
GDP growth, YoY
CountryGDP GrowthNominal GDP
CountryGDP Growth / Nominal GDP
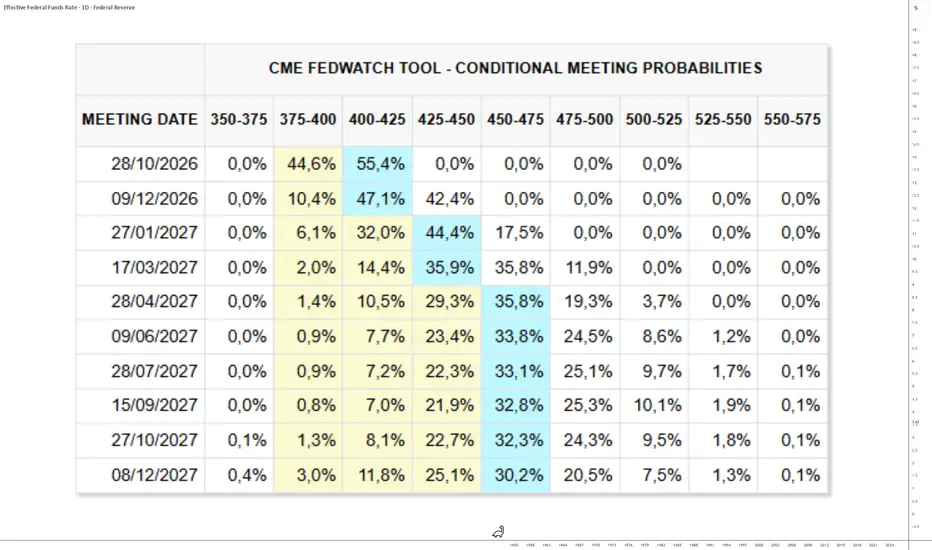
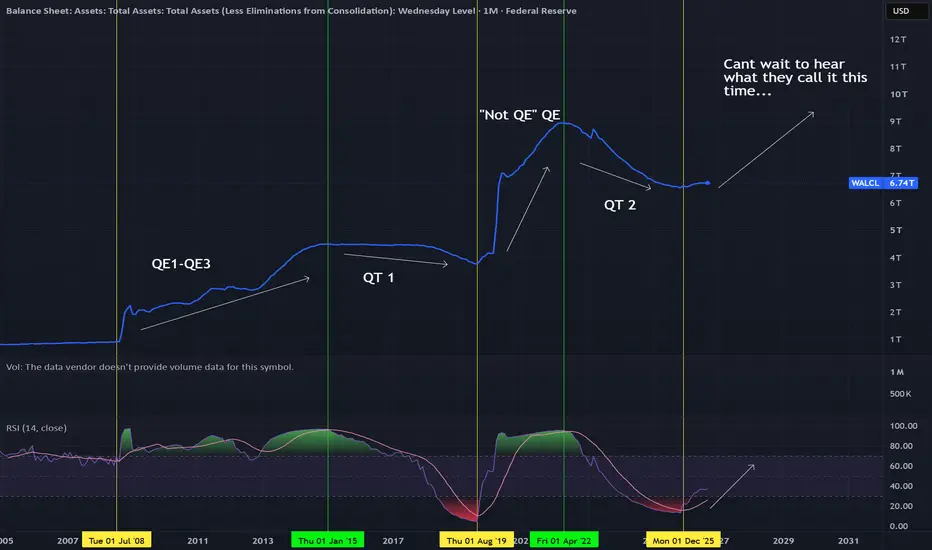
FED, one last rate hike? Not so sure.So it is done: Kevin Warsh’s Fed has raised the federal funds rate from 3.75% to 4%, unveiled its new monetary policy outlook and updated its macroeconomic projections. The Fed Chair once again reminded us that the central bank would remain “data dependent” and that it was still committed to support
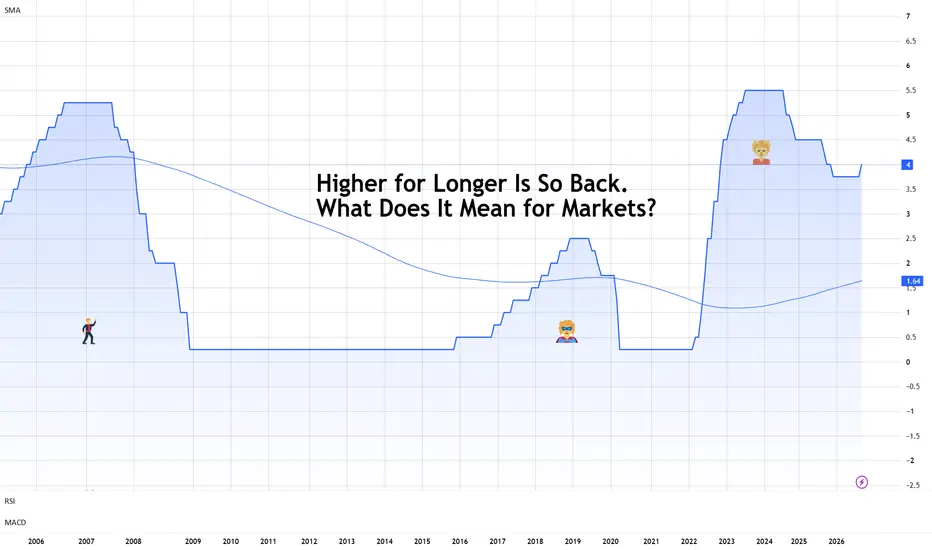
Higher for Longer Is So Back. What Does It Mean for Markets?The Fed hiked. That wasn't the surprise.
For the first time in more than three years, the Federal Reserve has raised interest rates ECONOMICS:USINTR .
The Fed lifted its benchmark rate by 25 basis points Wednesday to 3.75%-4.00%, a move markets had overwhelmingly expected.
The bigger messag
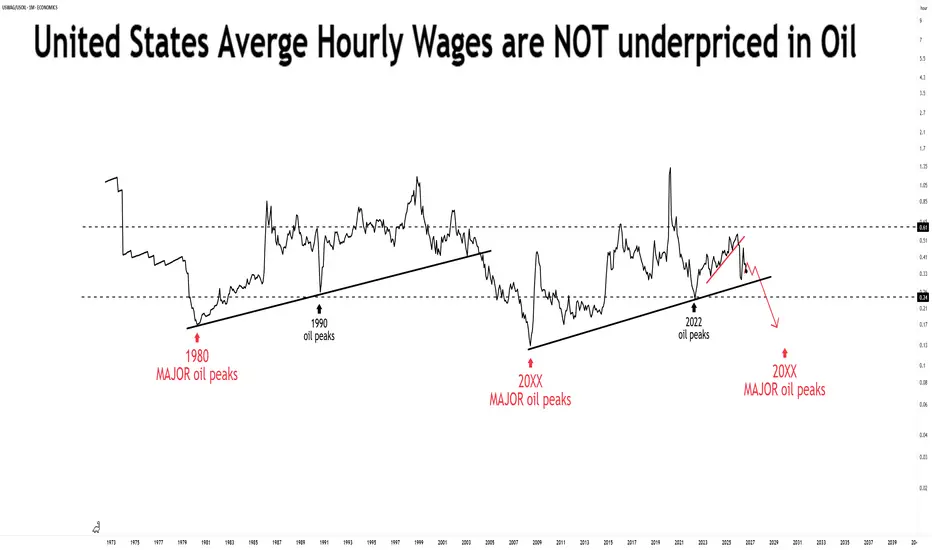
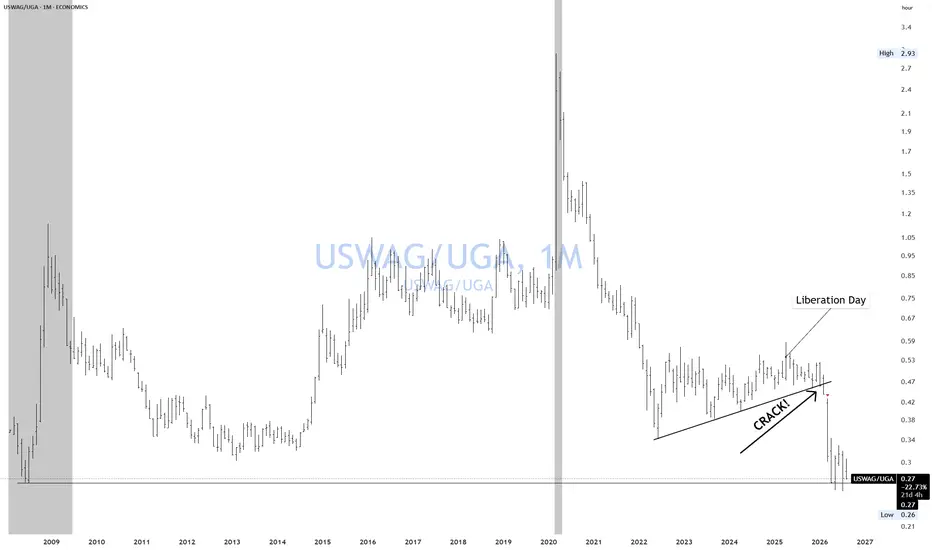
Hourly Wages to GasolineI hope everyone is enjoying life since Liberation Day in the golden era!
US wages to Gasoline have not been this low since the GFC.
While everyone is screaming inflation, the reality is this.
Monetary inflation = claims/ouput.
Oil supply shock is NOT monetary inflation. Here is why
You only hav
$USINTR - Fed Raises Rates by 25bps(Septmber/2026)ECONOMICS:USINTR 4%
September/2026 +0.25% / 25bps
source: Federal Reserve
-The Fed unanimously raised the federal funds rate by 25bps as expected,
marking the first rate hike since 2023 as inflation remains elevated.
Updated projections also showed that a strong majority of officials th
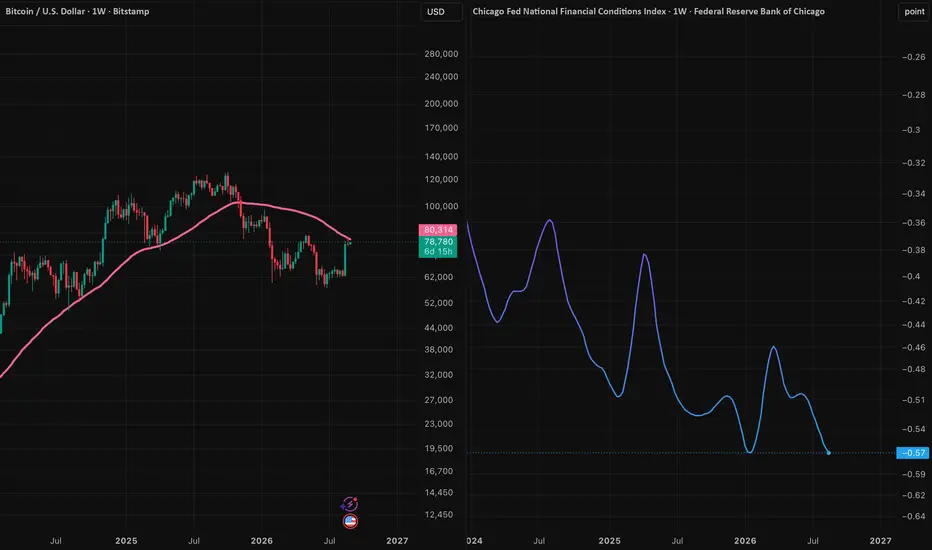
The Bottom is IN. Maybe...On the chart I have the NFCI on one side and Bitcoin with the 50 week SMA on the other.
The gap between these two is what this idea is about.
Policy right now is restrictive. That is not a guess, it is what the Fed keeps telling us. At Jackson Hole on the 28th of August, Warsh said inflation is st
Comparative Analysis of US, China, and Iran GDP (1960–2026)1. The United States ($30.77 Trillion - Top Line)
The US exhibits the most stable and mature economic trajectory in the chart. From 1960 to 2026, the curve is remarkably smooth and consistent, representing a steady annual growth rate of roughly 2% to 3%. The only noticeable dips correspond to major
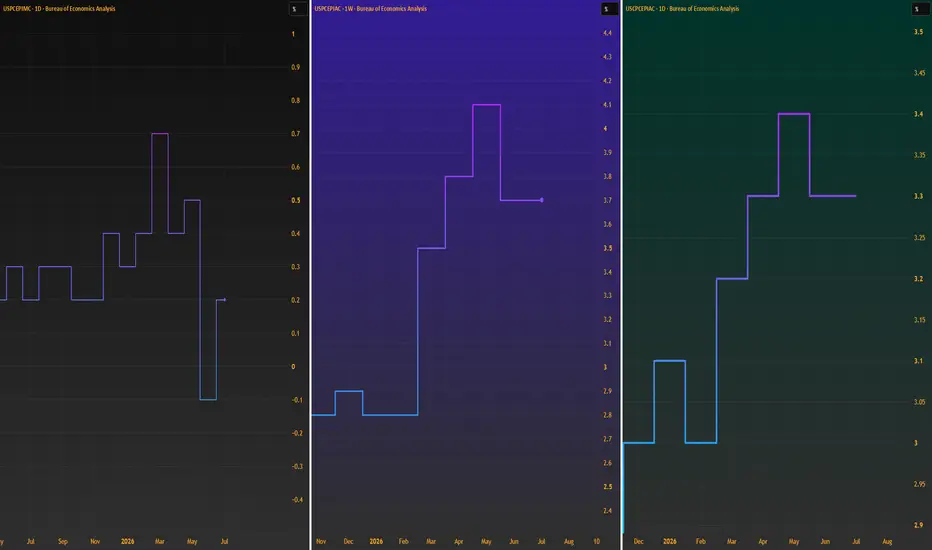
Traders await Warsh’s Jackson Hole remarks The Federal Reserve’s preferred inflation gauge showed price pressures remained elevated in July.
The US Personal Consumption Expenditures (PCE) price index rose 0.2% month-over-month in July, exceeding expectations of a 0.1% increase. On an annual basis, headline PCE inflation reached 3.7%, sligh
See all popular ideas
GDPGDP GrowthReal GDPGDP Per CapitaGDP Per Capita PPPInflation RateInterest RateUnemployment RateGovernment Debt to GDPPopulationAverage Hourly EarningsHouse Price IndexManufacturing Production YoYIndustrial Production YoYCurrent AccountCurrent Account to GDPBalance of TradeEconomic Activity IndexCrude Oil ProductionSee all
Frequently asked questions
Gross Domestic Product (GDP) is the total monetary value of all goods and services produced within a country over a specific period, expressed in its national currency. It reflects the size and health of a nation’s economy.
GDP only includes goods and services that are bought and sold in the official market. For instance, if an electrician is paid to fix sockets at work, that service counts toward GDP. But if they do the same job at home without payment, it doesn’t — because there’s no market transaction to measure.
Informal or illegal activities, like black-market sales or unpaid personal work, aren’t counted. Second-hand goods are also excluded as they were already counted when first sold. Including these would make the numbers less accurate.
On TradingView you can track Global GDP or compare countries by GDP to get a bigger picture.
GDP only includes goods and services that are bought and sold in the official market. For instance, if an electrician is paid to fix sockets at work, that service counts toward GDP. But if they do the same job at home without payment, it doesn’t — because there’s no market transaction to measure.
Informal or illegal activities, like black-market sales or unpaid personal work, aren’t counted. Second-hand goods are also excluded as they were already counted when first sold. Including these would make the numbers less accurate.
On TradingView you can track Global GDP or compare countries by GDP to get a bigger picture.
There are several ways to calculate GDP, each offering a different perspective. The most widely used is the expenditure approach, which measures economic activity based on total spending. The idea is simple: the more money spent in an economy, the more goods and services are being produced.
The formula looks like this:
GDP = C + G + I + (X – M)
Where:
C = Consumer spending
G = Government spending
I = Investment
X = Exports
M = Imports
To stay on top of the events that influence GDP and other key indicators, check out our Economic Calendar. For real-time updates and insights, follow the News Flow.
The formula looks like this:
GDP = C + G + I + (X – M)
Where:
C = Consumer spending
G = Government spending
I = Investment
X = Exports
M = Imports
To stay on top of the events that influence GDP and other key indicators, check out our Economic Calendar. For real-time updates and insights, follow the News Flow.
GDP per capita is a universal indicator of a nation's prosperity, calculated by dividing its total GDP by the population. Unlike GDP itself, it reflects both economic output and population size.
However, it has its limits. It’s an average, not a median, so in countries with high inequality, it can give a misleading picture. It also doesn’t account for cost of living differences or whether economic activity is actually beneficial, as its growth may include things like pollution or sales of harmful products.
Explore our list of countries by GDP per capita for deeper insight, and stay up to date with global economic shifts using our Economic Calendar.
However, it has its limits. It’s an average, not a median, so in countries with high inequality, it can give a misleading picture. It also doesn’t account for cost of living differences or whether economic activity is actually beneficial, as its growth may include things like pollution or sales of harmful products.
Explore our list of countries by GDP per capita for deeper insight, and stay up to date with global economic shifts using our Economic Calendar.
As of today, USA has the highest GDP globally — 30.77 T USD. It's more than the values produced by Mainland China and Germany.
Explore GDP by country on TradingView to get a comprehensive view of world economics.
Real Gross Domestic Product is calculated by adjusting GDP for inflation. It gives a better perspective of the real growth of the economy than just pure GDP.
The most precise method to find out real GDP is to know the GDP deflator and use the following formula.
Real GDP = Nominal GDP / GDP Deflator × 100
Check and compare real GDP across the world to stay on top of global trends.
The most precise method to find out real GDP is to know the GDP deflator and use the following formula.
Real GDP = Nominal GDP / GDP Deflator × 100
Check and compare real GDP across the world to stay on top of global trends.
Interest rate is the percentage charged when you borrow money — or earned when you save or invest. It represents the cost of using someone else's money or the return for lending yours.
For example, if you put $10,000 into a savings account with a 5% annual interest rate, you’d earn $500 in a year, ending up with $10,500. This rate is usually shown as an annual percentage (APR).
At a national level, central banks set key interest rates to influence the economy. Raising rates makes borrowing more expensive, which can slow inflation. Lowering rates encourages borrowing and spending, which can boost economic growth.
Сompare countries by interest rate and keep an eye on our Economic Calendar to stay updated on changes in interest rates and other economic events.
For example, if you put $10,000 into a savings account with a 5% annual interest rate, you’d earn $500 in a year, ending up with $10,500. This rate is usually shown as an annual percentage (APR).
At a national level, central banks set key interest rates to influence the economy. Raising rates makes borrowing more expensive, which can slow inflation. Lowering rates encourages borrowing and spending, which can boost economic growth.
Сompare countries by interest rate and keep an eye on our Economic Calendar to stay updated on changes in interest rates and other economic events.
Central banks set interest rates primarily to control inflation and support economic growth. They analyze key indicators like inflation, GDP growth, unemployment, and financial market trends. If inflation is rising too fast, they may raise rates to cool demand; if the economy is slowing, they lower rates to stimulate borrowing and spending.
Many banks use various models to guide decisions, like the Taylor Rule, balancing inflation and output gaps. Each central bank has its own approach and accounts for many factors, including market expectations - it then communicates the decision through policy statements.
For example, in the US, the Federal Open Market Committee (FOMC), a part of the Federal Reserve, is responsible for setting the federal funds rate target range. The federal funds rate is the interest rate at which banks lend to each other overnight, and it plays a key role in influencing overall borrowing costs in the economy.
With TradingView, you can explore key banks and financial system metrics.
Many banks use various models to guide decisions, like the Taylor Rule, balancing inflation and output gaps. Each central bank has its own approach and accounts for many factors, including market expectations - it then communicates the decision through policy statements.
For example, in the US, the Federal Open Market Committee (FOMC), a part of the Federal Reserve, is responsible for setting the federal funds rate target range. The federal funds rate is the interest rate at which banks lend to each other overnight, and it plays a key role in influencing overall borrowing costs in the economy.
With TradingView, you can explore key banks and financial system metrics.
As of today, France interest rate is 2.15%.
See the list of countries by interest rate and compare different nations' dynamics on a chart.
Inflation is the rate at which the overall level of prices for goods and services rises over time, leading to a decrease in the purchasing power of money. It's an important economic indicator because it reflects changes in the cost of living and influences central banks’ monetary policies, such as adjusting interest rates.
For traders, inflation is crucial because it affects market expectations, asset prices, and currency values. Rising inflation can lead to higher interest rates and impact borrowing costs and corporate profits, while unexpected changes in inflation can cause volatility in stocks, bonds, and commodities. Monitoring inflation helps traders anticipate market movements and manage risks.
Track inflation-related announcements and other important events in TradingView Economic Calendar.
For traders, inflation is crucial because it affects market expectations, asset prices, and currency values. Rising inflation can lead to higher interest rates and impact borrowing costs and corporate profits, while unexpected changes in inflation can cause volatility in stocks, bonds, and commodities. Monitoring inflation helps traders anticipate market movements and manage risks.
Track inflation-related announcements and other important events in TradingView Economic Calendar.
Inflation, the rate of increase in the cost of basic goods and services, is measured monthly, quarterly, and annually.
Most countries calculate inflation using the Consumer Price Index (CPI). The formula is as follows:
Inflation rate = (CPI[current] – CPI[previous]) / CPI[previous] × 100
To simplify, we take the current prices and divide them by the previous prices. The difference is either inflation, indicating the price growth, or deflation, indicating a price drop.
On TradingView, you can easily track and compare countries by inflation and explore even more economic and price indicators.
Most countries calculate inflation using the Consumer Price Index (CPI). The formula is as follows:
Inflation rate = (CPI[current] – CPI[previous]) / CPI[previous] × 100
To simplify, we take the current prices and divide them by the previous prices. The difference is either inflation, indicating the price growth, or deflation, indicating a price drop.
On TradingView, you can easily track and compare countries by inflation and explore even more economic and price indicators.
When a country has debt, it means the government has borrowed money to finance spending that exceeds its revenues. This borrowing is typically done by issuing securities like Treasury bonds, which are purchased by investors, institutions, or other governments.
Current France Government Debt is 3.54 T EUR, and France Government Debt To GDP is 115.6%. Debt itself is calculated as the total sum of Treasury securities currently held by the public and intragovernmental holdings.
The formula for the debt to GDP is the following:
Debt to GDP = Government Debt / GDP × 100
To enhance your analysis, compare countries by government debt with our charts.
Current France Government Debt is 3.54 T EUR, and France Government Debt To GDP is 115.6%. Debt itself is calculated as the total sum of Treasury securities currently held by the public and intragovernmental holdings.
The formula for the debt to GDP is the following:
Debt to GDP = Government Debt / GDP × 100
To enhance your analysis, compare countries by government debt with our charts.
As of today, France inflation rate YoY is 2.4%.
See the list of countries by inflation and compare different nations' dynamics on a chart.