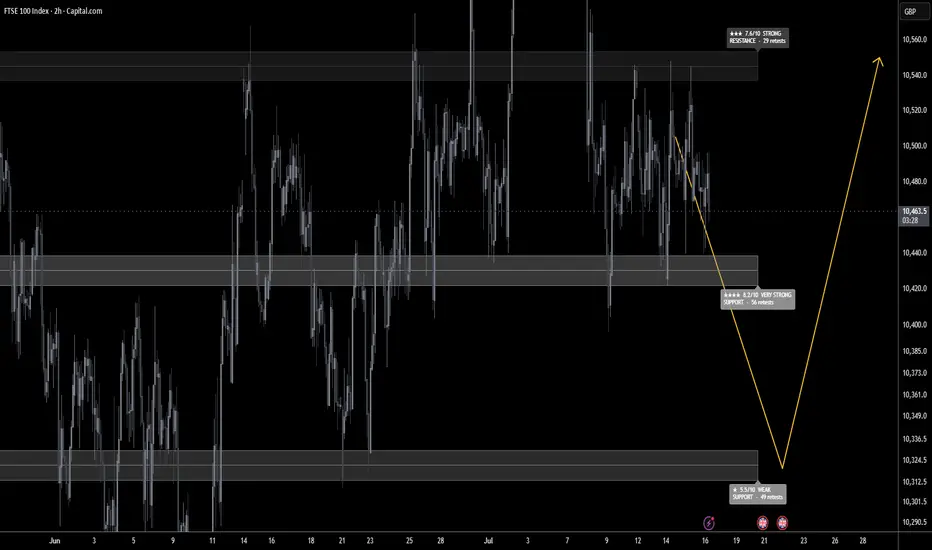
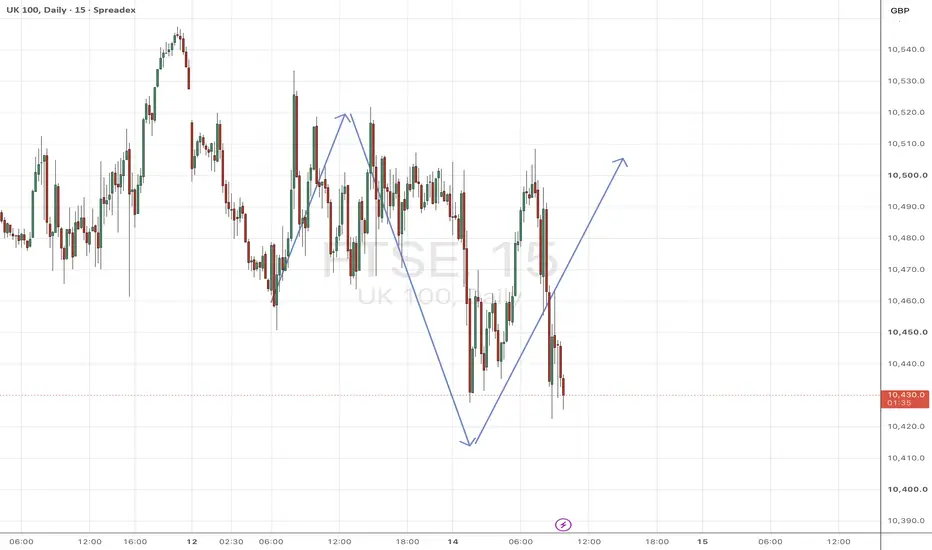
UK100 H2: Why 10,430 Is the Only Level That Matters
▪️ UK100 H2 SNAPSHOT — EXECUTIVE SUMMARY
▪️ the FTSE 100 is rotating near 10,465 inside a well-worn range, respected on both sides. Price is fair-valued between supply and demand.
▪️ Primary outlook is neutral — 10,430 is the level to watch; the range holds until it doesn't.
▪️ Key resistance zone: 10,560, leaned on 29 times. There is little labelled supply above it, so a break runs into open air.
▪️ Major defense line: 10,430 — a very strong level at 56 retests, the floor that has repeatedly turned price.
▪️ Primary downside targets on a break: 10,322, where liquidity pools.
▪️ Major liquidity magnet below: 10,430–10,322 — the pull if the floor cracks.
▪️ Bullish scenario: Reclaim 10,560 and 10,560 becomes the objective bulls want.
▪️ KEY LEVELS
▪️ Current Price: 10,465
RESISTANCEs
▪️ 10,560 — ★★★ 7.6 Strong · 29 retests
SUPPORTs
▪️ 10,430 — ★★★★ 8.2 Very Strong · 56 retests
▪️ 10,322 — ★ 5.5 Weak · 49 retests
▪️ ProjectSyndicate Levels Desk — Overview of key S/R zones for UK100, NVDA, NQ, ES & GC traders every week. Subscribe to stay up to date with the latest levels.
FTSE 100 Index
No trades
No trades
In-depth trading ideas
**FTSE 100 Bullish Range Breakout Targets Higher Resistance**
The FTSE 100 has broken out of a well-defined consolidation range, signaling renewed bullish momentum after several sessions of sideways price action. The breakout above the range high, supported by the Ichimoku Cloud, suggests buyers are regaining control. If price maintains this breakout and holds above the former resistance, the next likely move is toward the major resistance zone near **10,700–10,720**, where profit-taking may occur. A pullback to the breakout level could provide additional confirmation before continuation.
**🎯 Target:** **10,700 – 10,720**
**⚠️ Note:** This analysis is based on the current chart structure and is for educational purposes only. Always wait for confirmation and use proper risk management before entering a trade.
FTSE 100 Bearish Setup
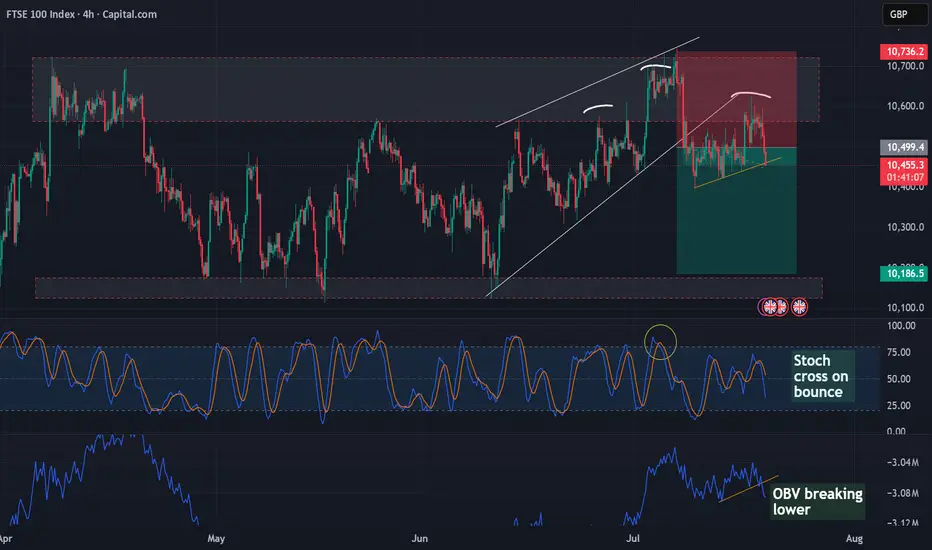
Price has rejected from the upper boundary of the 4H range/resistance zone.
The rejection also coincides with a potential rising wedge / Head & Shoulders breaking to the downside.
Stochastic has a bearish cross following the rejection, suggesting momentum may be shifting lower.
OBV is also beginning to break lower, indicating weakening buying pressure and supporting the bearish move.
Broader geopolitical uncertainty and risk-off sentiment could provide additional downside pressure for UK equities.
Initial downside target sits around the lower 4H support zone near 10,180–10,200.
Invalidation would come from a strong move back above the recent highs / upper resistance zone around 10,700–10,735.
UK inflation data is due this week, which could create volatility across the FTSE and GBP. It may be worth waiting for the data release before entering, or for clearer post-data confirmation of the bearish move.
FTSE 100 Holds Its Range as Momentum Levels OffThe FTSE 100 remains contained within a broad daily consolidation between support near 10,150 and resistance around 10,700. Price recently tested the upper boundary but failed to establish a sustained break, leaving the index positioned near the middle-to-upper portion of the range.
The moving-average structure remains constructive. Price is holding above the rising 50-day SMA near 10,443 and well above the 200-day SMA around 10,178. The shorter average also remains above the longer average, which supports a moderately bullish medium-term backdrop despite the absence of a clear breakout.
Momentum has become less decisive. The MACD line is slightly below its signal line while both remain above the zero level, indicating that positive momentum is fading rather than reversing sharply. RSI is near 52, reinforcing a neutral reading with no sign of overbought or oversold conditions.
The 10,700 area remains the key resistance reference, while 10,150 continues to define the lower boundary of the current range. As long as price remains between these levels, the technical picture is best described as neutral in the short term, with a mild bullish bias supported by the rising moving averages.
-MW
FTSE 100: Momentum Weakens as Key Support Comes Under PressureThe FTSE 100 has failed at the April high near 10,725, and momentum is beginning to deteriorate.
The RSI has slipped below 50, while both the MACD and DMI are turning increasingly negative, suggesting upside momentum is fading.
The market is currently testing the 55-day moving average around 10,410. A sustained break below this level would expose the 200-day moving average near 10,156.
The longer-term picture remains constructive—for now. The 200-day moving average has underpinned the bull trend for over a year and sits close to the 55-week moving average at 9,903, creating an important support zone.
However, the key level to watch is the March reaction low at 9,670. A weekly close below this level would break the pattern of higher highs and higher lows that defines the current uptrend and would significantly increase the risk that a major top is forming.
At present, the FTSE 100 remains range-bound, but the technical evidence suggests the balance of risk is beginning to shift to the downside.
Disclaimer:
The information posted on Trading View is for informative purposes and is not intended to constitute advice in any form, including but not limited to investment, accounting, tax, legal or regulatory advice. The information therefore has no regard to the specific investment objectives, financial situation or particular needs of any specific recipient. Opinions expressed are our current opinions as of the date appearing on Trading View only. All illustrations, forecasts or hypothetical data are for illustrative purposes only. The Society of Technical Analysts Ltd does not make representation that the information provided is appropriate for use in all jurisdictions or by all Investors or other potential Investors. Parties are therefore responsible for compliance with applicable local laws and regulations. The Society of Technical Analysts will not be held liable for any loss or damage resulting directly or indirectly from the use of any information on this site.
Bull Monday with 10531 10508 support | Rise to 10632The FTSE remains the strongest of the major European indices. The reason is straightforward. Higher oil prices continue to support the heavyweight energy companies that make up a significant proportion of the index. Shell and BP should remain well supported while crude trades above $90, helping offset weakness in other sectors. However, if bond yields continue climbing, financial conditions will tighten and that may eventually limit further gains.
What I'm Watching
Whether buyers defend Friday's support levels.
Performance of the energy sector during the European session.
Whether banks continue outperforming on higher yields.
Trading Plan
I still favour buying controlled pullbacks while support holds.
If we see an early dip followed by higher lows developing on the intraday charts, I think the FTSE has the potential to outperform again.
A break below Friday's low would weaken the bullish outlook and suggest a deeper retracement is developing.
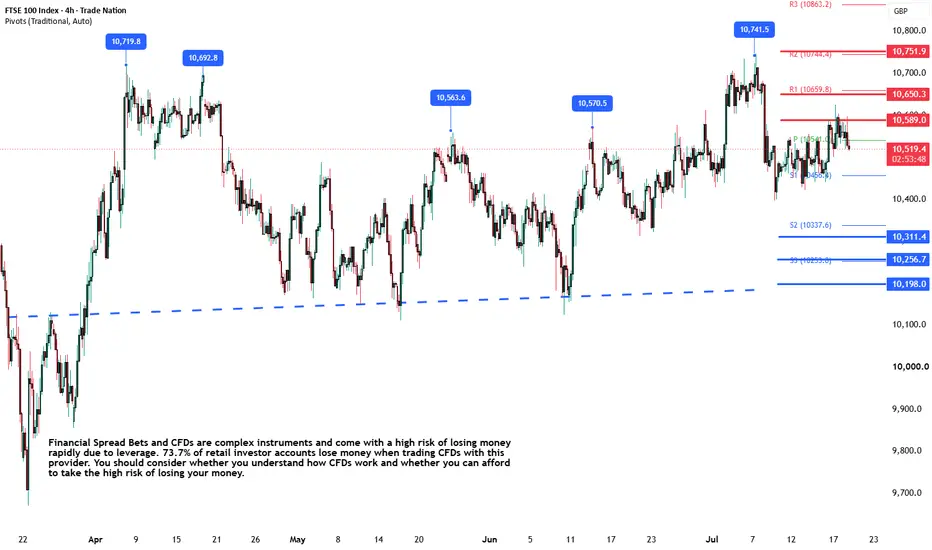
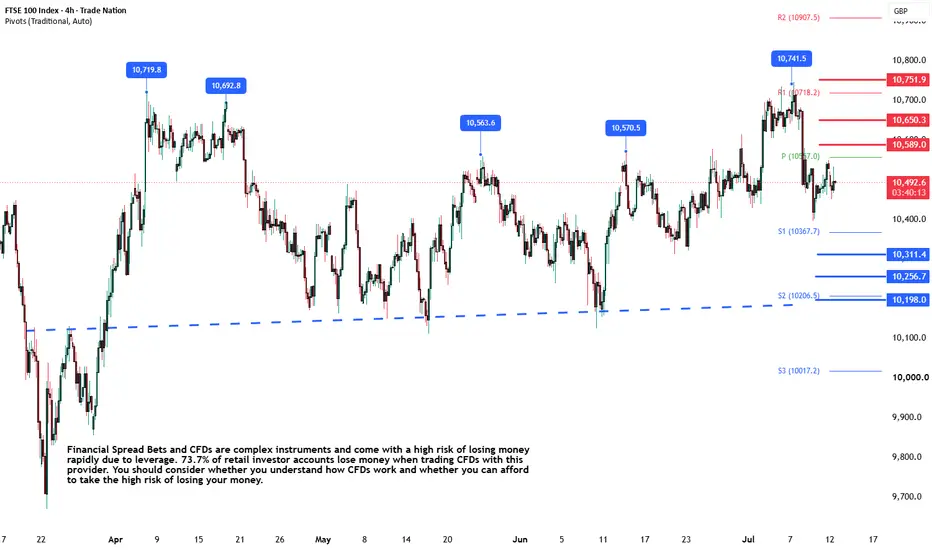
FTSE100 resistance retest at 10590FTSE continues to trade within the broader prevailing trend, with recent price action showing signs of a corrective pullback phase.
Key Level: 10300
This area previously acted as a consolidation zone and is currently being monitored as a notable support level.
Scenario Above 10300
If price remains above 10300, market structure may continue to reflect near-term upside pressure. In this context, the following levels may act as reference resistance areas:
10590 – Initial resistance
10650 – Psychological and structural level
10750 – Extended resistance on the longer-term chart
Scenario Below 10300
A sustained move and daily close below 10300 would indicate a shift in the current short-term structure. In that scenario, the following levels may become relevant on the downside:
10250 – Minor support
10200 – Stronger support and potential demand zone
Conclusion
FTSE remains above an important technical area, with 10300 acting as a key reference level for the current price structure. Price behaviour around this zone may help determine whether the market continues within the recent uptrend phase or transitions toward further downside continuation.
The information provided does not constitute investment advice nor take into account the individual financial circumstances or objectives of any investor. Any information that may be provided relating to past performance is not a reliable indicator of future results or performance. To the extent permitted by law, in no event shall Trade Nation (or any affiliate or employee) have any liability for any loss arising from the use of the information provided. Any person acting on the information does so entirely at their own risk. Any information which could be construed as “investment research” has not been prepared in accordance with legal requirements designed to promote the independence of investment research and as such is considered to be a marketing communication.
Financial Spread Bets and CFDs are complex instruments and come with a high risk of losing money rapidly due to leverage. 73.7% of retail investor accounts lose money when trading CFDs with this provider. You should consider whether you understand how CFDs work and whether you can afford to take the high risk of losing your money.
FTSE100 corrective pullback support at 10300FTSE continues to trade within the broader prevailing trend, with recent price action showing signs of a corrective pullback phase.
Key Level: 10300
This area previously acted as a consolidation zone and is currently being monitored as a notable support level.
Scenario Above 10300
If price remains above 10300, market structure may continue to reflect near-term upside pressure. In this context, the following levels may act as reference resistance areas:
10590 – Initial resistance
10650 – Psychological and structural level
10750 – Extended resistance on the longer-term chart
Scenario Below 10300
A sustained move and daily close below 10300 would indicate a shift in the current short-term structure. In that scenario, the following levels may become relevant on the downside:
10250 – Minor support
10200 – Stronger support and potential demand zone
Conclusion
FTSE remains above an important technical area, with 10300 acting as a key reference level for the current price structure. Price behaviour around this zone may help determine whether the market continues within the recent uptrend phase or transitions toward further downside continuation.
The information provided does not constitute investment advice nor take into account the individual financial circumstances or objectives of any investor. Any information that may be provided relating to past performance is not a reliable indicator of future results or performance. To the extent permitted by law, in no event shall Trade Nation (or any affiliate or employee) have any liability for any loss arising from the use of the information provided. Any person acting on the information does so entirely at their own risk. Any information which could be construed as “investment research” has not been prepared in accordance with legal requirements designed to promote the independence of investment research and as such is considered to be a marketing communication.
Financial Spread Bets and CFDs are complex instruments and come with a high risk of losing money rapidly due to leverage. 73.7% of retail investor accounts lose money when trading CFDs with this provider. You should consider whether you understand how CFDs work and whether you can afford to take the high risk of losing your money.
UK 100 ($UK100) Daily: Strong Bearish Rejection Off Resistance SUK 100 ( FOREXCOM:UK100 ) Daily: Strong Bearish Rejection Off Resistance Signals Correction Leg Toward 10,300 Target Matrix
### 🇬🇧 UK 100 Index ( FOREXCOM:UK100 - FTSE 100) Daily Technical Study (Ref: UK100_2026-07-08_09-03-03.png)
We are deploying a tactical structural update on the UK 100 Index ( FOREXCOM:UK100 ) on the Daily (1D) time matrix. The British benchmark has printed a clear institutional distribution signature at its upper boundaries, triggering a short-term bearish correction model.
The index displays notable sell-side dominance today, trading down **-0.72% at 10,582.2**, following consecutive failed attempts to establish structural acceptance above historical ceilings.
---
### 🔍 Technical Architecture & Resistance Rejection:
1. **The 10,713.2 Supply Wall:** Buyers faced aggressive distribution near the key horizontal resistance ceiling locked at **10,713.2**. The consecutive upper wicks printed at this zone confirm heavy sell-side liquidity traps and exhaustion from the bulls.
2. **The Measured Correction (Pink Vector):** Our structural projection model maps out an immediate **-2.65% (~280 points) contraction leg**, shifting short-term order flow into a mean-reversion phase.
---
### 🎯 The Bearish Target Matrix & Dynamic Floors:
As the correction unfolds, we are monitoring a sequential cascade of key technical targets:
* **Target 1 (10,450 Corridor):** The initial downside velocity target, requiring a decisive breach of the minor short-term exponential ribbons to open the technical highway lower.
* **Target 2 (10,300 Core Demand Pocket):** Our primary corrective objective. This zone offers heavy technical confluence, overlapping our rising **72-period SMA (green line sitting at 10,326.7)** and the primary **ascending support trendline (blue diagonal line)**. We expect a major institutional battleground and potential re-accumulation signatures at this level.
* **Macro Support Anchor (10,100/200-EMA):** If macroeconomic pressure breaks the blue LTA, the ultimate long-term structural safety net remains anchored at the institutional **200-period EMA (purple line sitting at 10,087.1)**, confluencing with the massive **10,100** psychological barrier.
---
### 📊 Tactical Summary:
* **Bias:** Bearish (Short-Term Corrective)
* **Immediate Target 1:** 10,450
* **Core Target 2:** 10,300 (LTA & 72 SMA Confluence)
* **Macro Anchor Support:** 10,100 (Institutional 200-EMA)
---
📊 **ChartPro Data**
*UK Equity Architecture, Distribution Models & Systematic Risk Sourcing.*
⚠️ **Disclaimer:** For educational and informational purposes only. This technical study represents a personal trading model and does not constitute financial or investment advice.
FTSE 100 – 1H | Consolidation Below ResistanceThe FTSE 100 has continued to stabilize following the sharp sell-off highlighted in the previous analysis. Buyers have successfully defended the 10,430–10,450 demand zone, but bullish momentum has slowed as price enters a period of consolidation below the key 10,550–10,600 resistance area. The market is now compressing into a tightening range, suggesting that a breakout could determine the next directional move.
Technical Analysis
The previous analysis anticipated that holding above the 10,430–10,450 support zone would allow buyers to build a recovery. Price respected this demand area and extended higher before losing momentum beneath overhead resistance.
Key observations include:
Buyers continue to defend the 10,430–10,450 demand zone, preventing sellers from extending the previous decline.
Price has maintained a sequence of higher lows from the recent swing low, indicating that short-term buying pressure remains intact.
The recovery has stalled below the 10,550–10,600 resistance zone, where sellers continue to cap bullish advances.
Recent price action has formed a tightening consolidation pattern, reflecting indecision between buyers and sellers.
The broader recovery remains valid while price holds above support, but a confirmed breakout is required to establish the next trend.
Momentum has stabilized after the recent recovery, with the market awaiting confirmation before committing to its next major move.
UK100 Short Term Sell IdeaH1 - Strong bearish move.
No opposite signs.
Expecting bearish continuation until the two strong resistance zones hold.
If you enjoy this idea, don’t forget to LIKE 👍, FOLLOW ✅, SHARE 🙌, and COMMENT ✍! Drop your thoughts and charts below to keep the discussion going. Your support helps keep this content free and reach more people! 🚀
UK100 H2 MAP: Strong 10,432 Floor vs 10,611 Ceiling ▪️ the FTSE 100 is rotating near 10,549 inside a defined recent range, respected on both sides. Price is fair-valued between supply and demand.
▪️ Primary outlook is neutral — 10,611 is the level to watch; the range holds until it doesn't.
▪️ Key resistance zone: 10,611, leaned on 26 times. Beyond it, 10,730 is the next hurdle.
▪️ Major defense line: 10,432 — a strong level at 56 retests, the floor that has repeatedly turned price.
▪️ Primary downside targets on a break: 10,322, where liquidity pools.
▪️ Major liquidity magnet below: 10,432–10,322 — the pull if the floor cracks.
▪️ Bullish scenario: Reclaim 10,611 and 10,730 becomes the objective bulls want.
▪️ KEY LEVELS
▪️ Current Price: 10,549
RESISTANCEs
▪️ 10,730 — ★★★ 7.2 Strong · 10 retests
▪️ 10,611 — ★★★ 7.5 Strong · 26 retests
SUPPORTs
▪️ 10,432 — ★★★ 7.9 Strong · 56 retests
▪️ 10,322 — ★ 5.1 Weak · 49 retests
▪️ ProjectSyndicate Levels Desk — Overview of key S/R zones for indices, metals, NVDA, NQ, ES & GC traders every week. Subscribe to stay up to date with the latest levels.
UK100 Price Outlook – Trade Setup🌐Macro Background
The UK100 index staged a modest rebound in early trading following a selloff—its largest single-day drop in over a week. Investor focus is firmly fixed on the domestic political transition and upcoming economic releases. Following Andy Burnham's assumption of office as Prime Minister, markets are closely assessing the incoming administration's fiscal strategy, economic policy trajectory, and cabinet formation.
Beyond Westminster, macroeconomic catalysts are set to drive near-term volatility. Upcoming UK employment figures and tomorrow’s critical CPI inflation data will serve as key metrics for gauging the Bank of England's (BoE) monetary policy trajectory and near-term rate expectations.
📊Technical Structure
Price action is currently oscillating within an ascending channel structure defined by higher highs and higher lows since early July.
Key Resistance Zone ($10,530 – $10,571): The index recently faced strong selling pressure at the upper boundary.
Key Support Zone ($10,396 – $10,436): Following the pullback, price is hovering near mid-channel support.
🎯Trade Setup
Given that the index is currently holding near the lower boundary of its ascending structure, a Range-Bound Buy on Support / Pullback strategy is favoured:
Entry Point: Look for long positions on a retest or price stabilisation within the $10,436 – $10,460 region.
Take Profit 1 (TP1): $10,530 (lower boundary of the Resistance Zone).
Take Profit 2 (TP2): $10,571 (upper edge of the Resistance Zone / recent swing high).
❌Invalidation
If it closes decisively below $10,396, breaking the lower trendline of the channel.
📝Trade Summary
Go Long on UK100 in the $10,436 – $10,460 zone, targeting $10,530 – $10,571, as the index rebounds off ascending channel support amidst UK political transition and key labor/CPI data releases (Stop Loss below $10,390).
⚠️Disclaimer
This analysis is for reference only and does not constitute trading advice. Financial markets involve significant risk; proper risk and position management are essential.
New Era?? With the new prime minister arriving on Monday, it seems to have come just in time for the upward trend to reignite bringing to a close the pullback which has been materializing since February, this most recent downtrend has been broken as of late June and the resistance barrier of 10,780.5 is just short of the ATH ( approximately 1.5% short). Will the new leadership bring about a surge in the FTSE 100, time will tell, A break above this resistance line could well see prices rise as high as 13,000 (approximately)
10500 to hold with 10590 10640 resistanceSkip the noise!
Spotting hidden trading opportunities before the market opens isn't about luck - it's about preparation. Our daily pre-market analysis breaks it down step-by-step...
The FTSE continues to hold up better than many of its global counterparts. The reason hasn't really changed all week. Higher oil prices continue to support the heavyweight energy names, and that has helped offset some of the weakness elsewhere in the market. That doesn't mean the FTSE is immune to a broader risk-off move, but it does mean buyers have generally been quicker to step back in than we've seen elsewhere.
What I'm Watching
Whether yesterday's support continues to hold.
Any early weakness being bought rather than accelerating lower.
Continued strength in Shell and BP if crude oil remains elevated.
Trading Plan
I still prefer buying controlled pullbacks rather than chasing strength.
If buyers defend support early in the session, I think another attempt towards this week's highs remains possible.
However, if support gives way and the market starts producing lower highs, I would become much more defensive.
Yesterday played out wellThe FTSE finished yesterday around the 10498 area and was remarkably resilient considering the broader risk-off move.
The main reason for that is oil. The FTSE's heavy exposure to the energy sector means rising crude prices can actually provide support to the index through the likes of BP and Shell. That is exactly what we saw yesterday, with energy strength helping offset weakness elsewhere in the market. However, the FTSE is not completely immune from a global equity sell-off.
European futures are pointing lower this morning and if the DAX and US futures continue to weaken, I think the FTSE will eventually struggle to hold up on energy strength alone.
What I'm Watching
The first area I am watching is the recent support around the 10460 area.
Below that, the 10400 zone becomes increasingly important.
If we see an early drop into support followed by buyers stepping back in, then the FTSE could once again prove to be the strongest of the major indices.
The first meaningful resistance is around the 10540 area, with 10585 above that.
A break and hold above those levels would put the bulls back in control.
Trading Plan
I am neutral to slightly bearish initially.
I don't want to buy the first dip blindly.
The ideal long setup would be an early sell-off into support followed by a strong bullish reaction and a reclaim of the short-term moving averages.
If 10460 breaks cleanly and the market starts forming lower highs, then I would be more interested in selling a failed bounce towards the 10400 area.
FTSE retracement below 10590 resistanceFTSE continues to trade within the broader prevailing trend, with recent price action showing signs of a corrective pullback phase.
Key Level: 10300
This area previously acted as a consolidation zone and is currently being monitored as a notable support level.
Scenario Above 10300
If price remains above 10300, market structure may continue to reflect near-term upside pressure. In this context, the following levels may act as reference resistance areas:
10590 – Initial resistance
10650 – Psychological and structural level
10750 – Extended resistance on the longer-term chart
Scenario Below 10300
A sustained move and daily close below 10300 would indicate a shift in the current short-term structure. In that scenario, the following levels may become relevant on the downside:
10250 – Minor support
10200 – Stronger support and potential demand zone
Conclusion
FTSE remains above an important technical area, with 10300 acting as a key reference level for the current price structure. Price behaviour around this zone may help determine whether the market continues within the recent uptrend phase or transitions toward further downside continuation.
The information provided does not constitute investment advice nor take into account the individual financial circumstances or objectives of any investor. Any information that may be provided relating to past performance is not a reliable indicator of future results or performance. To the extent permitted by law, in no event shall Trade Nation (or any affiliate or employee) have any liability for any loss arising from the use of the information provided. Any person acting on the information does so entirely at their own risk. Any information which could be construed as “investment research” has not been prepared in accordance with legal requirements designed to promote the independence of investment research and as such is considered to be a marketing communication.
Financial Spread Bets and CFDs are complex instruments and come with a high risk of losing money rapidly due to leverage. 73.7% of retail investor accounts lose money when trading CFDs with this provider. You should consider whether you understand how CFDs work and whether you can afford to take the high risk of losing your money.
Geopolitical situation as fighting intensifiesWell, we start the new week with the geopolitical situation firmly back in control of the markets. Fighting in the Gulf has intensified again and the uncertainty surrounding the Strait of Hormuz has sent oil sharply higher this morning.
That has immediately brought the inflation problem back into focus.
Asian markets have been hit hard overnight, European futures are pointing lower and the US markets are also under pressure ahead of the open. The dollar and bond yields have both pushed higher as traders increase their expectations that the Federal Reserve may need to raise rates again.
So, after the fairly resilient finish to last week, we have a much more cautious backdrop this morning. The big question today is whether the equity markets can absorb another geopolitical shock and attract buyers on the dip, or whether this is the start of a more meaningful risk-off move.
The overall tone has shifted more defensive. My bias today is bearish DAX and Gold, cautious bearish Nasdaq and FTSE, while the S&P remains the strongest market structurally. The key driver is the escalation in the Gulf and renewed uncertainty over the Strait of Hormuz: oil is up more than 4%, global equities and US futures are under pressure, the dollar and Treasury yields have risen, while gold has surprisingly fallen more than 1% as inflation and rate-hike concerns outweigh the safe-haven bid.
UK100 - Higher-Timeframe Trend Continuation via Lower-Timeframe Market Context:
The FTSE 100 Index (UK100) remains locked in a macro Up Trend on the 4H timeframe. After hitting a strong 4H horizontal resistance barrier, the price underwent a sharp corrective pullback to seek deeper liquidity. However, this macro retracement is now showing definitive signs of completion on the lower timeframes, signaling a continuation back toward macro targets. Above the immediate structure sits a major Daily Strong Resistance zone.
Technical Analysis:
Macro Trend Alignment: Despite the recent sharp drop from the 4H resistance, the macro market structure continues to hold higher lows, preserving the primary bullish bias.
Lower-Timeframe Reversal: On the 1H timeframe, the aggressive sell-off bottomed out with a textbook Bullish RSI Divergence. Following this momentum shift, buyers stepped in to break the internal lower-high structure, carving out the first local Higher High (HH).
Entry Trigger Logic: The price has pulled back slightly after creating that initial 1H structural peak. A secondary expansion that breaches this recent internal Higher High confirms that the local corrective phase is officially over and institutional buying pressure has fully resumed.
Trade Plan:
Entry Point: Long entry triggered a few points above the recent internal 1H Higher High peak at 10,554.2.
Stop Loss (SL): Placed strictly below the local market structure at 10,390.1 to safeguard the trade against late-stage liquidity sweeps.
Profit Targets (TP):
1st Target (Partial TP): The previous 4H swing high zone from which the price initially dropped, marked at 10,708.5.
2nd Target (Main TP): The higher-timeframe milestone marked at the Daily Resistance ceiling of 10,868.8.
Risk Management: Capital exposure per trade is strictly capped at a disciplined
Disclaimer: This analysis is for educational purposes only. Always wait for a confirmed hourly candle close above the entry level to filter out any minor stop hunts at local resistance.
FTSE 100–Buyers Defend Key Support as Recovery Attempts to buildFollowing the sharp sell-off highlighted in the previous analysis, the FTSE 100 has begun to stabilize above the 10,430–10,450 demand zone. Buyers have successfully defended this area, preventing further downside and initiating a short-term recovery. While the immediate bearish momentum has eased, the index remains below the major 10,600 resistance, meaning the broader recovery is still in its early stages.
Technical Analysis
As discussed previously, the rejection from 10,680–10,700 marked the end of the prior bullish sequence and triggered an aggressive bearish range expansion that broke several intraday support levels.
The latest price action suggests sellers are losing momentum as buyers respond from a historically significant demand zone.
Key observations include:
Buyers successfully defended the 10,430–10,450 support zone, preventing a continuation of the recent bearish impulse.
Price has started producing higher lows and higher highs from the recent swing low, indicating improving short-term bullish momentum.
The recovery has reclaimed the 10,500 psychological level, showing renewed buying interest after the sharp decline.
Despite the rebound, price remains below the 10,600 resistance zone, which previously acted as major support before turning into resistance.
The broader medium-term structure remains constructive, but the market must reclaim 10,600 to shift the short-term bias back in favor of buyers.
Momentum has improved from the recent lows, but confirmation is still required before a sustained bullish reversal can be expected.
FTSE 100 (1H) – Sharp Sell-Off Tests Key SupportThe FTSE 100 has experienced a significant intraday decline after failing to sustain trading above the 10,600 resistance zone. The strong bearish impulse has erased recent gains and pushed price back toward a major support area around 10,430–10,450, where buyers are attempting to stabilize the market.
Technical Analysis
The chart shows that price previously respected an ascending channel before breaking higher and establishing a series of Higher Highs (HH) and Higher Lows (HL). However, repeated rejection near 10,680–10,700 exhausted bullish momentum.
The recent bearish candle has broken through multiple intraday support levels, shifting the short-term bias in favor of sellers. Price is now testing a historical demand zone around 10,430, making this an important decision point.
While the broader medium-term trend remains constructive, the immediate momentum is bearish until buyers reclaim lost resistance.