Adidas: Momentum SlowsAdidas shares have lost upward momentum recently and moved sideways, with prices showing a slight downward trend in recent days. In the short term, we expect a corrective rebound, with an interim high below resistance at €196.40. After that, we anticipate renewed selling to push the price below supp
adidas AG
No trades
No trades
Compare with adidas AG
7.80 EUR
1.34 B EUR
24.81 B EUR
165.11 M
Next report date
—
Report period
—
EPS estimate
—
Revenue estimate
—
Profile
Sector
Industry
CEO
Bjørn Gulden
Website
Headquarters
Herzogenaurach
Founded
1989
IPO date
Nov 28, 1997
ISIN
DE000A1EWWW0
FIGI
BBG000FR1Q86
Identifiers
ISIN DE000A1EWWW0
adidas AG engages in the design, distribution, and marketing of athletic and sporting lifestyle products. It operates through the following geographical segments: EMEA, North America, Greater China, Asia-Pacific, Latin America, and Other Businesses. The Other Businesses segment includes the activities of the Y-3 label and other subordinated businesses. The company was founded by Adolf Dassler in 1920 and is headquartered in Herzogenaurach, Germany.
Will Adidas (ADS) Continue the Uptrend ?
Adidas (ADS) appears to be breaking out of a classic cup-and-handle formation, with price reclaiming the €170 neckline after a healthy handle consolidation.
Technical highlights:
Cup-and-handle breakout in progress
MACD remains bullish
Strong relative momentum
Measured move projects €200
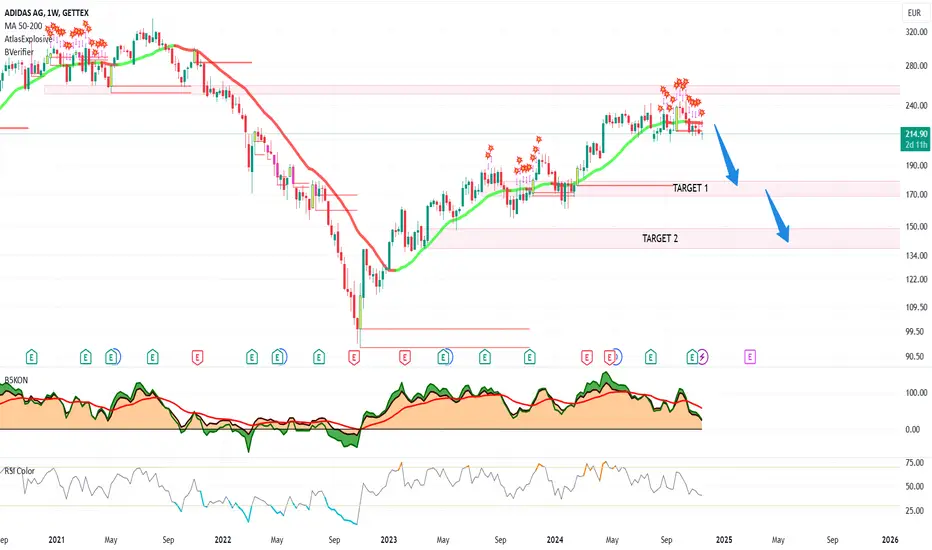
Adidas Weekly: Bearish Until Proven OtherwiseXETR:ADS may be improving as a company, but the weekly chart is still carrying a bearish structural story.
The key detail here is the invalidation line.
Price already rejected from the larger WCL area, which is where sellers needed to defend if the broader bearish sequence was still active. After
Adidas AG (ADS) | Preparing for Wave 5 Rally Toward €500–€1,200Adidas AG (XETR:ADS) | Long-Term Elliott Wave & Structural Outlook
Adidas AG is completing a Wave 4 correction near key Fibonacci support, aligning technical structure and smart money accumulation for a potential long-term Wave 5 expansion toward €500–€1,200.
📊 Technical & Fundamental Confluen
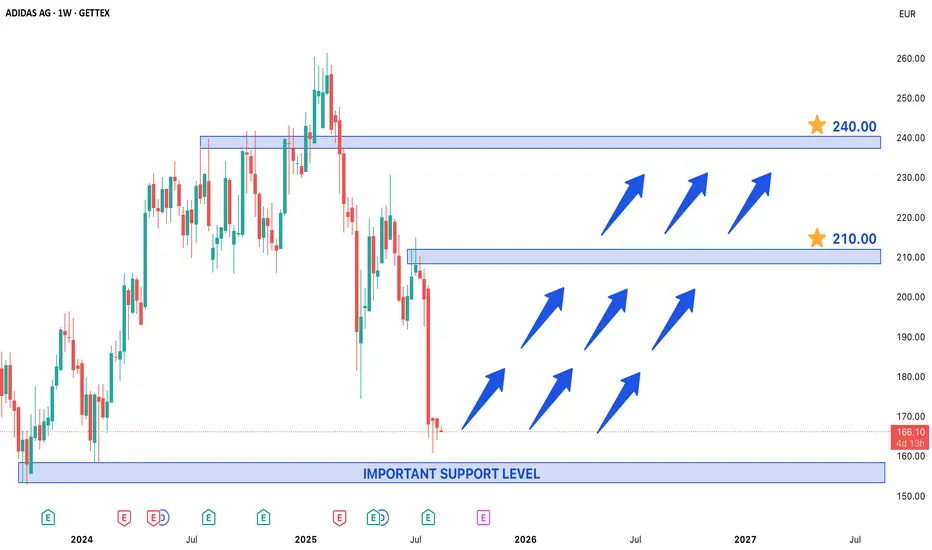
Adidas ADS Trading Near Important Support Level in Weekly ChartAdidas Stock Trading Near Important Support Level – A Potential Long-Term Entry Point
Adidas (ADS) stock is currently trading near a crucial support level, presenting a potential opportunity for long-term investors. Historically, this price level has acted as a strong base, with notable rejections
Adidas ADS Trading Near Important Support Level in Weekly ChartAdidas Stock Trading Near Important Support Level – A Potential Long-Term Entry Point
Adidas (ADS) stock is currently trading near a crucial support level, presenting a potential opportunity for long-term investors. Historically, this price level has acted as a strong base, with notable rejections
Adidias - more downside awaiting (?)I chose to present the chart as log scale to show more clearly the sub-waves of the white impulse count. Without that the impulsive structure of the waves wouldn´t be easy to see.
My main scenario is that Adidas will become cheaper in the foreseeable future as market price broke the structure indic
See all ideas
Summarizing what the indicators are suggesting.
Neutral
SellBuy
Strong sellStrong buy
Strong sellSellNeutralBuyStrong buy
Neutral
SellBuy
Strong sellStrong buy
Strong sellSellNeutralBuyStrong buy
Neutral
SellBuy
Strong sellStrong buy
Strong sellSellNeutralBuyStrong buy
An aggregate view of professional's ratings.
Neutral
SellBuy
Strong sellStrong buy
Strong sellSellNeutralBuyStrong buy
Neutral
SellBuy
Strong sellStrong buy
Strong sellSellNeutralBuyStrong buy
Neutral
SellBuy
Strong sellStrong buy
Strong sellSellNeutralBuyStrong buy
Displays a symbol's price movements over previous years to identify recurring trends.
3.780% YTM
Maturity dateSep 10, 2035
Coupon0.63% (Fixed)
3.504% YTM
Maturity dateMay 26, 2031
Coupon3.50% (Fixed)
3.367% YTM
Maturity dateNov 6, 2030
Coupon2.75% (Fixed)
3.142% YTM
Maturity dateNov 21, 2029
Coupon3.13% (Fixed)
2.889% YTM
Maturity dateOct 5, 2028
Coupon0% (Zero)
2.868% YTM
Maturity dateOct 8, 2026
Coupon2.25% (Fixed)
See all ADS bonds
Frequently asked questions
The current price of ADS is 178.80 EUR — it has decreased by −0.14% in the past 24 hours. Watch adidas AG stock price performance more closely on the chart.
Depending on the exchange, the stock ticker may vary. For instance, on FWB exchange adidas AG stocks are traded under the ticker ADS.
ADS stock has fallen by −1.21% compared to the previous week, the month change is a 2.15% rise, over the last year adidas AG has showed a −12.57% decrease.
We've gathered analysts' opinions on adidas AG future price: according to them, ADS price has a max estimate of 250.00 EUR and a min estimate of 170.00 EUR. Watch ADS chart and read a more detailed adidas AG stock forecast: see what analysts think of adidas AG and suggest that you do with its stocks.
ADS stock is 1.40% volatile and has beta coefficient of 1.31. Track adidas AG stock price on the chart and check out the list of the most volatile stocks — is adidas AG there?
Today adidas AG has the market capitalization of 32.43 B, it has decreased by −1.36% over the last week.
Yes, you can track adidas AG financials in yearly and quarterly reports right on TradingView.
adidas AG is going to release the next earnings report on Jul 30, 2026. Keep track of upcoming events with our Earnings Calendar.
ADS earnings for the last quarter are 2.70 EUR per share, whereas the estimation was 2.66 EUR resulting in a 1.54% surprise. The estimated earnings for the next quarter are 2.39 EUR per share. See more details about adidas AG earnings.
adidas AG revenue for the last quarter amounts to 6.59 B EUR, despite the estimated figure of 6.32 B EUR. In the next quarter, revenue is expected to reach 6.60 B EUR.
ADS net income for the last quarter is 482.00 M EUR, while the quarter before that showed 81.00 M EUR of net income which accounts for 0.00% change. Track more adidas AG financial stats to get the full picture.
Yes, ADS dividends are paid annually. The last dividend per share was 2.80 EUR. As of today, Dividend Yield (TTM)% is 1.54%. Tracking adidas AG dividends might help you take more informed decisions.
adidas AG dividend yield was 1.66% in 2025, and payout ratio reached 37.31%. The year before the numbers were 0.84% and 46.74% correspondingly. See high-dividend stocks and find more opportunities for your portfolio.
As of Jul 21, 2026, the company has 64.94 K employees. See our rating of the largest employees — is adidas AG on this list?
EBITDA measures a company's operating performance, its growth signifies an improvement in the efficiency of a company. adidas AG EBITDA is 3.23 B EUR, and current EBITDA margin is 12.46%. See more stats in adidas AG financial statements.
Like other stocks, ADS shares are traded on stock exchanges, e.g. Nasdaq, Nyse, Euronext, and the easiest way to buy them is through an online stock broker. To do this, you need to open an account and follow a broker's procedures, then start trading. You can trade adidas AG stock right from TradingView charts — choose your broker and connect to your account.
Investing in stocks requires a comprehensive research: you should carefully study all the available data, e.g. company's financials, related news, and its technical analysis. So adidas AG technincal analysis shows the neutral today, and its 1 week rating is buy. Since market conditions are prone to changes, it's worth looking a bit further into the future — according to the 1 month rating adidas AG stock shows the neutral signal. See more of adidas AG technicals for a more comprehensive analysis.
If you're still not sure, try looking for inspiration in our curated watchlists.