GBP/USD Bullish Rebound from Trendline SupportGBP/USD is testing a strong ascending **support trendline** after a recent pullback. The chart shows a bullish **BOS (Break of Structure)** and an **Order Block (OB)** providing additional support. If price holds the trendline and buyers step in, the next **target is around 1.34510**, with **1.34360
British Pound / U.S. Dollar
No trades
No trades
Compare with GBP to USD
Details
GBPUSD, often referred to as “The Cable”, a foreign exchange term used to describe the British pound vs the US dollar, is one of the oldest traded currency pairs. In July of 1866, after an earlier failed attempt, the first reliable exchange rate between the British pound and the US dollar was transmitted between the London and New York Exchanges. Optic fibre cables accompanied by satellites handle the Transatlantic communications today.
GBPUSD Daily / Weekly CLS - Model 1Hi Friends, New CLS Range has been created and Im looking for Long Model 1 trade setup. As always after the manipulation in to the Key Level, below the CLS range and reaction, we need to see a confirmation switch from the manipulation phase - CIOD (change in order flow) in the the expansion.
⏳ S
GBPUSD Buy Opportunity | Bullish Continuation Toward 1.35600The chart shows a strong impulsive bullish move that created a Higher High (HH) around 1.35600.
After reaching the high, price entered a corrective phase, forming a series of Higher Lows (HL) while retracing into a major demand area.
Despite the pullback, the overall higher-timeframe bullish struc
GBPUSD - Under Pressure & Bearish Momentum (21.07.2026)FX:GBPUSD has confirmed a bearish breakdown from its rising intraday channel after failing to sustain above the highlighted resistance zone around 1.3462–1.3483. Price rejected the breakout retest and is now showing signs of renewed selling pressure, suggesting bears remain in control. A sustained
GBPUSD: Structural Breakdown Below Key Support & TrendlineGBPUSD: Structural Breakdown Below Key Support & Trendline 📉
Description:
GBPUSD has printed a definitive bearish displacement on the 3h timeframe. After spending considerable time oscillating inside the marked "SUPPORT" accumulation zone, the market experienced a strong influx of institutional sel
GBPUSD: H4 Liquidity Trap--Dump AheadGBPUSD has rallied into a major H4 liquidity pool, but the real question is whether buyers have enough fuel to sustain the breakout.
Price is currently testing higher-timeframe liquidity while a NWOG sits below. Although NWOGs often attract price, I won't trade solely because of that. If my liquidi
GBP/USD bullish Breakdown from support GBP/USD has confirmed a bearish market structure after breaking below the rising trendline and failing to hold above previous support. The rejection from the swing high created strong selling pressure, pushing price toward a key demand zone around **1.3260–1.3270**.
This support area could attract
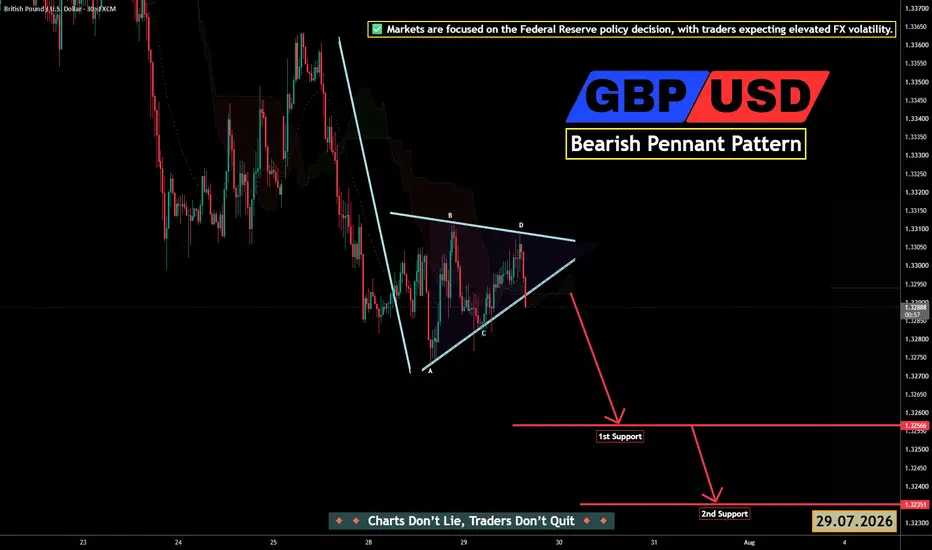
GBP/USD Under Pressure Ahead of Fed Decisions as USD StrengthDollar Holds Firm Ahead of Fed Decision – Investors remain cautious before the FOMC announcement, with policy expectations keeping the U.S. Dollar broadly supported.
FX:GBPUSD
GBP/USD is trading inside a classic Bearish Pennant, a continuation pattern that formed after a strong impulsive decli
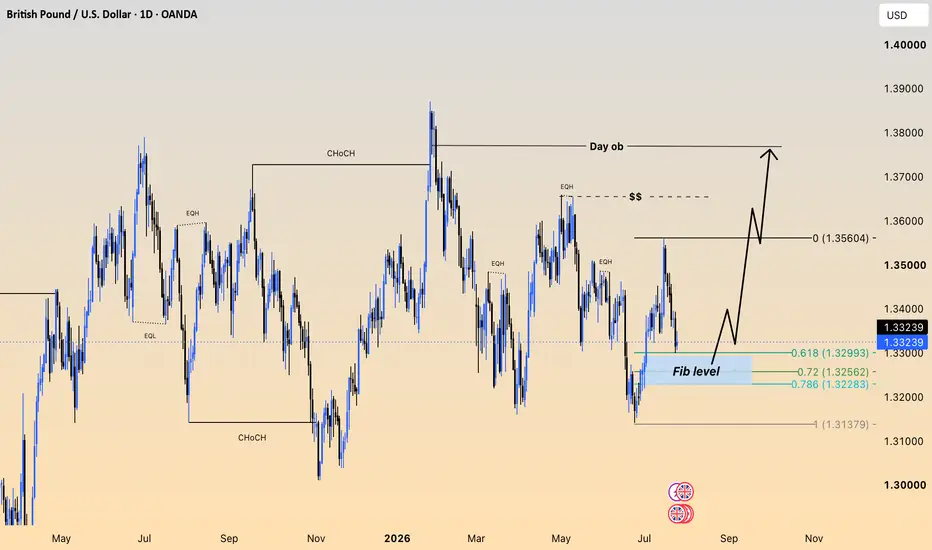
GBPUSD Daily Analysis: Premium Buy Zone Targets Higher HighsGBPUSD is trading within a high-confluence Fibonacci retracement zone (0.618–0.786), which aligns with a strong daily support area. The recent pullback appears to be a healthy correction within the broader bullish structure, increasing the probability of a continuation to the upside.
If buyers defe
GBP/USD Bearish Momentum Builds as Key Support Comes Into FocusGBP/USD remains under strong bearish pressure after failing to hold above the previous trading range. Sellers have regained control, and the pair continues to print lower highs and lower lows, confirming that the short-term trend is still bearish.
The recent decline is mainly driven by stronger U.S
See all ideas
Summarizing what the indicators are suggesting.
Oscillators
Neutral
SellBuy
Strong sellStrong buy
Strong sellSellNeutralBuyStrong buy
Oscillators
Neutral
SellBuy
Strong sellStrong buy
Strong sellSellNeutralBuyStrong buy
Summary
Neutral
SellBuy
Strong sellStrong buy
Strong sellSellNeutralBuyStrong buy
Summary
Neutral
SellBuy
Strong sellStrong buy
Strong sellSellNeutralBuyStrong buy
Summary
Neutral
SellBuy
Strong sellStrong buy
Strong sellSellNeutralBuyStrong buy
Moving Averages
Neutral
SellBuy
Strong sellStrong buy
Strong sellSellNeutralBuyStrong buy
Moving Averages
Neutral
SellBuy
Strong sellStrong buy
Strong sellSellNeutralBuyStrong buy
Displays a symbol's price movements over previous years to identify recurring trends.
Frequently asked questions
The current rate of GBPUSD is 1.33275 USD — it has increased by 0.30% in the past 24 hours. See more of GBPUSD rate dynamics on the detailed chart.
The value of the GBPUSD pair is quoted as 1 GBP per x USD. For example, if the pair is trading at 1.50, it means it takes 1.5 USD to buy 1 GBP.
The term volatility describes the risk related to the changes in an asset's value. GBPUSD has the volatility rating of 0.51%. Track all currencies' changes with our live Forex Heatmap and prepare for markets volatility.
The GBPUSD showed a −0.29% fall over the past week, the month change is a 0.98% rise, and over the last year it has decreased by −0.16%. Track live rate changes on the GBPUSD chart.
Learn how you can make money on rate changes in numerous trading ideas created by our community.
GBPUSD is a major currency pair, i.e. a popular currency paired with USD.
Currencies are usually traded through forex brokers — choose the one that suits your needs and go ahead. You can trade GBPUSD right from TradingView charts — just log in to you broker account. Check out the list of our integrated brokers and find the best one for your needs and strategy.
When deciding to buy or sell currency one should keep in mind many factors including current geopolitical situation, interest rates, and other. But before plunging into a deep research, you can start with GBPUSD technical analysis. The technical rating for the pair is sell today, but don't forget that markets can be very unstable, so don't stop here. According to our 1 week rating the GBPUSD shows the sell signal, and 1 month rating is buy. See more of GBPUSD technicals for a more comprehensive analysis.