GBPUSD Daily CLS Model 1 neste In the Weekly CLSHi Friends, New CLS Range has been created and Im looking for short Model 1 trade setup. As always after the manipulation in to the Key Level, below the CLS range and reaction, we need to see a confirmation switch from the manipulation phase - CIOD (change in order flow) in the the expansion.
⏳ Stay patient and enter only after candle close.
🎯 Target: 50% of the CLS range.
🎥 CLS Model 1 Video Explanation 📚 Bearish CLS Strategy Structure ⚠️ Risk Control is Key to Long Term Success
📍 Always place a proper stop loss
📍 Manage your risk per trade
📍 Stay disciplined & avoid emotional trading
📍Take the Trade only if you understand logic behind it
📍 Protect Capital First
🚀Boost | 🔁 Share | 💬 Comment | ✅Follow for more CLS setups
Adapt useful, Reject useless and add what is specifically yours.
David Perk
🚀Boost | 🔁 Share | 💬 Comment | ✅Follow for more Education
In-depth trading ideas
GBPUSD: Bearish Delivery LoadingGBPUSD has rejected from the upper supply area and is now showing clear bearish displacement.
Price has broken down from the recent consolidation, with the next major draw sitting at the stacked sell-side liquidity levels below.
Trade Thesis
• Bearish rejection from the premium zone
• Momentum shifting lower after the recent expansion
• Multiple SSL pools remain below
• 1st draw around 1.3453
• Deeper liquidity targets around 1.3433 and 1.3427
• Ultimate downside objective near 1.3418
The preferred path is a retracement into the marked zone before continuation lower.
Liquidity first. Confirmation second. Execution third.
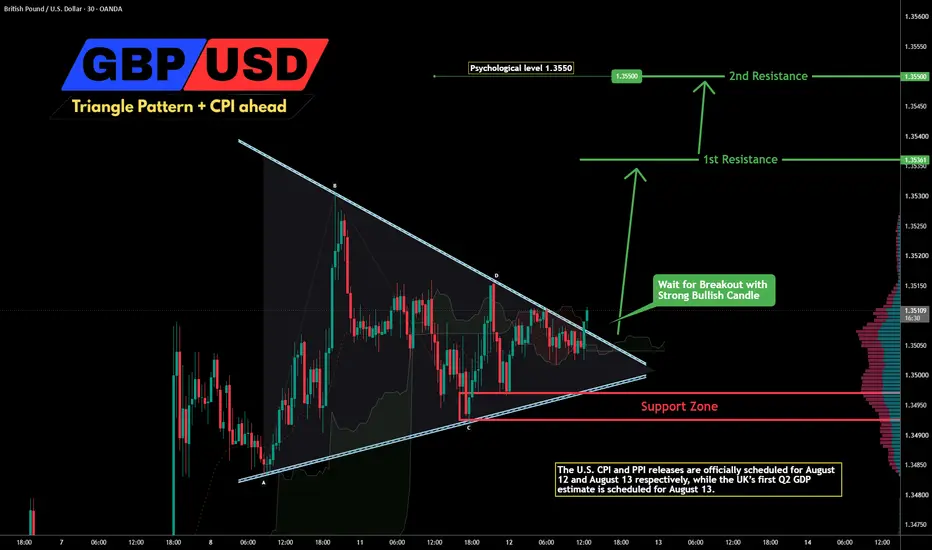
GBP/USD - Triangle Pattern + CPI ahead (12.08.2026)GBP/USD – M30 – Triangle Breakout Pattern OANDA:GBPUSD
GBP/USD is forming a tightening triangle with price consolidating near 1.3500. The bullish entry is triggered by a strong M30 candle, confirming a breakout of the descending trendline and opening the way toward the 1.3550 psychological level.
--------------------------------------
✅Key levels & invalidation
1st Resistance: 1.35361
2nd Resistance: 1.35500
Support Zone: 1.3493–1.3497
Invalidation: A sustained M30 close below 1.3493 would invalidate the bullish breakout setup and shift the structure back toward bearish pressure.
----------------------------------------
✅Macro Updates : (12.08.2026)
Dollar remains in focus ahead of CPI — the upcoming inflation data is helping keep GBP/USD volatility contained around the triangle breakout area.
--------------------------------------
Disclaimer
This analysis is provided for educational and informational purposes only and does not constitute financial advice.
----------------------------------------
✅Off to you
The setup looks constructive, but the breakout may depend heavily on the U.S. CPI reaction. What is your bias on GBP/USD ahead of the data?
GBPUSD – H2 – BearishGBPUSD – H2 – Bearish Rejection & Support Breakdown Setup
GBPUSD is currently trading around 1.35264 after a strong bullish move toward the marked Resistance Zone at 1.35600–1.35670. The current structure suggests a possible rejection from this upper zone.
If price fails to break and sustain above the resistance area, bearish pressure may develop and push GBPUSD toward the marked support levels.
If Bearish Structure Holds
🔴 1st Support: 1.34507
🔴 2nd Support: 1.33998
🟢 Resistance Zone: 1.35600–1.35670
Market Structure Insight
The current H2 structure shows a potential bearish rejection near the resistance zone. A confirmed rejection followed by weakness below the current structure could trigger a corrective move toward 1.34507.
If sellers gain further control and 1.34507 breaks decisively, the next downside area comes into focus around 1.33998.
On the other hand, a strong breakout and sustained price action above 1.35670 would invalidate the bearish setup and could support further bullish continuation.
⚠️ Disclaimer: This analysis is for educational purposes only. Always wait for confirmation before entering a trade and apply proper risk management.
GBPUSD is Nearing a Strong Support!Hey Traders, in today's trading session we are monitoring GBPUSD for a buying opportunity around 1.34700 zone, GBPUSD is trading in an uptrend and currently is in a correction phase in which it is approaching the trend at 1.34700 support and resistance area.
Trade safe, Joe.
GBPUSD Potential Downsides!Hey Traders, in today's trading session we are monitoring GBPUSD for a selling opportunity around 1.35400 zone, GBPUSD is trading in a downtrend and currently is in a correction phase in which it is approaching the trend at 1.35400 support and resistance area.
Trade safe, Joe.
GBPUSD BULLISH STRUCTURE UPSIDE GBPUSD is currently showing a strong bullish market structure on the 1H chart, with price maintaining a sequence of Higher Lows (HLs) and continuing to print Breaks of Structure (BOS). The recent breakout above the 1.3550–1.3560 area keeps buyers in control, while the bullish trend line continues to support the broader upside structure.
📊 MARKET STRUCTURE:
The chart shows repeated Higher Lows followed by bullish Breaks of Structure, confirming continued buying pressure. Price has also respected the bullish trend line after previous liquidity sweeps, suggesting that sellers have struggled to maintain downside momentum. As long as the latest HL and demand area remain protected, the broader structure favors further upside continuation.
🟢 STRONG BULLISH DEMAND:
The 1.3490–1.3500 region remains an important demand/support area. A pullback into this zone could provide an opportunity for buyers to defend the bullish structure. The nearby Fair Value Gap also acts as an important area to monitor for a controlled retracement before another upside attempt.
📈 BREAKOUT & LIQUIDITY:
GBPUSD has recently pushed above the previous swing-high area, creating a fresh bullish BOS. The chart also shows a liquidity sweep around the recent highs. If price holds above the breakout region and continues forming Higher Lows, the market can potentially target the next buy-side liquidity levels.
🚀 UPSIDE TARGETS:
Target 1 → 1.3571
Target 2 → 1.3585
Target 3 → 1.3604
A sustained breakout and candle close above 1.3570–1.3585 could strengthen the bullish continuation setup and open the path toward the 1.3600+ area.
📰 GBPUSD FUNDAMENTALS / NEWS:
The current bullish tone is also supported by broader U.S. Dollar weakness. Recent softer U.S. economic data, including weaker retail sales and declining consumer sentiment, has reduced expectations for an imminent Federal Reserve rate hike, putting pressure on the Dollar.
At the same time, the Pound has received support from resilient UK economic data and increasing expectations that the Bank of England could maintain a relatively firm policy stance. Markets are now watching upcoming UK employment and inflation data closely, which could provide the next major catalyst for GBPUSD.
your support means a lot! Drop a ❤️ Like & 💬 Comment if you’re enjoying the analysis — let’s grow together! 🚀📊
GBPUSD BOTH STRUCTURE & UPSIDE POTENTIALGBPUSD is currently showing a bullish market structure on the 1H timeframe, with buyers maintaining control after a series of Higher Lows (HL) and previous Breaks of Structure (BOS). Price has recently pushed strongly upward from the support area and is now approaching an important resistance/liquidity zone.
📊 MARKET STRUCTURE:
The chart shows a clear sequence of Higher Lows (HL) followed by bullish Breaks of Structure (BOS), indicating that buyers have been active throughout the recent move. The latest bullish expansion suggests that momentum is currently favoring the upside.
However, GBPUSD is now testing a key resistance area, so a short-term rejection or pullback should also be monitored before the next major move.
🟢 DEMAND ZONE:
The 1.3495–1.3505 region is an important demand zone. If price retraces into this area and buyers defend it, GBPUSD could use the zone as a base for another bullish continuation a deeper support level is located around 1.3484, while 1.3460 is the next major downside support.
🔴 RESISTANCE & LIQUIDITY:
The 1.3538–1.3545 region is the key resistance/liquidity zone visible on the chart. Price has already shown strong momentum toward this area a clean breakout and 1H candle close above resistance could confirm further bullish continuation and expose the higher liquidity zone around 1.3555–1.3560.
🎯 UPSIDE TARGETS:
Target 1 → 1.3545
Target 2 → 1.3555
Target 3 → 1.3560+ — Higher Liquidity
If GBPUSD fails to break the resistance zone and gets rejected, price may retrace toward 1.3500 demand. A bearish break below 1.3484 would weaken the immediate bullish structure and could expose 1.3460 support.
your support means a lot! Drop a ❤️ Like & 💬 Comment if you’re enjoying the analysis — let’s grow together! 🚀📊
GBPUSD - Pre-breakout consolidation before distribution FX:GBPUSD is testing a strong resistance level. The bearish reaction is weakening, while a decline in the DXY could create an opportunity for further upside
The Dollar Index looks relatively weak after the bullish structure was broken. Further weakness in the dollar could support the medium-term outlook for the currency pair.
The fundamental backdrop remains relatively favorable for the British pound. A pre-breakout base is forming below the key resistance zone established on the D1–W1 timeframe.
A close above 1.3558 could trigger an impulsive move toward 1.3650
Resistance levels: 1.3558, 1.3650
Support levels: 1.3506, 1.3420
The local trend is bullish, and the market continues to test resistance persistently despite relatively low volatility.
If the bulls manage to break above the level and hold above it, the market could have room for further upside
Best regards,
R. Linda
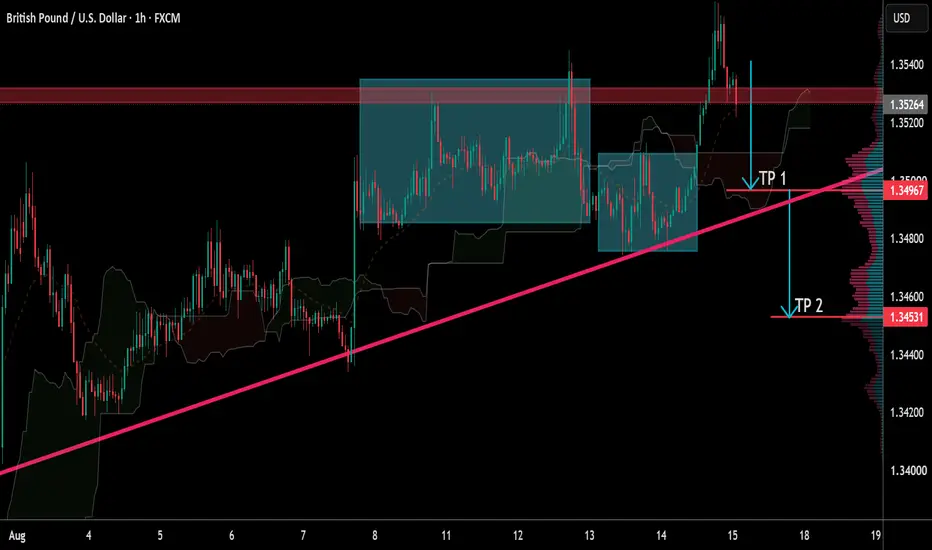
GBP/USD Bullish Pullback SetupGBP/USD is holding above a rising trendline, maintaining a bullish structure despite the recent rejection from the **1.3530–1.3540 resistance zone**. The chart suggests a pullback toward the trendline/support area could provide a continuation opportunity if buyers defend the structure.
**🎯 Target 1:** 1.34967
**🎯 Target 2:** 1.34531
A sustained move below the rising trendline would weaken the bullish setup.
GBPUSD GBPUSD is currently trading around the 1.3485 area and sitting at an important decision point. The chart shows a clear bullish market structure, with buyers maintaining higher lows and continuing to defend key support areas. Price is currently consolidating below the 1.3550 resistance, where sellers have previously stepped in.
The overall structure remains constructive as long as GBPUSD continues to respect the 1.3400 support area and maintains the sequence of higher lows. The previous Break of Structure (BOS) and subsequent Change of Character (ChoCh) support the idea that buyers have gained short-term control.
📈 BULLISH SCENARIO — UPSIDE CONTINUATION
If GBPUSD holds above the 1.3450–1.3470 short-term support area and buyers successfully reclaim the 1.3500–1.3550 zone with strong candle confirmation, bullish momentum could strengthen.
📉 BEARISH SCENARIO — REJECTION & CORRECTION
On the other hand, if GBPUSD repeatedly fails to break the 1.3550–1.3580 resistance zone and begins forming strong bearish rejection candles, a short-term correction could develop.
A rejection from this area may send price back toward the 1.3450–1.3470 bearish FVG/support area. If selling pressure increases, the deeper 1.3400 support becomes the next important level to watch.
⚠️ MARKET VIEW
As long as GBPUSD continues to respect the higher-low structure and holds above the 1.3400 support, the bullish scenario remains favored.
If you found this XAUUSD analysis useful, support the idea with a 👍 and share your market view in the comments — your feedback is appreciated!
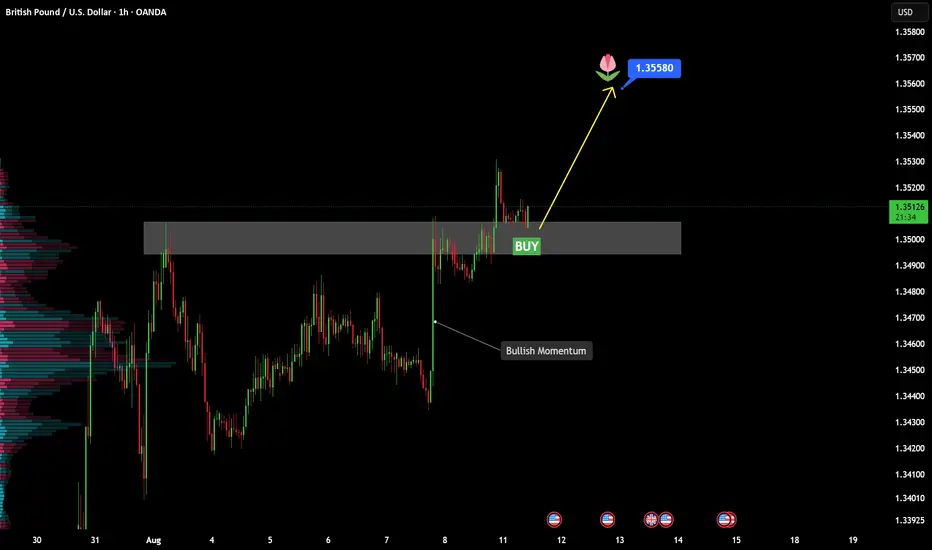
GBPUSD Upside ContinuationFirst, after the recent swings, GBPUSD started to settle into a tighter range. Price was moving back and forth around the same area, with no clean continuation in either direction.
Now look at the zone marked on the chart. It had acted as resistance several times before, repeatedly stopping buyers from pushing higher. That history makes the latest reaction much more important.
This time, however, price approached the level with stronger bullish pressure. Buyers kept pressing into resistance until the market finally broke through. More importantly, price has now come back to test the same area and is still holding above it.
That changes the picture. Former resistance is beginning to behave like new support, and as long as buyers continue to defend this zone, I would favor another move higher toward 1.35580.
The key now is simple: the breakout has happened, the retest is holding, and buyers still have the stronger hand.
GBPUSD at Resistance — Bearish Move AheadGBPUSD Bearish Reversal Setup — Resistance Rejection & Downside Targets 📉
GBPUSD is currently testing a key resistance area around 1.3550–1.3560 after a strong bullish recovery. Price is forming a potential weak high near resistance, making this an important decision zone. A clear rejection followed by a bearish structure break could open the way toward the marked target zone around 1.3413.
📌 Key Points:
• 1.3550–1.3560 is the main resistance/supply zone.
• Price is testing a previous high and showing a potential weak-high formation.
• A bearish rejection from resistance could favor sellers.
• Watch for a break below nearby support around 1.3520–1.3500 for confirmation.
• The main downside target is around 1.3413.
• Strong bearish candles and increasing selling volume would strengthen the setup.
🔴 Bearish Scenario:
If GBPUSD fails to break above 1.3550–1.3560 and produces a clear rejection, sellers could gain control. A break below 1.3520–1.3500 may accelerate the decline toward 1.3450, followed by the main target zone around 1.3413. Further weakness below 1.3413 could expose deeper support near 1.3350–1.3300.
🎯 Bearish Targets:
• TP1: 1.3500
• TP2: 1.3450
• TP3: 1.3413
• Extended target: 1.3350–1.3300
🟢 Bullish Scenario:
If buyers successfully break above 1.3560 and hold the price above the resistance zone, the bearish setup would weaken or become invalid. A clean breakout and retest could signal continuation of the bullish trend, with price potentially moving toward fresh highs.
🎯 Bullish Targets:
• 1.3600
• 1.3650
• Higher levels if momentum remains strong
📊 Trading Perspective:
The 1.3550–1.3560 area is the key decision zone. Rather than chasing a sell directly at resistance, traders can wait for confirmation through a rejection candle, lower-timeframe structure shift, or a break below nearby support. A breakout above resistance would require reassessing the bearish idea.
⚠️ Risk Management:
Keep risk controlled and avoid oversized positions around major resistance because false breakouts are possible. For a bearish setup, invalidation can be considered above the confirmed resistance/weak-high area. Always wait for price-action confirmation before entering.
Overall, GBPUSD remains at a critical resistance zone. A rejection from 1.3550–1.3560 could favor a bearish move toward 1.3413, while a strong breakout and hold above resistance could shift momentum back toward the buyers. 📉📈
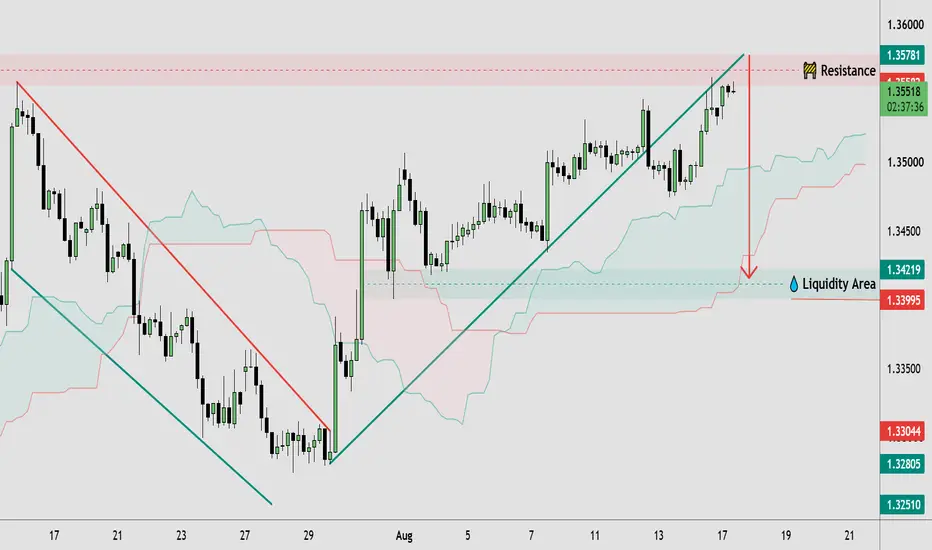
GBPUSD: Resistance Test & Liquidity Pullback Setup🔹 GBPUSD is showing a clear recovery structure, with price forming higher highs and higher lows while respecting the rising trendline. The current move is approaching a marked resistance zone around 1.3570–1.3580, where price appears to be facing potential selling pressure. The structure remains constructive while price holds above the recent higher-low area, but the resistance zone could become important for the next directional move. The highlighted liquidity area around 1.3420 also remains a key reference if price starts to retrace.
🔸 If GBPUSD breaks and holds above the resistance zone, the bullish structure could remain supported and further upside may develop after confirmation. However, rejection from this area could lead to a corrective move toward lower support and the marked liquidity zone. Traders may wait for clear price confirmation around resistance before considering any trade, while a failure of the rising structure could signal a deeper pullback. This GBPUSD price action setup highlights the importance of market structure, resistance, support, breakout confirmation, and liquidity.
This analysis is for educational purposes only and does not constitute financial or investment advice. Always conduct your own research before making trading decisions.
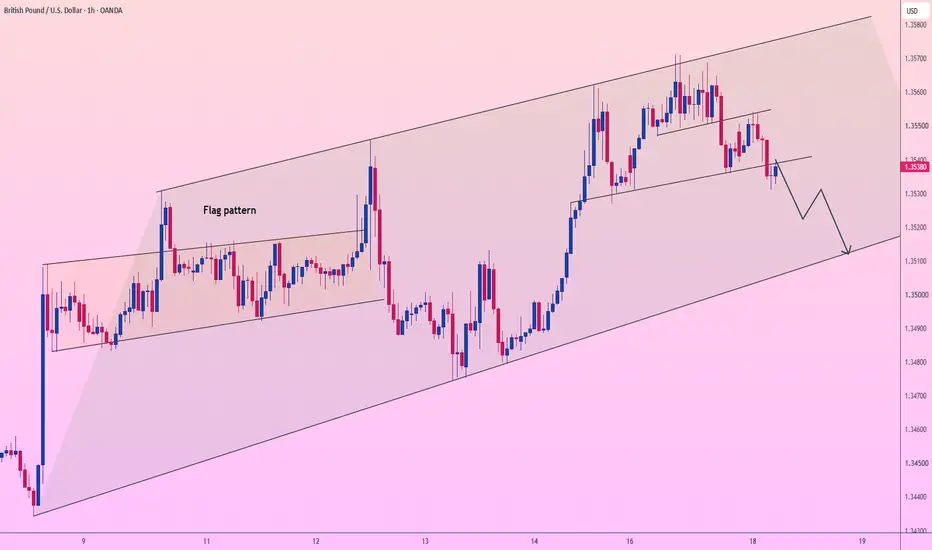
GBP/USD: THE 1.35100 FLAG BREAKDOWN FLUSH!
Testing lower flag support near 1.35375! Are you panic-buying this minor pause, or positioning for the multi-wave drop to the 1.35100 channel floor? 🤔
The British Pound is breaking down from a localized consolidation channel on this 1-hour OANDA chart. GBP/USD is trading around 1.35375, slicing below its recent bear flag structure and gathering downside momentum after failing to sustain higher levels within the larger ascending channel. 📉💥
Look closely at the black blueprint trajectory mapping out the coming sessions. The algorithm projects a classic multi-wave breakdown and markdown sequence:
• A localized impulse drop pushing price down toward the 1.35200 region. ⚡
• A brief reflex retest bouncing back up toward 1.35300 - 1.35350 to test broken flag support as new resistance. 🪤
• Final acceleration flush driving straight down to test the primary lower trendline support of the macro channel near 1.35100. 🎯🔻
Maintaining technical patience and discipline remains your ultimate edge in this setup. Trying to force long positions directly following a fresh breakdown below local channel support is an easy way to get caught on the wrong side of institutional distribution. Professional desks wait for any relief bounce into broken support to exhaust before scaling into short positions alongside the primary markdown flow. 🧘♂️⚡
🛠 Trade Parameters:
🛒 Short Zone: 1.35300 - 1.35400 🧱
🛑 Stop-Loss: 1h close above 1.35550 ❌
💰 Take-Profit: 1.35100 🩸
The retail crowd attempting to buy this breakdown is driving price straight into institutional sell orders. Stay focused, strictly manage your risk, and let the algorithm carry the trade down to our target floor.
Maintain your composure through the waves, and we will see you down at the 1.35100 support floor! 🚀💎
GBP/USD — SELLING PRESSURE & WEDGE BREAKDOWNGBP/USD is showing increasing short-term selling pressure after repeatedly failing to sustain a move above the 1.3520–1.3525 resistance zone. Price pushed higher into this supply area but faced strong rejection, leaving a clear sign that sellers are still defending the upper levels.
Tecnically major event today was the U.S. CPI release. Ahead of the release, traders were positioning cautiously around GBP/USD and the 1.3500 psychological level. The latest U.S. CPI data came broadly in line with expectations and initially weakened the USD, meaning the fundamental picture does NOT currently provide a simple reason to chase GBP/USD shorts.
The repeated rejection from the upper resistance, combined with the developing wedge structure, keeps the short-term setup under pressure. However, traders should watch for confirmation rather than assuming every rejection will immediately lead to a large drop.
Resistance zone ; 1.35250 / 1/35400
Support Levels ; 1.34513 / 1.34204
Therefore, the bearish idea is primarily based on the technical rejection and price structure shown on this chart. If GBP/USD fails to reclaim 1.3511–1.3525 and sellers maintain control below 1.3490, the downside levels around 1.3451 and 1.3420 remain important areas to watch.
Hope you found this analysis helpful. 👍
Like, Comment & Follow for more updates. Trade safe.
GBPUSD Sterling strength continue 1.13650 Next resistance GBP/USD continues to maintain a bullish market structure, with price repeatedly forming higher lows and respecting the ascending trendline. The pair has now broken above the 1.3500–1.3515 trading range, turning this previous resistance area into an important potential support zone.
The repeated movement toward the upside is not only technical. Fundamentally, the pound is receiving support from resilient UK economic data and expectations that the Bank of England may need to maintain a relatively firm interest-rate stance, while the U.S. dollar has recently weakened as markets reduce expectations for an imminent Federal Reserve rate hike.
Recent UK GDP data showed stronger-than-expected growth, while softer U.S. retail sales, employment and inflation signals have caused traders to scale back Fed tightening expectations. This combination is currently creating a favorable environment for GBP/USD.
Key Levels ;
Resistance Levels ; 1.136000 / 1.36500
Support levels ; 1.35250 / 1.35000
Technical Outlook
The key level on the chart is 1.3515. As long as price holds above this breakout zone and the rising trendline remains intact, the bullish structure remains valid. However, traders should watch the 1.3500–1.3515 zone closely. A decisive move back below this area could indicate a false breakout and lead to a deeper retracement toward the ascending trendline.
Hope you found this analysis helpful. 👍
Like, Comment & Follow for more updates. Trade safe.
GBPUSD: Bearish Outlook Explained 🇬🇧🇺🇸
GBPUSD tested a major daily supply zone yesterday.
We see a valid bullish trap and a formation of a double-top pattern on an hourly time frame.
I expect a pullback from the underlined area.
Goal - 1.3514
❤️Please, support my work with like, thank you!❤️
I am part of Trade Nation's Influencer program and receive a monthly fee for using their TradingView charts in my analysis.
GBPUSD: Bullish Expansion LoadingGBPUSD is reacting from a well-defined M15 demand / reaction zone after the recent sell-side displacement.
Price has reclaimed the zone and is attempting to build a bullish continuation structure. The current setup favors a move toward the stacked buy-side liquidity above.
Trade Thesis
• Price holding inside the marked reaction zone
• Recent downside liquidity has been absorbed
• Bullish reaction developing from the 1.3540 area
• Upside liquidity remains clearly visible
• 1st target: ~1.3565
• 2nd target: ~1.3568
• Final target: ~1.3572+
The preferred path is reaction → displacement → retracement → continuation into BSL.
If the zone holds, the upside liquidity becomes the obvious draw. No need to chase the first impulse.
Let price confirm. Then execute.
Not financial advice. Manage risk accordingly.
GBPUSD 1H: BULLISH CHANNEL BREAKOUT — 1.36327 IN SIGHTGBPUSD 1H: BULLISH CHANNEL BREAKOUT — 1.36327 IN SIGHT
GBPUSD is holding above the 1.3545 support area while trading inside a rising channel. The latest bullish push suggests buyers are defending the structure and attempting to extend the upside.
📈 BULLISH SCENARIO
🎯 Target 1: 1.36000
🎯 Target 2: 1.36327
📉 BEARISH INVALIDATION
A 1H close back below 1.3545 would weaken the bullish structure and increase the risk of a pullback toward the lower channel.
KEY LEVELS
Resistance: 1.36327
Support: 1.3545
Structure: Rising Channel
Invalidation: Below 1.3545
GBP/USD | Sellside or buyside sweep, which will happen first?By analyzing the 4H chart of GBPUSD we can see that after it swept away the Buyside Liquidity above the 1.3558 level, and then going as high as 1.3571, which was a bit higher than the 4H FVG C.E., it dropped and is now being traded at around 1.3523 level.
I expect further drop for GBPUSD and I'd like to see it drop below the 1.3474 level to sweep the liquidity there and then try to continue its bullish run. Geopolitical tensions also play a high role. If the war restarts once more, we could see GBPUSD drop even lower than.
Targets: 1.3510, 1.3500, 1.3490 and 1.3480.
If GBPUSD bounces back up from the old supply zone it had previously overcome, we could see it go towards the 1.3571 level to sweep the minor buyside liquidity there and then go towardsthe 1.36 psychological level level.
GBPUSD Price Update – Clean & Clear ExplanationGBP/USD is currently trading around 1.3510 after a strong bullish recovery from the 1.3440–1.3450 area. Price has pushed above previous resistance and is now consolidating around 1.3505–1.3515, showing that buyers are still active but the market is approaching an important resistance zone.
The key area to watch is 1.3520–1.3540. If price moves into this zone and faces rejection, we could see a pullback toward 1.3485, followed by 1.3465 and potentially 1.3440. The chart structure suggests that a rejection from the upper resistance could create a stronger bearish correction.
However, if GBP/USD breaks and holds above 1.3540, the bearish setup would weaken and buyers could continue pushing toward higher levels Overall, 1.3520–1.3540 is the main decision zone. Price reaction there will be important for determining the next major direction.
Your support means a lot! If you found this analysis useful, leave a Like and tell me your thoughts in the comments. Best of luck with your trading journey! 🚀