#GLMR/USDT - Buyers Are Here!#GLMR
The price is moving within a descending channel on the 1-hour timeframe and has reached the lower boundary. It is now poised for a bounce and is expected to retest this boundary.
The Relative Strength Index (RSI) indicates a downward trend, which is likely to continue given the overbought conditions.
There is a key support zone in green at 0.0080. The price has bounced off this zone several times, making it a strong support level.
The price is trending towards the 100-period moving average, which we are approaching. This trend supports an upward move.
Entry Price: 0.0087
Target 1: 0.0091
Target 2: 0.0096
Target 3: 0.0101
Stop Loss: At the resistance zone in green
Remember this simple rule: Money management.
Any questions? Please leave a comment.
Thank you.
In-depth trading ideas
๏ปฟGlimmer (GLMR): 2,600% in 2027, Up to 7,000% Long-TermApril 2026 saw the highest buy-volume ever after a long-term all-time low double-bottom. More recently, GLMRUSDT pierced support and is now looking to recover. This project is trading within the extreme opportunity buy-zone.
The bear market trend here lasted two years, March 2024 through March 2026. This same time window is also present on many projects.
After the confirmation of the October 2025 atl in March, the market produced one more flush and went below support, a stop-loss hunt event. This event can also be read as a triple-bottom and the start of a change of trend.
The RSI hit bottom in March while in June we have a lower low on GLRMUSDT, here a several months long bullish divergence is present and this signal supports a change of trend.
The MACD bottomed August 2024 with a higher low in March 2025 and it has been rising since. This one gives us a multiple years long bullish divergence which is a classic trend reversal signal.
Finally, we just have to look at marketwide action to ascertain if it is truly possible to see the market change course. Bitcoin has been recovering nicely after confirming a strong support zone and many altcoins have been growing for months.
All these signals put together, gives us a nice chance for a new wave of growth. The first target sits at $0.071 for a nice 600% profits potential. Long-term, there can be more, much more.
Thank you for reading.
Namaste.
#GLMRUSDT - Buyers Are Here!#GLMR
The price is moving within a descending channel on the 1-hour timeframe and has reached the lower boundary. It is now poised for a bounce and is expected to retest this boundary.
The Relative Strength Index (RSI) indicates a downward trend, which is likely to continue given the overbought conditions.
There is a key support zone (in green) at 0.0157. The price has bounced off this zone several times, making it a strong support level.
The price is trending towards the 100-period moving average, which we are approaching. This trend supports an upward move.
Entry Price: 0.0171
First Target: 0.0173
Second Target: 0.0178
Third Target: 0.0183
You can stop at the first and second targets and close the price, or continue towards the third target. Stop Loss: At the resistance zone (in green).
Remember this simple rule: Money Management.
Any questions? Please leave a comment.
Thank you.
#GLMR/USDT - Buyers Are Here!#GLMR
The price is moving within a descending channel on the hourly timeframe. It has reached the lower boundary and is heading towards a breakout, with a retest of the upper boundary expected.
The Relative Strength Index (RSI) is showing a downward trend, approaching the lower boundary, and an upward bounce is anticipated.
There is a key support zone in green at 0.0250, and the price has bounced from this level several times. Another bounce is expected.
The RSI is showing a trend towards consolidation above the 100-period moving average, which we are approaching, supporting the upward move.
Entry Price: 0.0262
Target 1: 0.0269
Target 2: 0.0281
Target 3: 0.0294
Stop Loss: Below the green support zone.
Remember this simple thing: Money management.
For any questions, please leave a comment.
Thank you.
GLMR ( SPOT - investment)GLMR/ USDT
The coin on the way to achieve big targets
Entry range (0.025- 0.030)
SL 1D close below 0.02 ( stop loss is very big so collect slowly or make stop loss smaller but with small time frames)
T1 0.050
T2 0.060
T3 0.080
T4 0.013
T5 0.016
3 optional extra targets on the chart
_______________________________________________________
Golden Advices.
********************
* collect the coin slowly in the entry range.
* Please calculate your losses before the entry.
* Do not enter any trade you find it not suitable for you.
* No FOMO - No Rush , it is a long journey.
#GLMR/USDT - Buyers Are Here!
#GLMR
The price is moving within a descending channel on the hourly timeframe. It has reached the lower boundary and is heading towards a breakout, with a retest of the upper boundary expected.
The Relative Strength Index (RSI) is showing a downward trend, approaching the lower boundary, and an upward bounce is anticipated.
There is a key support zone in green at 0.0233. The price has bounced from this level several times and is expected to bounce again.
The indicator is showing a trend towards consolidation above the 100-period moving average, which we are approaching, supporting the upward move.
Entry Price: 0.0235
First Target: 0.0242
Second Target: 0.0250
Third Target: 0.0258
Stop Loss: Below the green support zone.
Don't forget one simple thing: Money Management.
For inquiries, please leave a comment.
Thank you.
GLMR: A Full-Cycle Capitulation Setup With Asymmetric 8,000% UpsGLMR: A Full-Cycle Capitulation Setup With Asymmetric 8,000% Upside
The long-term technical structure of GLMR (Moonbeam) presents a textbook example of a full market cycle: euphoric launch, prolonged distribution, multi-year capitulation, and the early signals of structural reversal. This type of structure is rareโand historically, it is where the largest percentage moves originate.
1. Macro Downtrend Completion and Capitulation
After its initial listing, GLMR experienced an aggressive markdown phase, losing over 98% of its value from the all-time high. Price respected a well-defined descending channel for more than two years, producing a clean five-wave impulsive decline. This is critical: impulsive, orderly declines tend to exhaust sellers, unlike chaotic crashes.
The final leg of the downtrend (wave 5) terminates precisely at long-term channel support, accompanied by:
Extreme bearish sentiment
Compressed volatility
Price stalling despite continued negative bias
This behavior strongly suggests seller exhaustion and capitulation, not continuation.
2. Structural Break: The First Signal That the Trend Is Changing
The most important technical event is not the rally itselfโit is the loss of downside momentum.
Price is now pressing against the descending resistance trendline that has defined the entire bear market. A confirmed break and hold above this structure represents:
The first higher low on a macro timeframe
A regime shift from distribution to accumulation
The invalidation of the long-term bearish structure
Historically, assets that break multi-year descending channels often retrace 50โ80% of their entire bear market range.
3. RSI Compression and Bullish Divergence
On the weekly RSI, GLMR has formed:
A multi-year bullish divergence
RSI holding above long-term support while price makes marginal new lows
A flattening momentum structure consistent with early cycle reversals
This mirrors conditions seen in prior cycle bottoms across crypto markets, where momentum turns before price expansion.
4. Why an 8,000% Move Is Technically Rational (Not Hype)
The projected 8,000% upside targets the $1.80โ$2.00 region, which aligns with:
A major historical resistance zone
The midpoint of the prior distribution range
A full mean reversion within the broader market structure
From a technical standpoint, this move is not extraordinaryโit is a reversion to structural value after an extreme overcorrection.
When assets decline 95โ99%, they no longer require new narratives to rally. They only require:
Supply exhaustion
Time
A shift in market regime
At current levels, downside risk is structurally limited, while upside is mathematically asymmetric.
5. RiskโReward Asymmetry Favors Long-Term Positioning
At current prices:
Risk is defined and compressed near historical lows
Price is sitting at long-term demand
Upside targets are based on existing liquidity zones, not speculation
This is the type of setup where capital doesnโt chase confirmationโit positions early and waits.
Conclusion
GLMR is not being analyzed as a short-term trade, but as a full-cycle recovery candidate. The combination of:
Multi-year downtrend exhaustion
Structural compression
Momentum divergence
Channel breakout potential
creates the technical foundation for an 8,000% revaluation over the next macro expansion phase.
This is not a predictionโit is a probability-weighted technical outcome based on historical market behavior and structural analysis.
Moonbeam , an update Now I admit Idk what the hell is wrong with some projects, one of them is moonbeam which is headed down without stop ( price wise, donโt know much about the actual work ) it reacts nicely to the pitch fork with some adjustments , I really hope it starts to bounce from this point ngl if it doesnโt itโll be nasty and worse than what is it now , it has a small market while itโs a pioneer in Polkadot ecosystem which should be the reason for not being delisted yet , with all the background work from Polkadot I wonโt be surprised if we see polkadot season and glmr as one of the top gainers , like many other projects it launched in bad timing and holding it should be devastating up till now , I really hope itโs the last dip as I hope it for the whole Alt market.
GLMRUSDT Macro Downtrend Intact, Key Levels DefinedGLMRUSDT remains in a firm macro downtrend. The key Main Sell-off zone ($2-$2.61) is the primary resistance to watch for any short to mid-term rallies. Until that area is broken, the path of least resistance is down. The Area of Interest for a potential long-term bottom lies between $0.0.0219 to $0.039 watch for a confirmed bullish reversal there. A break below $0.0185 signals a continuation of the downtrend.
Moonbeam All-Time Low & Bullish ReversalโTrading 101 (PP: 1250%)GLMR (Moonbeam) has been trading at bottom prices and you know once we hit bottom, there is no other place left to go but up.
The all-time low happened in April 2025 and then we have a reversal pattern. The pattern is composed of lower highs and higher lows, the action converging and becoming compressed until finally a strong breakout happens.
We know the breakout will be bullish because of marketwide action. Ethereum (Ether) is trading at its highest price since December 2021. Bitcoin and XRP are trading at all-time highs and many of the strong projects are doing great. As the big projects grow, the smaller projects will follow. It is the natural sequence and how it always works.
GLMRUSDT has huge potential for growth as we are looking at true bottom prices. A ~1,250% target can be hit easily in the coming months. Another one around $0.66 gives 777%.
There is no need to use a stop-loss with this type of trade setup. Only one action is required here and that is to buy. After you buy, waiting comes naturally as nothing else can be done. When our target is reached; sell, collect profits and move on. Cryptocurrency Trading 101.
Namaste.
GLMR โ Coiling Up for a Move!
๐ On the Daily timeframe, SEED_DONKEYDAN_MARKET_CAP:GLMR is trading inside a symmetrical triangle, with price compressing toward the apex ๐บ
This kind of structure often leads to strong breakouts once momentum builds.
๐ Breakout or breakdown ahead? Stay sharp โ big move incoming!
Not financial advice.
#GLMR/USDT#GLMR
The price is moving within a descending channel on the 1-hour frame, adhering well to it, and is heading for a strong breakout and retest.
We have a bounce from the lower boundary of the descending channel. This support is at 0.0593.
We have a downtrend on the RSI indicator that is about to be broken and retested, supporting the upside.
There is a major support area in green at 0.0600, which represents a strong basis for the upside.
Don't forget a simple thing: ease and capital.
When you reach the first target, save some money and then change your stop-loss order to an entry order.
For inquiries, please leave a comment.
We have a trend to hold above the 100 Moving Average.
Entry price: 0.0634
First target: 0.0641
Second target: 0.0654
Third target: 0.0670
Don't forget a simple thing: ease and capital.
When you reach the first target, save some money and then change your stop-loss order to an entry order.
For inquiries, please leave a comment.
Thank you.
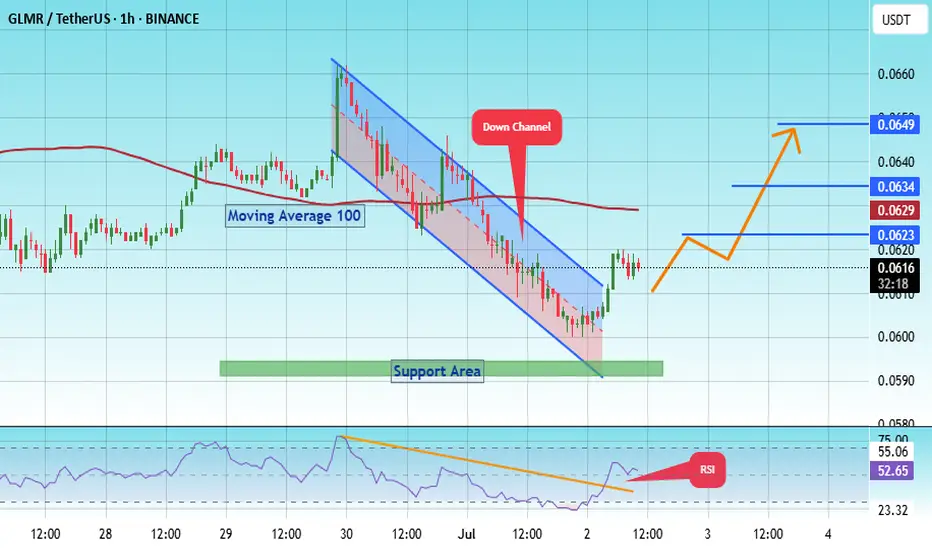
#GLMR/USDT - Buyers Are Here!#GLMR
The price is moving within a descending channel on the 1-hour frame, adhering well to it, and is heading for a strong breakout and retest.
We have a bounce from the lower boundary of the descending channel, this support at 0.0600.
We have a downtrend on the RSI indicator that is about to be broken and retested, supporting the upside.
There is a major support area in green at 0.0592, which represents a strong basis for the upside.
Don't forget a simple thing: ease and capital.
When you reach the first target, save some money and then change your stop-loss order to an entry order.
For inquiries, please leave a comment.
We have a trend to hold above the 100 Moving Average.
Entry price: 0.0615
First target: 0.0623
Second target: 0.0634
Third target: 0.0650
Don't forget a simple thing: ease and capital.
When you reach your first target, save some money and then change your stop-loss order to an entry order.
For inquiries, please leave a comment.
Thank you.
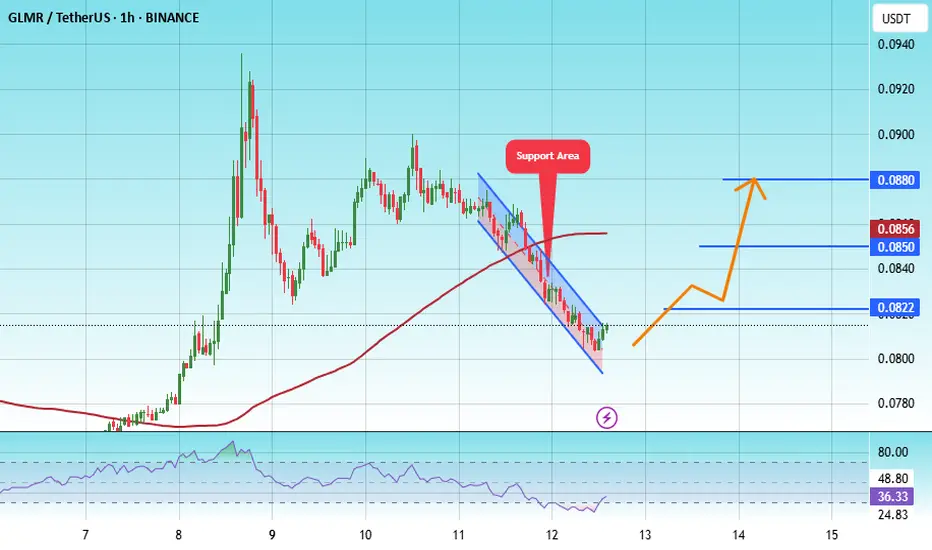
#GLMR/USDT#GLMR
The price is moving within a descending channel on the 1-hour frame, adhering well to it, and is heading towards a strong breakout and retest.
We are experiencing a rebound from the lower boundary of the descending channel. This support is at 0.0790.
We are experiencing a downtrend on the RSI indicator, which is about to break and retest, supporting the upward trend.
We are heading towards stability above the 100 Moving Average.
Entry price: 0.0800
First target: 0.0822
Second target: 0.0850
Third target: 0.0880
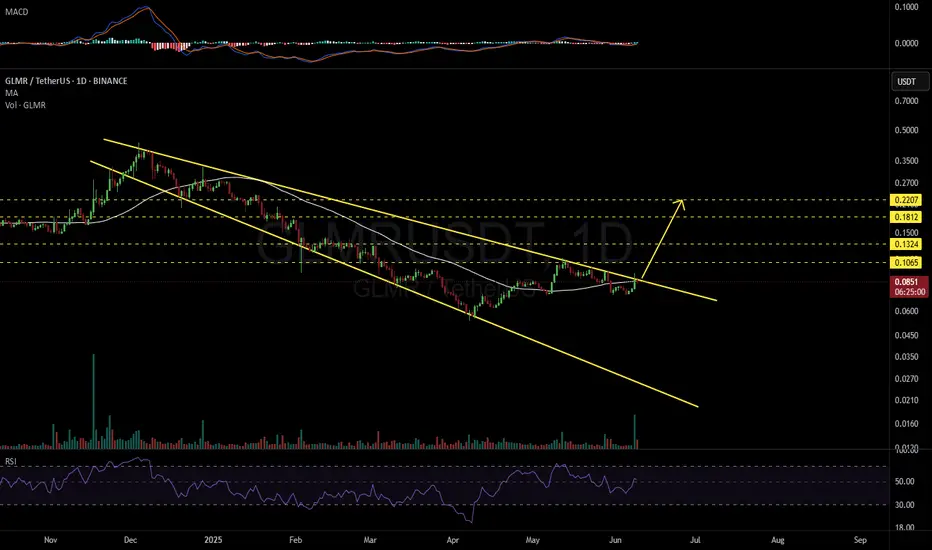
GLMRUSDT 1D#GLMR โ Breakout Loading? ๐
#GLMR is moving inside a Descending Broadening Wedge on the daily chart and is now on the verge of breaking above the wedge resistance and the daily MA50.
If a breakout confirms, watch for these bullish targets:
๐ฏ $0.1065
๐ฏ $0.1324
๐ฏ $0.1812
๐ฏ $0.2207
โ ๏ธ Always use a tight stop-loss to manage risk and protect your capital.
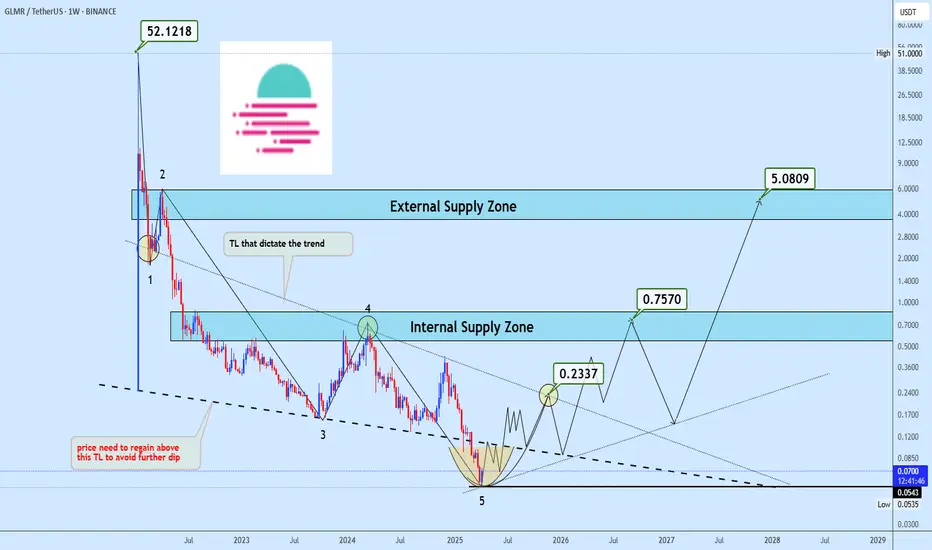
GLMR Bottomed? Watch This Key Trendline ReclaimGLMR has likely completed a full 5-wave impulsive decline, with the final leg extending after a clean deviation below the key trendline, printing a low at 0.0543. This marks a potential medium-term bottom. A corrective upside move is expected from this zone, though the broken trendline remains unreclaimed and now acts as resistance. The internal supply trendline around 0.2337 is critical โ price may face strong rejection here. However, a confirmed breakout above it could open the door toward 0.757, aligning with a broader supply zone.
GLMRUSDT - Buyers Are Here!Observing GLMRUSDT, one identifies a notable blue box on the chart. This area, in the estimation of a discerning investor, appears to function as a significant support level.
The principle here is straightforward: when an asset's price descends to a particular zone and consistently finds buying interest, preventing further decline, that zone establishes itself as a support. This blue box suggests a concentration of demand, where those who value the asset are prepared to acquire it.
While technical patterns are not the sole determinant of value, they can illuminate where market participants are accumulating positions. A sustained defense of this blue box, particularly if accompanied by a decrease in selling pressure or an uptick in buying volume, would reinforce its significance.
Conversely, a decisive breach of such a support level would necessitate a re-evaluation, as it would indicate a shift in the balance between supply and demand. However, for the present, this blue box stands as a point of interest for those seeking to understand the potential floor for GLMRUSDT's price action.
๐I keep my charts clean and simple because I believe clarity leads to better decisions.
๐My approach is built on years of experience and a solid track record. I donโt claim to know it all but Iโm confident in my ability to spot high-probability setups.
๐If you would like to learn how to use the heatmap, cumulative volume delta and volume footprint techniques that I use below to determine very accurate demand regions, you can send me a private message. I help anyone who wants it completely free of charge.
๐I have a long list of my proven technique below:
๐ฏ ZENUSDT.P: Patience & Profitability | %230 Reaction from the Sniper Entry
๐ถ DOGEUSDT.P: Next Move
๐จ RENDERUSDT.P: Opportunity of the Month
๐ ETHUSDT.P: Where to Retrace
๐ข BNBUSDT.P: Potential Surge
๐ BTC Dominance: Reaction Zone
๐ WAVESUSDT.P: Demand Zone Potential
๐ฃ UNIUSDT.P: Long-Term Trade
๐ต XRPUSDT.P: Entry Zones
๐ LINKUSDT.P: Follow The River
๐ BTCUSDT.P: Two Key Demand Zones
๐ฉ POLUSDT: Bullish Momentum
๐ PENDLEUSDT.P: Where Opportunity Meets Precision
๐ฅ BTCUSDT.P: Liquidation of Highly Leveraged Longs
๐ SOLUSDT.P: SOL's Dip - Your Opportunity
๐ธ 1000PEPEUSDT.P: Prime Bounce Zone Unlocked
๐ ETHUSDT.P: Set to Explode - Don't Miss This Game Changer
๐ค IQUSDT: Smart Plan
โก๏ธ PONDUSDT: A Trade Not Taken Is Better Than a Losing One
๐ผ STMXUSDT: 2 Buying Areas
๐ข TURBOUSDT: Buy Zones and Buyer Presence
๐ ICPUSDT.P: Massive Upside Potential | Check the Trade Update For Seeing Results
๐ IDEXUSDT: Spot Buy Area | %26 Profit if You Trade with MSB
๐ USUALUSDT: Buyers Are Active + %70 Profit in Total
๐ FORTHUSDT: Sniper Entry +%26 Reaction
๐ณ QKCUSDT: Sniper Entry +%57 Reaction
๐ BTC.D: Retest of Key Area Highly Likely
๐ XNOUSDT %80 Reaction with a Simple Blue Box!
๐ BELUSDT Amazing %120 Reaction!
๐ Simple Red Box, Extraordinary Results
๐ TIAUSDT | Still No BuyersโMaintaining a Bearish Outlook
๐ OGNUSDT | One of Todayโs Highest Volume Gainers โ +32.44%
I stopped adding to the list because it's kinda tiring to add 5-10 charts in every move but you can check my profile and see that it goes on..
GLMR Short wait for good entryLike & Follow me for more details
GLMR Short,
BTC will break upward trend soon.
Will reach 103k
G
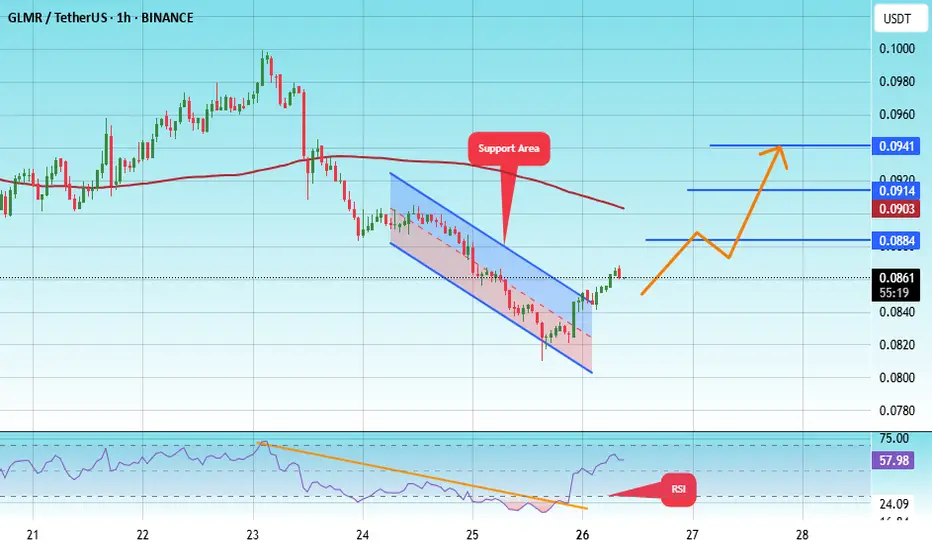
#GLMR/USDT#GLMR
The price is moving within a descending channel on the 1-hour frame, adhering well to it, and is heading for a strong breakout and retest.
We are seeing a bounce from the lower boundary of the descending channel, which is support at 0.0814.
We have a downtrend on the RSI indicator that is about to be broken and retested, supporting the upward trend.
We are looking for stability above the 100 Moving Average.
Entry price: 0.0860
First target: 0.0884
Second target: 0.0914
Third target: 0.0941